Second Quarter 2024 Market Review

Independence Day 2024 Edition

We are writing our Q2 letter from a place we nick-named “The Compound”, an isolated area in Independence Township, Michigan where the world seems to slow down, even if it’s for just a few days each year.

This is our twentieth year coming here to celebrate the 4th of July and while lots of things have changed through the years, the peace and joy of this week is the same as ever.

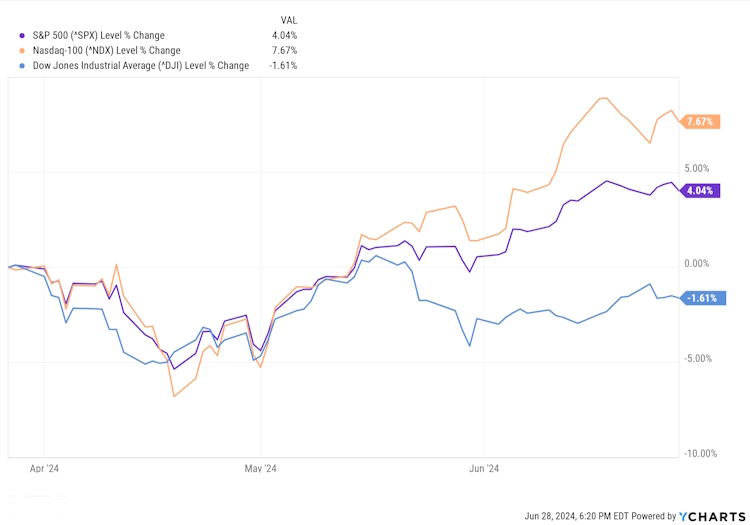
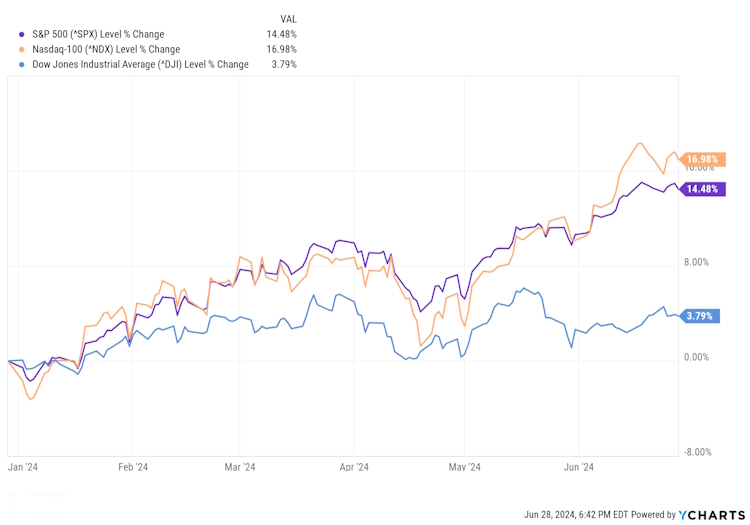
Q2 was a bumpy ride for the stock market as the major indices finishing the quarter mixed with the Nasdaq reclaiming the top spot while the Dow 30 ended slightly lower than it started.

Year to date, all indices are up, although the Dow substantially lags the S&P and Nasdaq.

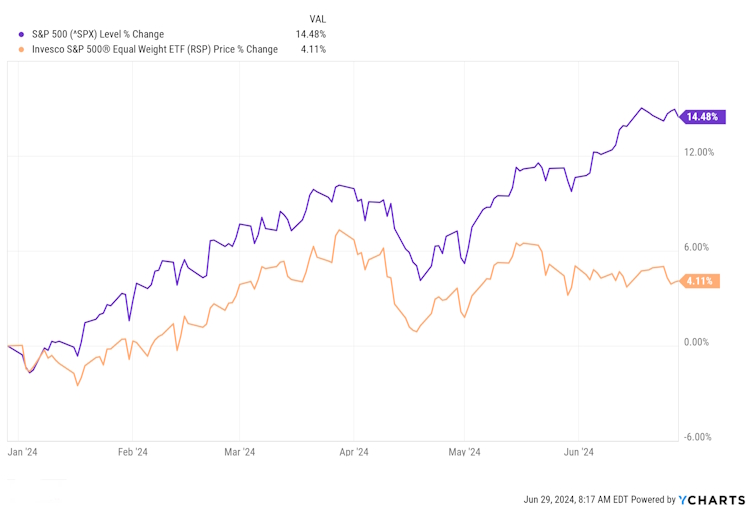
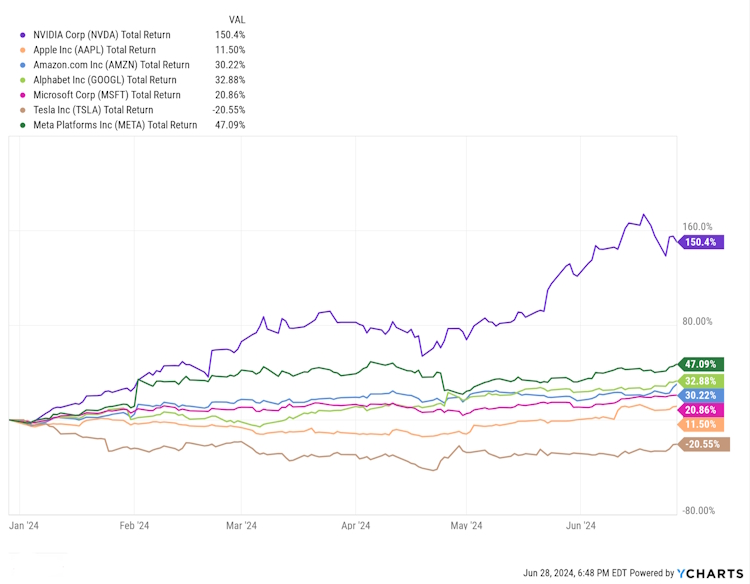
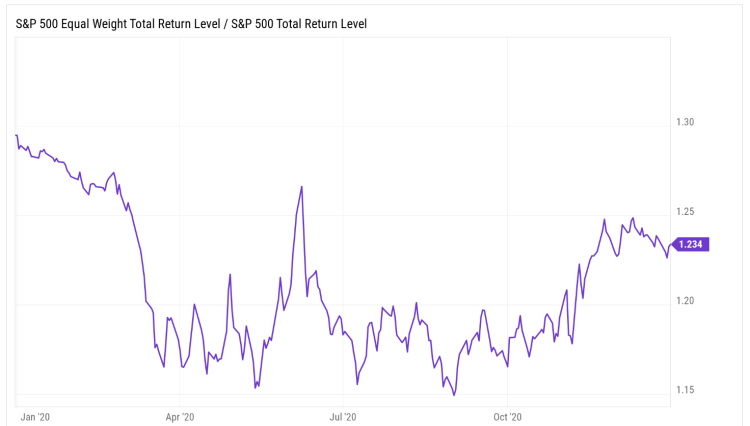
The explanation for this is similar to 2021 when the cap-weighted S&P 500 diverged from the equal-weighted index, driven by the “Magnificent 7:” NVIDIA, Amazon, Apple, Meta, Google, Tesla, and Microsoft.

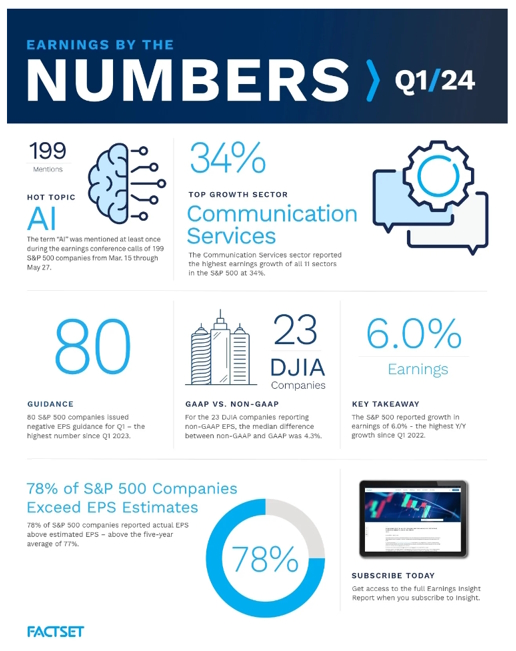
So, as we can see from the chart, the rally has been concentrated in a small number of names and unless your portfolio has similar concentrations, the returns of most stocks are much closer to the orange line. This is happening even though the earnings reported during the early part of the quarter were positive overall.

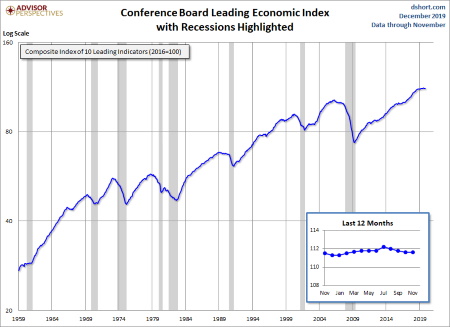
Looking at the economy, the Conference Board Leading Economic Index® (LEI) for the U.S. decreased by 0.5 percent in May 2024 to 101.2 (2016=100), following a 0.6 percent decline in April. Over the six-month period between November 2023 and May 2024, the LEI fell by 2.0 percent—a smaller decrease than its 3.4 percent contraction over the previous six months.

The May numbers were driven primarily by a decline in new orders, weak consumer sentiment about future business conditions, and lower building permits.

According to Justyna Zabinska-La Monica, Senior Manager, Business Cycle Indicators, at The Conference Board. “While the Index’s six-month growth rate remained firmly negative, the LEI doesn’t currently signal a recession. We project real GDP growth will slow further to under 1 percent (annualized) over Q2 and Q3 2024, as elevated inflation and high interest rates continue to weigh on consumer spending.”

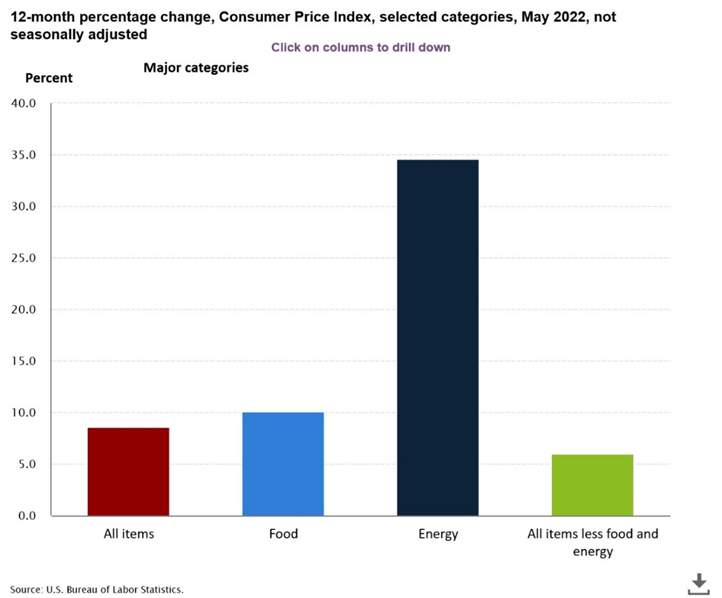
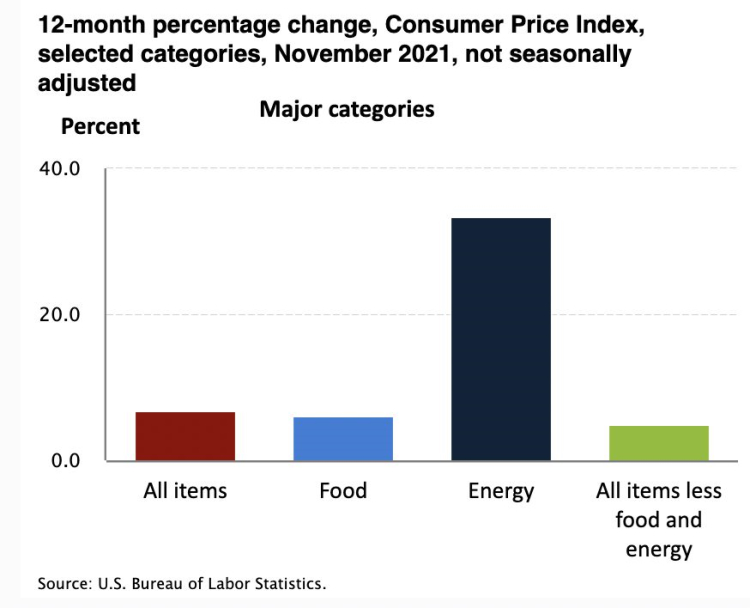
Speaking of Inflation, the May Consumer Price Index (CPI) remained flat over April and rose 3.3% over the prior year — a deceleration (not a drop) from April’s 0.3% month-over-month increase and 3.4% annual gain in prices. Both measures came in lower than economist expectations and had the lowest monthly headline reading since July 2022.

A decline in energy prices, led by a drop in gas prices, contributed to further downward pressure on headline CPI.

The “core” index, which strips out costs of food and gas, showed prices in May climbed 0.2% over the prior month, the lowest monthly core reading since June 2023, and 3.4% over last year, again lower than economist estimates.

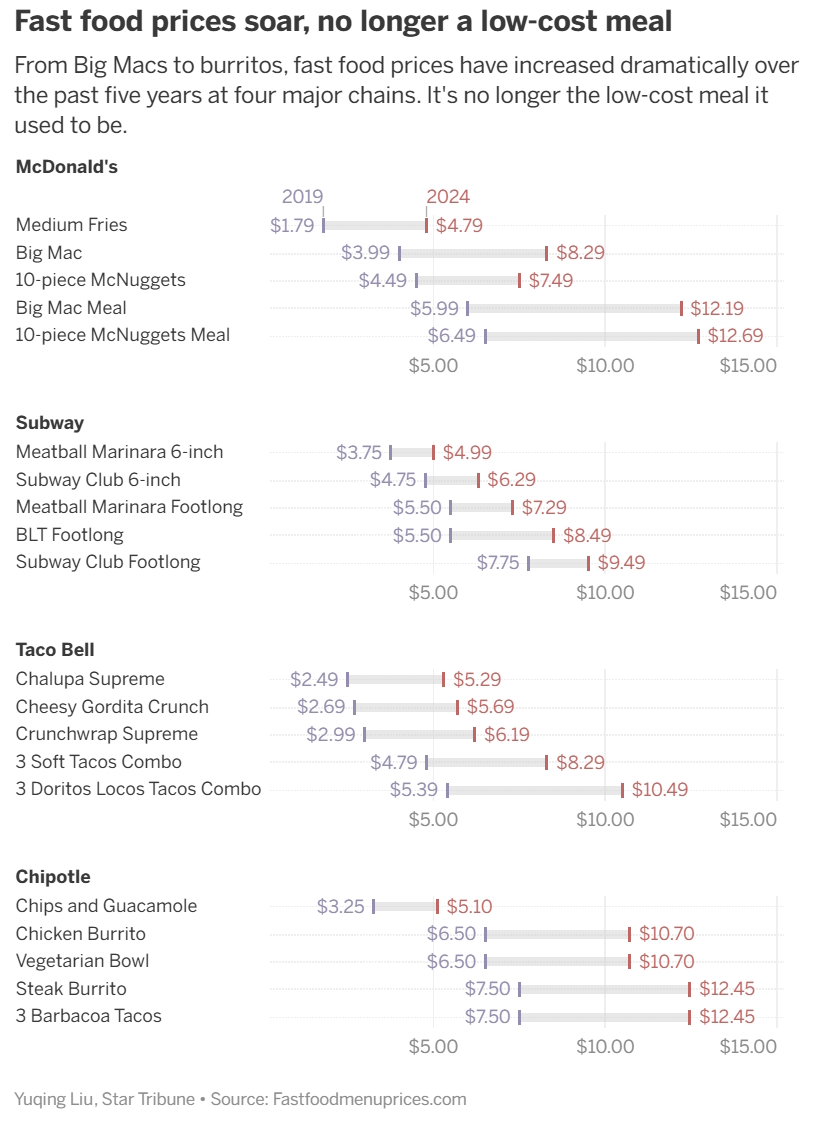
Of course, “official” government numbers don’t always reflect the experience of the average citizen. Several years ago, the “Big Mac” index was developed to measure the impact of inflation on lifestyles across the globe as McDonald’s has restaurants throughout the world. The website Fastfoodmenuprices.com has taken the Big Mac Index a step further.

While these numbers will have no influence on Fed policy, they very much have an influence on our retirement planning decisions and how we should be allocating our investments to prepare for when we no longer have a paycheck.

A new study published by Northwestern Mutual found the “magic number” that Americans believe they need to retire comfortably hit $1.46 million this year, the highest level on record. The figure represents a nearly 15% jump from the $1.27 million that Americans said they needed in 2023, easily outstripping the current 3% inflation rate in the country.

Over the past five years, Americans’ “magic number” has surged 53% from the $951,000 reported in 2020, according to the financial services firm. We don’t know how those surveyed derived those numbers; many of them likely haven’t gone through any detailed analysis like a Financial Snapshot. Still, it is telling that many people are feeling the impact of rising prices, and that impact is weighing on their views of retirement.

And Then There Was One

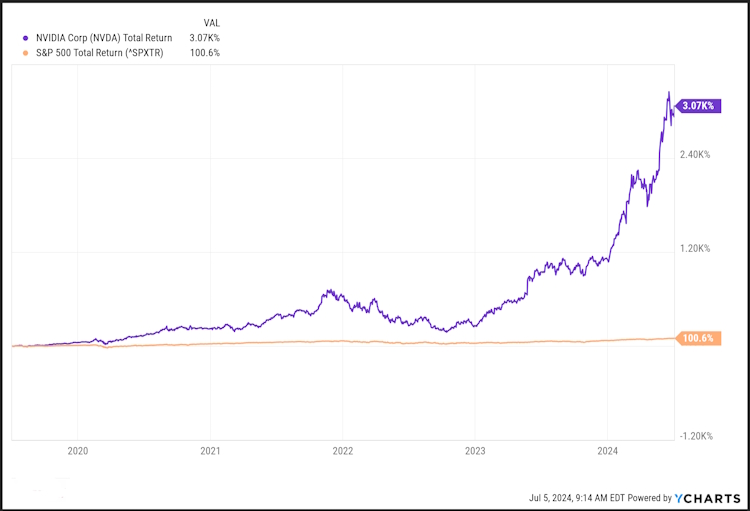
While the Magnificent 7, had carried the S&P and Nasdaq indices for most of 2023 we started to see that trend dwindle in the first quarter and it continued in Q2 with a clear separation between NVIDIA and the rest.

Can NVIDIA defy history?

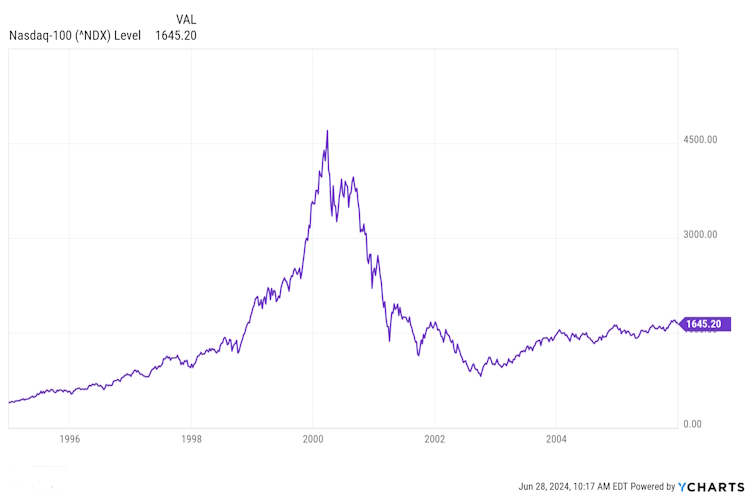
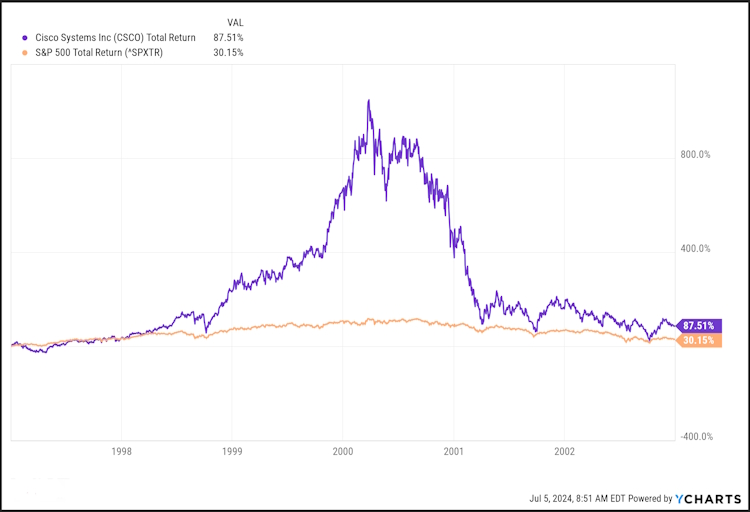
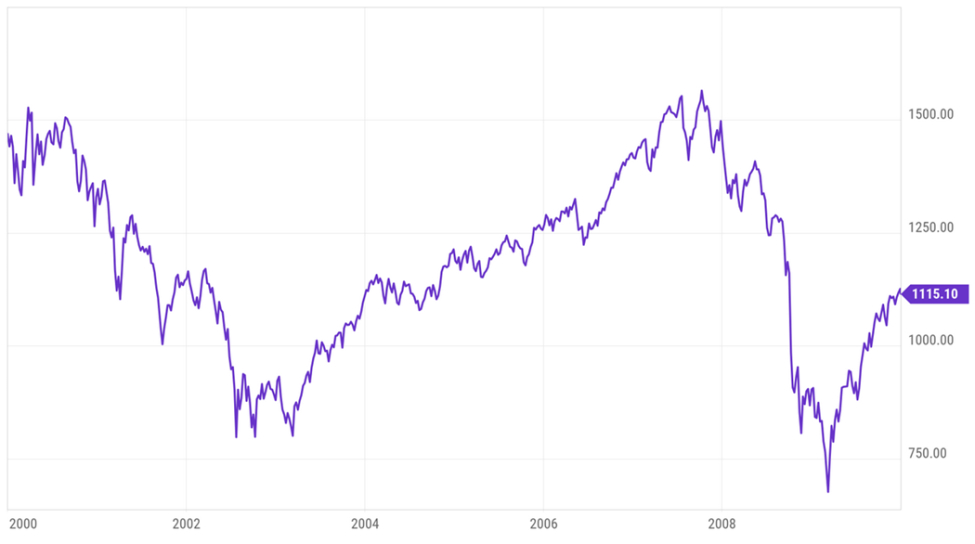
What we are seeing today is very similar to what we saw in the late 90’s when it became clear that the internet would have a growing presence in our economy. Powered by a growing army of online traders using platforms like E-trade, ScottTrade, and Ameritrade, internet-related companies saw their stock prices soar to unsustainable levels. Many of these companies were not profitable and, eventually, prices and fundamentals began to align closer to historical norms.

It is often said that history doesn’t repeat itself, but it often rhymes. Unlike many of the Internet Unicorns of the late 90s, NVIDIA is growing and profitable, they have reported triple-digit year-over-year sales growth in each of the last four quarters. and earnings grew by 790% over the past year. Still, by many measures, its price has gotten ahead of the performance of the company.

For example, NVIDIA’s Price to Sales ratio (P/S), is presently around 38 but had been in the 40s before the latest pullback. Price to Sales is a simple ratio that tells us how much investors are paying for a dollar of sales. So, anyone buying NVIDIA stock today is paying $38 for every dollar of sales NVIDIA generates. By comparison, here are the current P/S ratios for the other members of the Magnificent 7:

  • Alphabet: 7.4
  • Amazon: 3.5
  • Apple: 8.6
  • Meta: 9.2
  • Microsoft: 14.0
  • Tesla: 6.6

The P/S ratios of the other six average out to 8.2, which implies that if NVIDIA were to trade in line with the other six companies, its price would have to drop to around 80% from where it’s trading today. Although it’s worth noting that if we accept the sales growth estimates currently in place for Nvidia, the P/S ratios grow much closer looking out as little as two years into the future, meaning that the price would remain flat while sales caught up. As we have quoted before, in the short term the stock market is a voting machine, but in the long term it’s a weighing machine and eventually the scales will be brought into balance one way or another.

To be sure, there are other metrics involved in the valuation of the stock of any company. Our own favorite valuation metric, Cash-Flow Return on Investment, indicates that the stock price could go higher. Still, artificial intelligence is an investment meme right now. NVIDIA’s current rate of sales growth won’t last forever, and it may only take one bad quarter to turn the Fear of Missing Out into the Fear of Loss and send the stock price lower.

Growth Investing is exciting when it’s working but it can be devastating for people counting on annual growth to keep up with their spending. This is a concern that we have echoed repeatedly since we started composing our client letters.

In a recent article on the website Tradethatswing.com, Cory Mitchell makes the point that

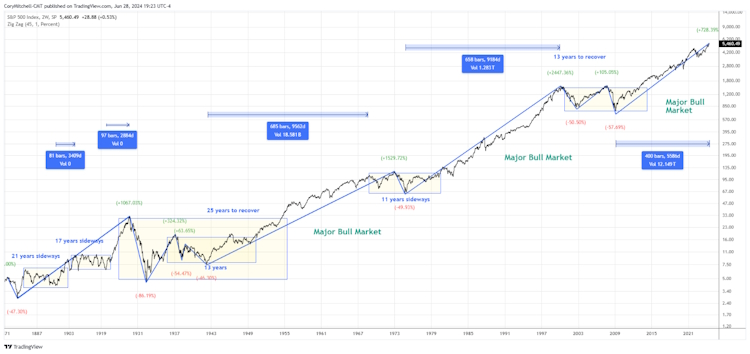
The US stock market has a long history of producing double-digit yearly returns. The average yearly return for the S&P 500 is 10.64% over the last 100 years.

However, while these statistics can make it seem like the stock market marches higher almost every year, stocks tend to move sideways quite a bit of the time. Averages of any kind can be deceiving and a 10% average return for an index doesn’t mean you make 10% each year. Some years you are making 20% or 30%. In other years, you watch your account drop, and in other years all you get are dividends with no gains.

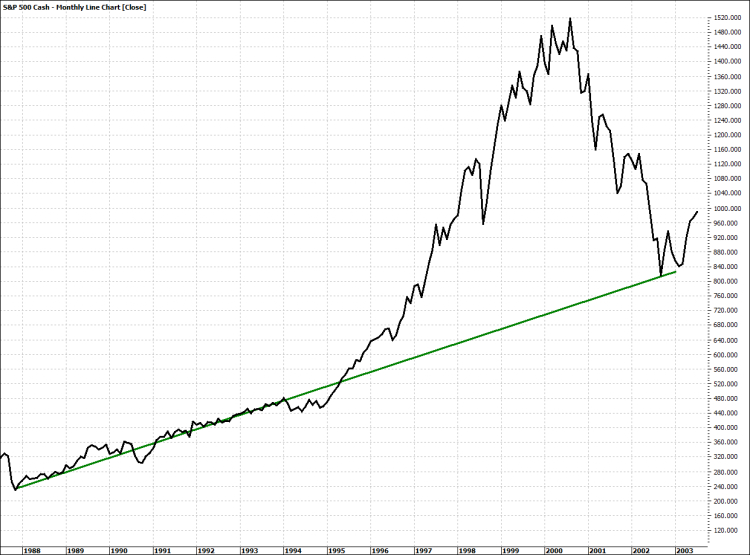
As highlighted in the graph below, most of the progress in the stock market over the last 150 years has come in three big moves: mid-40s to mid-60s, 80s-2000, and 2010 to now. The rest of the time stocks moved sideways, with little growth, sometimes for decades. During such times, dividends would be the only return.

For those who would like to access this graph, here is the link – Historical Average Stock Market Returns for S&P 500.

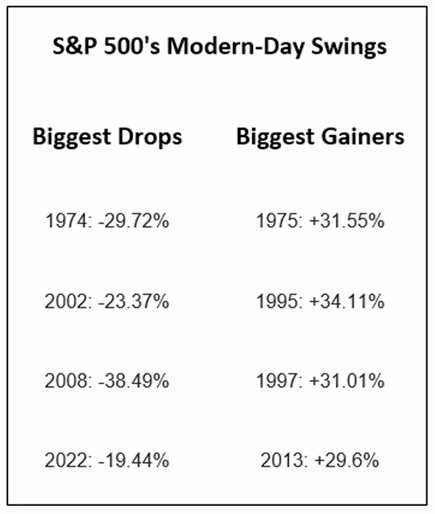
Over the long term and depending on when you started, U.S. stocks might return 10% a year on average. But in any given year, their performance could diverge from that average quite dramatically. The table below lists some of the market’s biggest annual wins and losses during the modern era.

Imagine needing to withdraw some of your money at a time when your portfolio has lost a third of its value, or just simply sitting through a period when your portfolio loses a third of its value. Many people have found out the hard way that they’re not able to stomach market volatility and they end up pulling chunks of money out of the stock market and locking in those losses for good.

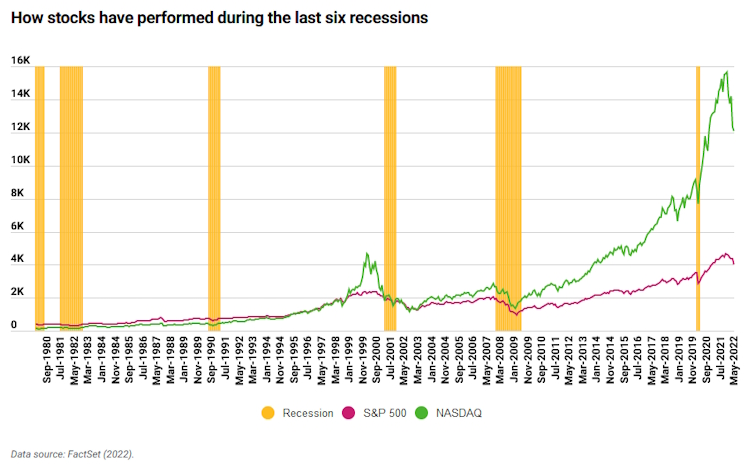
Nobody can predict the length or severity of a downturn. In 2020, we believed that the sell-off was panic-induced, not helped by the various experts and news outlets who seemed to contradict themselves hour by hour. Once the general public figured out that COVID was not going to end life on earth and that oceans of government stimulus were flooding the world economy, stocks quickly recovered and headed to new highs.

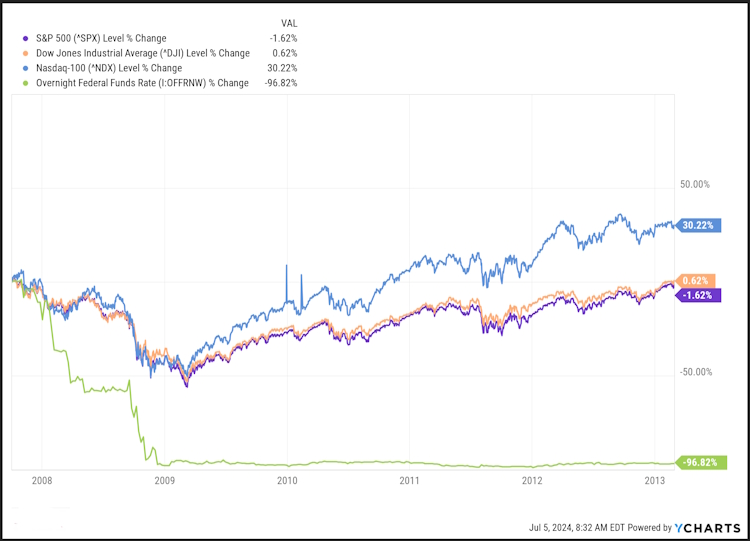
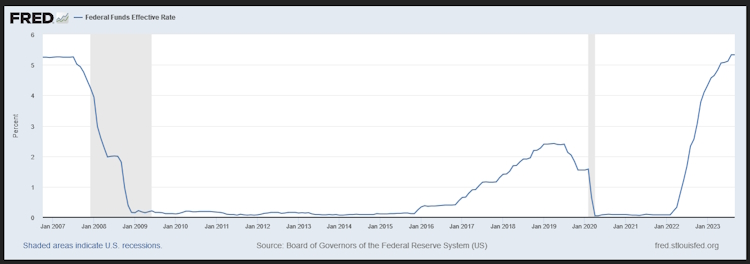
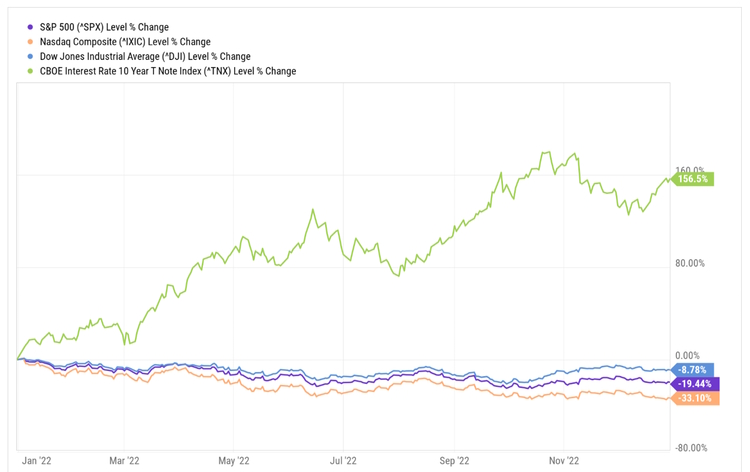
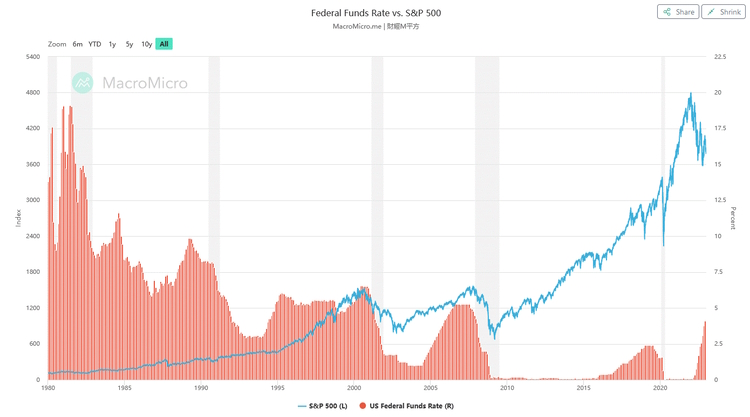
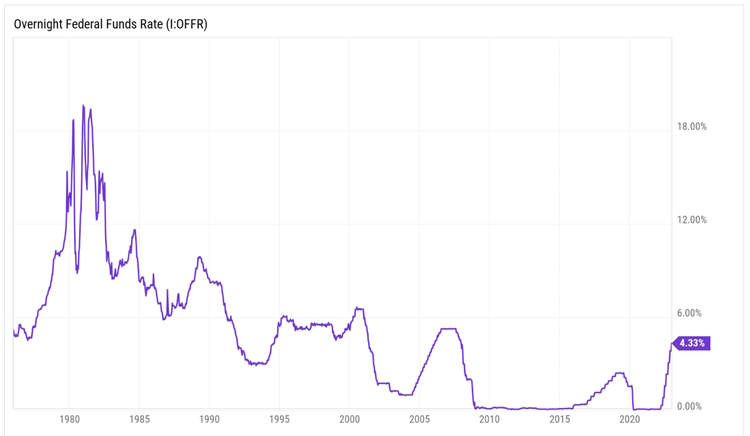
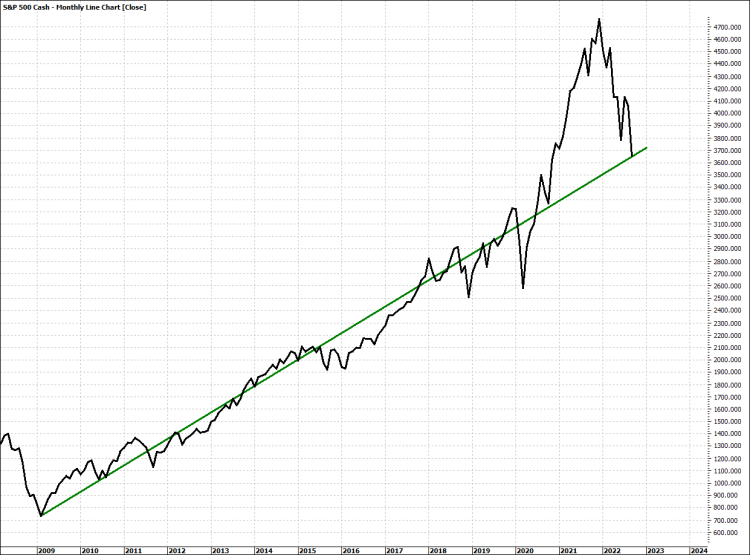
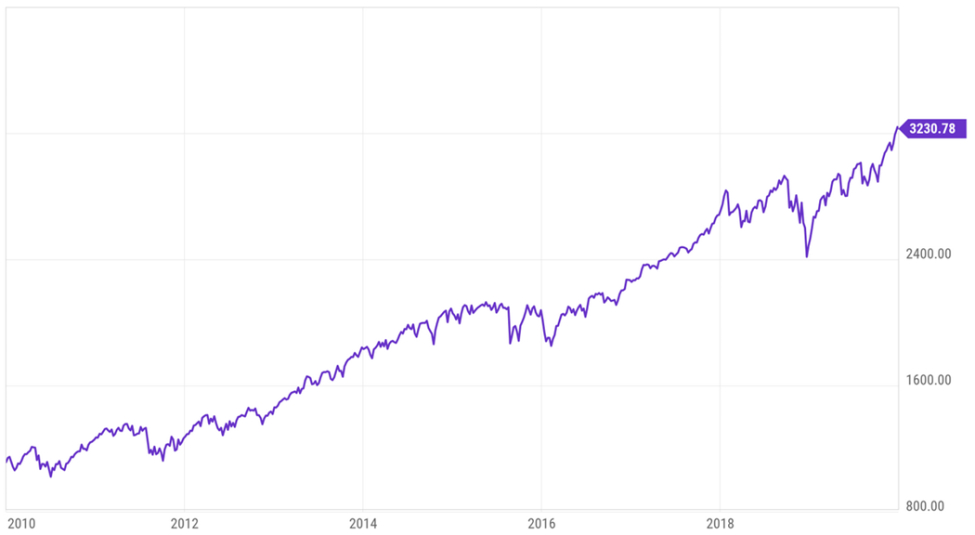
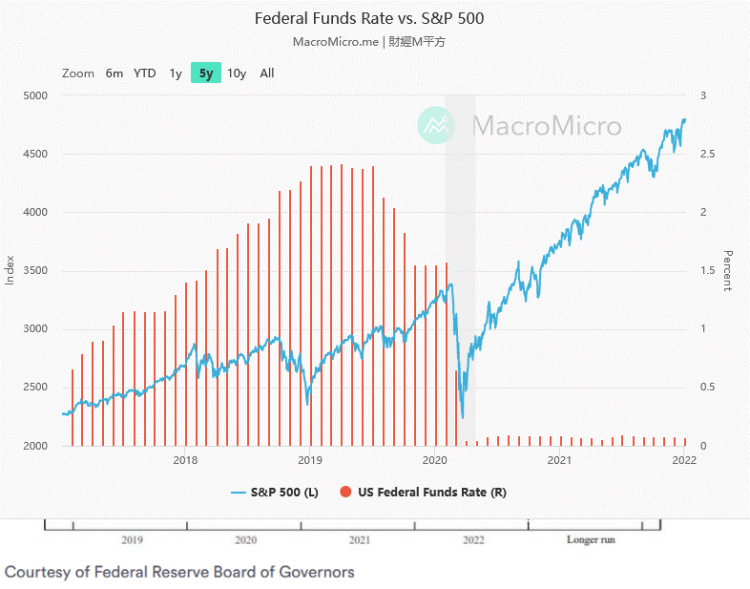
Downturns like the 2008 Housing Bubble lasted a lot longer and the recovery was much slower led by the Nasdaq 100 in the “new normal” of ultra-low interest rates (green line) that lasted until 2022.

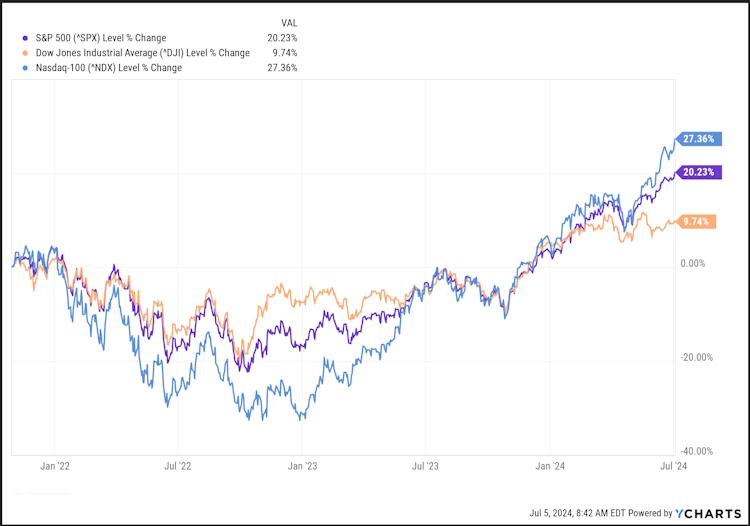
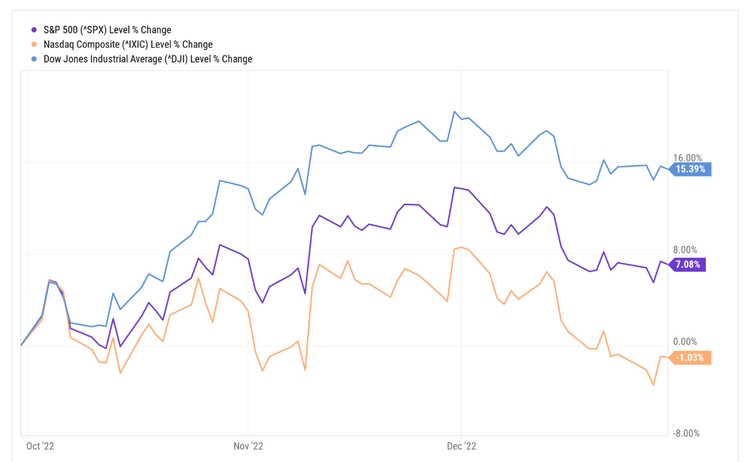
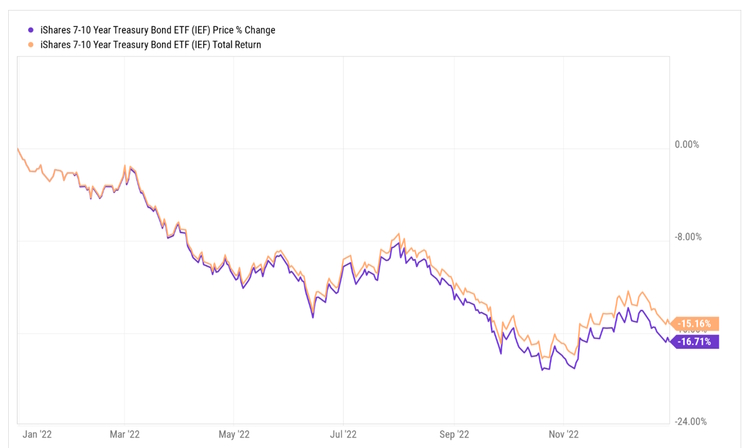
All three indices dropped in 2022 but started to turn around in October of that year after the Fed announced a “pause” in their interest rate hikes and has since recovered to new all-time highs in 2024 with great fanfare.

There’s just one inconvenient fact that these celebrations ignore.

Back to Inflation

Above, we spoke about the impact of inflation on our daily cost of living, but we also have to consider the impact of inflation on our investment strategies.

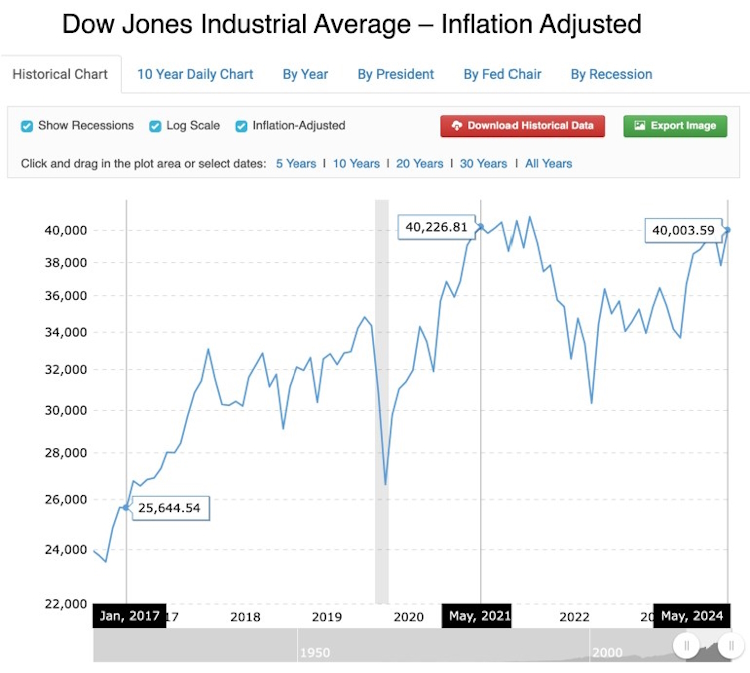
Starting with the Dow Jones Industrial Average which topped $40,000 for the first time since May of 2021, when inflation is factored in, the Dow has been flat for the past three years (see chart below).

In his Tradethatswing.com article mentioned earlier, Mitchell reports similar findings, noting that.

The historical average yearly return of the S&P 500 is 14.61% over the last 5 years, as of the end of May 2024. This assumes dividends are reinvested. Adjusted for inflation, the 5-year average stock market return (including dividends) is 10.08%.

US Stock Market 5-Year Average Return

  • Annualized Return (including dividends): 14.606%
  • Annualized Return (including dividends) Inflation Adjusted: 10.081%
  • Annualized Return (no dividends): 12.895%
  • Annualized Return (no dividends) Inflation Adjusted: 8.438%

In other words, inflation has reduced returns (with or without dividends) by more than 400 basis points over the last five years. If you’re planning to retire on your capital gains using the still oft-quoted 4% rule, you could be digging a hole that you may not be able to get out of without substantial trade-offs, especially in your later years.

Does this mean we ignore growth? Absolutely not, we invest for growth by finding companies with strong fundamentals such as low debt, growing revenue and earnings, and not just a surging stock price. Many of these companies pay dividends, others do not.

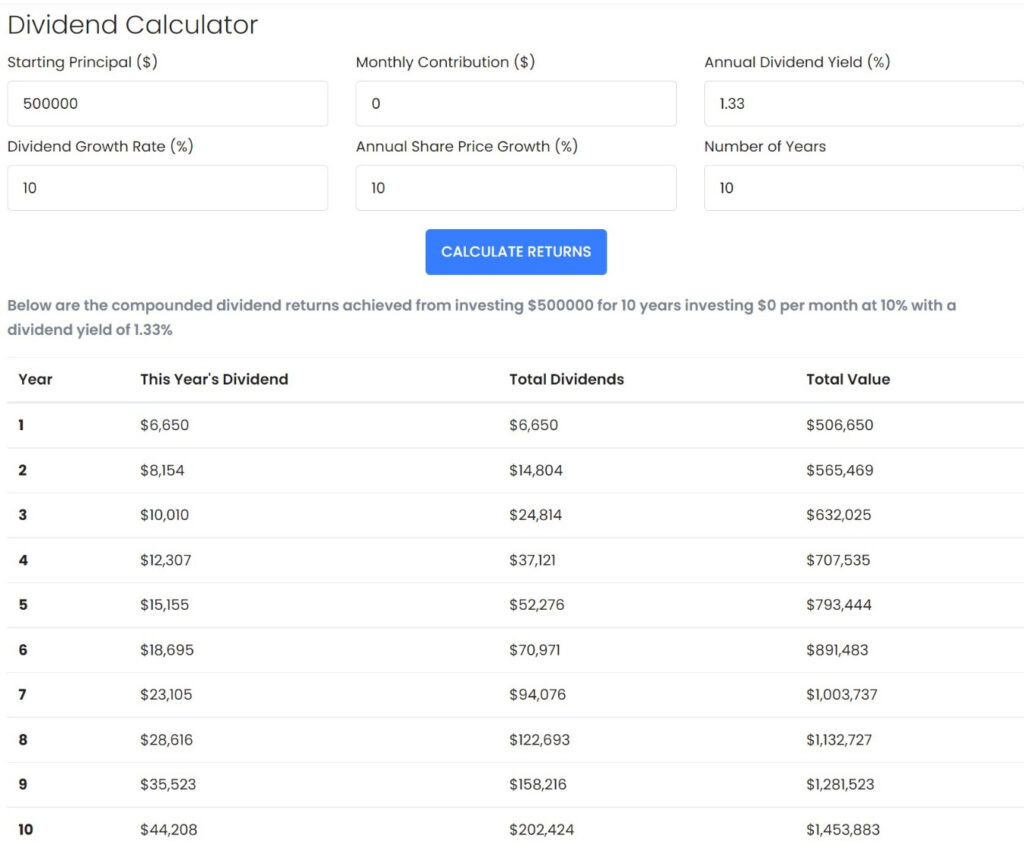
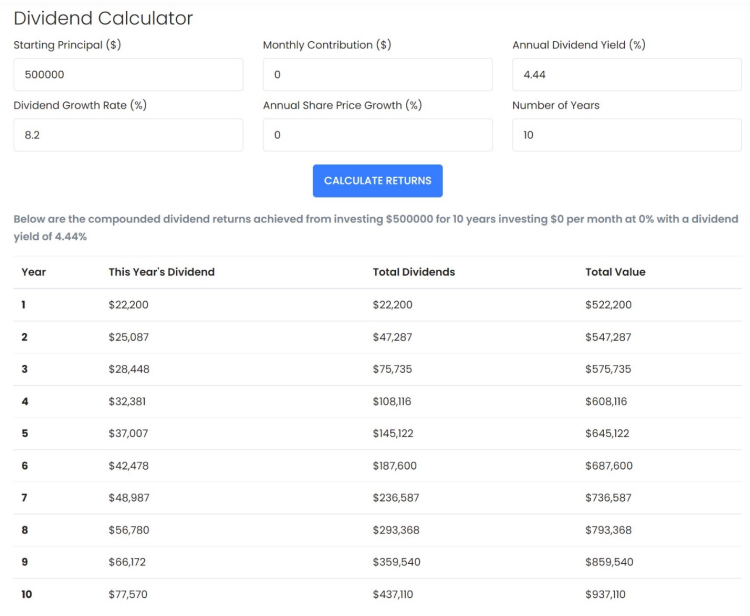
For those who have time, dividend reinvestment strategies can have a big impact on your investments. Currently, there are over 260 companies with safe or very safe dividend ratings that have increased their dividends by at least 5% over the last 20 years. Out of that list, over 200 of them have a five-year growth streak of over 5%.

That gives us more than enough candidates for a well-diversified dividend-income portfolio.

For cash needs in less than five years, we can use bonds, cash equivalents, or even cash to provide some return while making sure the principal will be there when it’s needed.

Having a solid mix of different assets can help smooth out the annual ups and downs of the various markets, give you liquidity no matter what’s happening, and with proper management, can even keep your wealth growing.

There are three general threats to financial independence and a comfortable retirement: longevity, inflation, and market volatility. This is why we start with the financial snapshot, so that investment allocations can be better aligned with both short and long-term cash flow needs.

Like most endeavors, the pursuit of financial independence is a balance of paying attention to what is happening now to prepare for what will happen next. Most individual investors are solely focused on what’s happening now:

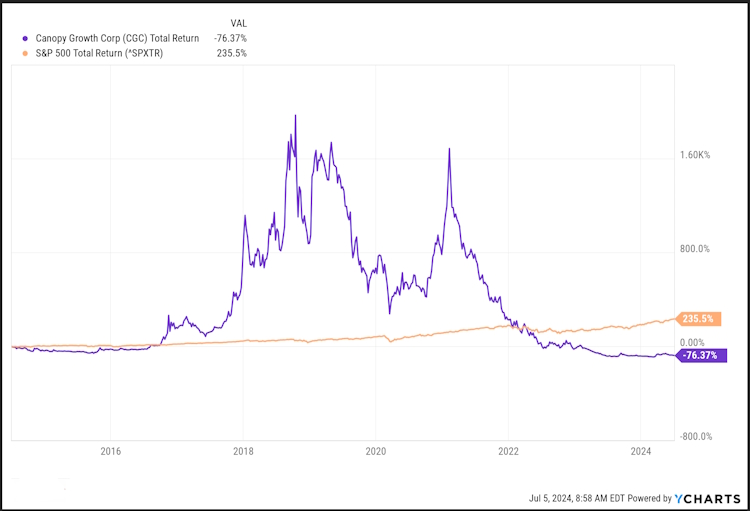
Dot Com

Pot stocks

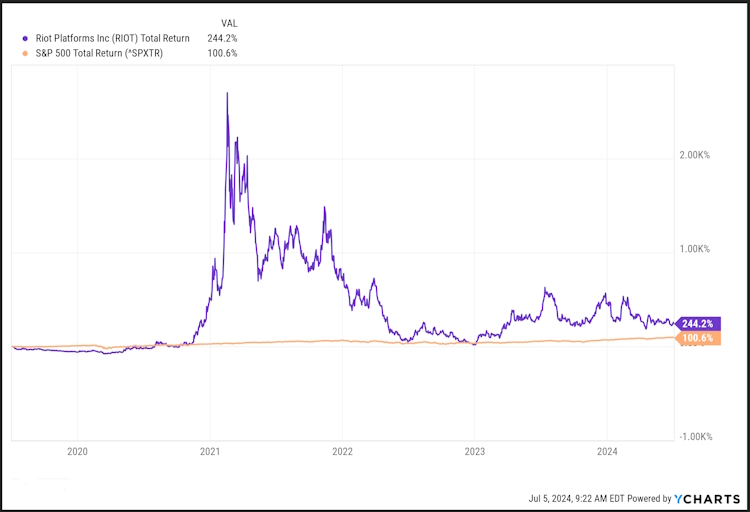
Blockchain

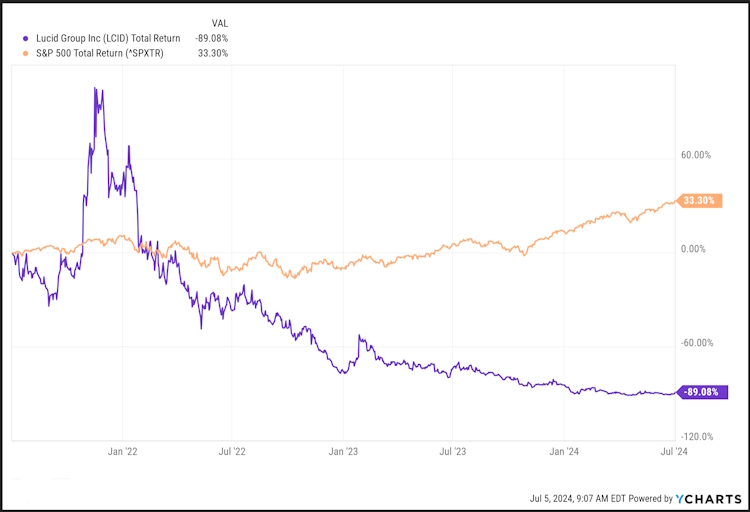
Electric Vehicles

AI?

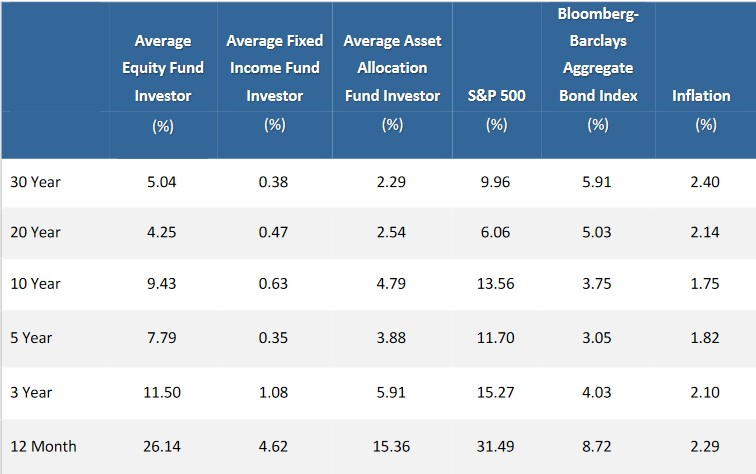
Chasing price action is one reason why the average investor underperforms the market by a wide margin.

While we all know “of” someone who put all their money in XYZ stock and became a multi-millionaire “overnight,” very few of us actually know someone who’s done that. If everybody’s stories in the breakroom or on the golf course were true, we would likely see the Average Investor (orange above) lined-up between the S&P 500 and the “60/40” allocation. Most often, the big gains we hear about makeup only half the story.

Recent findings indicate that 56% of American workers feel behind where they think they should be on their retirement savings, including 37% who feel “significantly behind,” in this, arguably the most prosperous nation on the planet.

Building wealth and achieving financial independence is a slow, deliberate, aggravating, and even boring process. It begins with asking “What’s Next” – career change, early retirement, replacing your paycheck, inflation, future tax policies, and potential illness, – and takes advantage of identifying “What’s Now” to position yourself for managing through future uncertainties.

Our goal is not to beat a market index or our neighbor’s portfolio in any given year. Our goal is to help our clients achieve their individual financial goals over the long term with as little risk as is required to do so. Just this month we are celebrating two clients who are making the transition to retirement. It took some work to get there and for us the work isn’t over as some retirements can last longer than a career.

But to be able to say to them “congratulations” is so much more rewarding than beating an index.

As we celebrate Independence Day this week, we are thankful to live in a part of the world where such an ideal is still possible.

Read More

First Quarter 2024 Market Review

The Trend Is (still) Your Friend

It’s an election year in the United States, inflation is still shrinking the buying power of everyone’s pocketbook, wars have broken out all over the globe, the national debt has topped $34 trillion with no sign of cresting, the banking system is on the brink of collapse and the Federal Reserve keeps pushing off the rate cuts they “promised.”

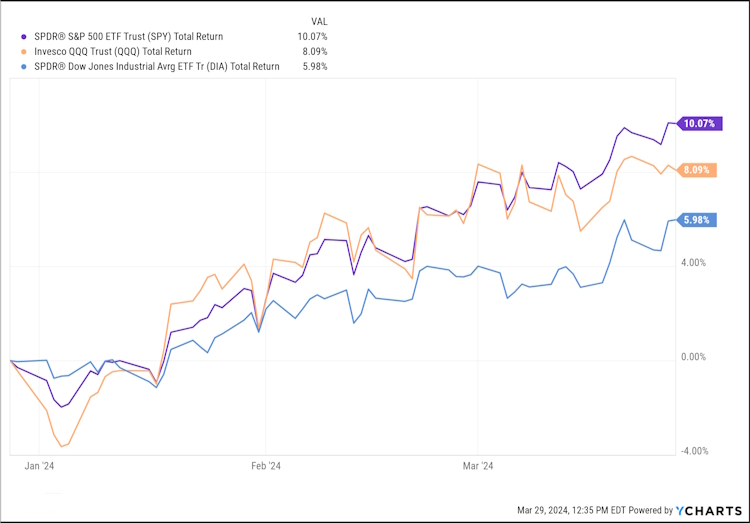
Sounds like an explanation as to why everyone’s investment account is down year to date except that it’s not the case. The S&P, Nasdaq, and Dow Jones Industrial indices all produced solid gains for the quarter as measured by the large ETFs that track them (SPY, QQQ, and DIA).

Note that we are using the Index ETFs as that is how the average retail investor would invest in an index. We will be using these going forward.

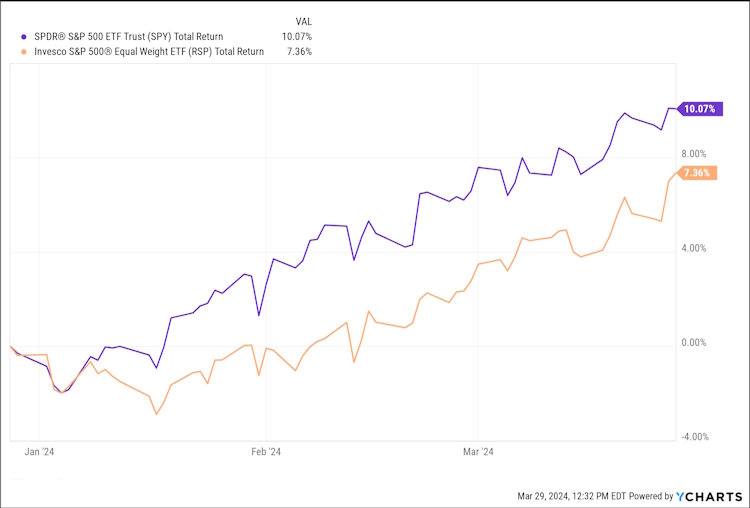
Looking at an equal-weighted portfolio (RSP) versus the tech-heavy, market cap-weighted one (SPY), we see that, unlike much of 2023, the smaller companies are participating in the market’s rally, continuing the trend we saw in Q4. SPY is also indicated by the fact that the S&P 500 ETF, SPY, outperformed the Nasdaq for the quarter, something that we have not often seen recently.

So, why is the market going up? Let’s look under the hood at those things that we believe drive the market.

The Business Environment

Q4 2023 earnings were slightly subpar with 73% of S&P 500 companies reporting actual Earnings Per Share (EPS) above analyst estimates, below the five-year average of 77%.

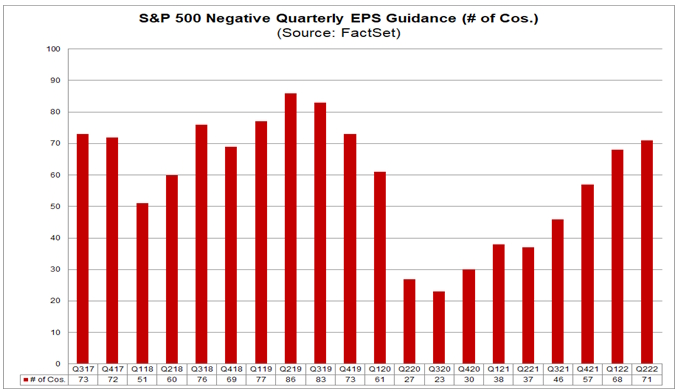
73 of the 500 companies issued negative guidance for Q4, which is above the 10-year average of 62 out of 500.

Overall, however, the S&P 500 reported growth in earnings of 4% making this the second straight quarter of year-over-year growth.

Source: Earnings Insight Infographic: Q4 2023 By The Numbers (factset.com)

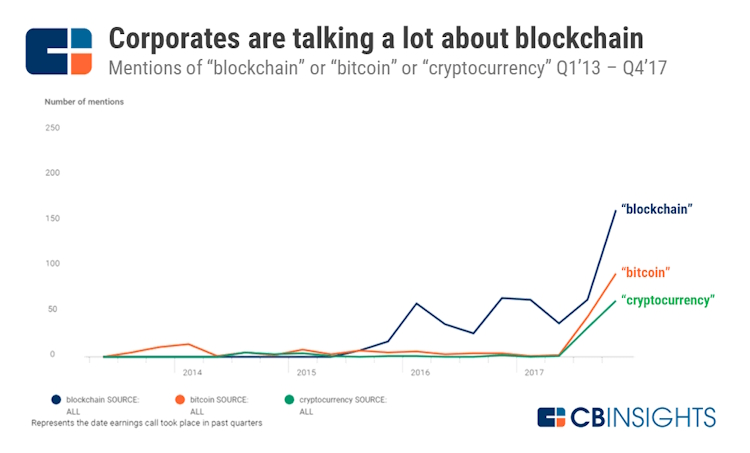
Unsurprisingly, 179 companies cited Artificial Intelligence, or “AI” in their earnings calls, just below the all-time high of 181 during Q2 of 2023.

This is highly reminiscent of 2018 when Bitcoin had reached an all-time high of $20,000 and the fear of missing out was at fever pitch. The fever peaked when a publicly traded company called Bioptix, which was known for having a veterinary products patent, changed its name to Riot Blockchain and went from a price of $8.00 per share to more than $40.

The company still exists under the name Riot Platforms and is currently trading around $12 per share.

The Economy

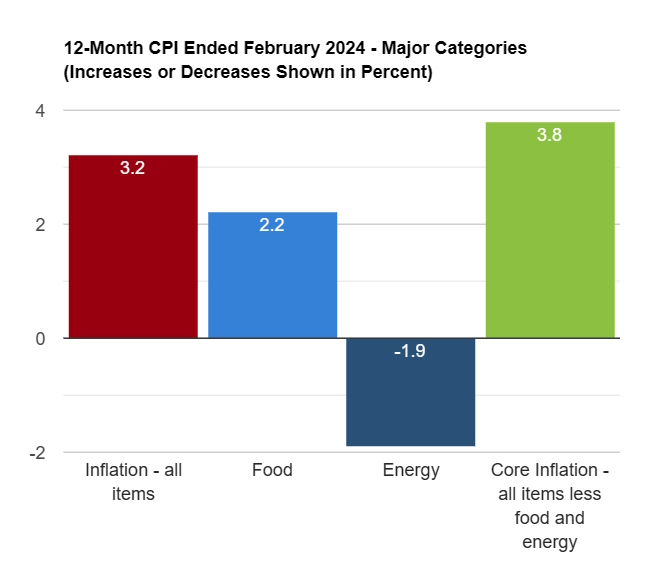
Starting with the inflation front, which is a key driver of the Fed’s interest rate policy, Consumer price increases remain stubbornly high according to USInflationCalculator.com.

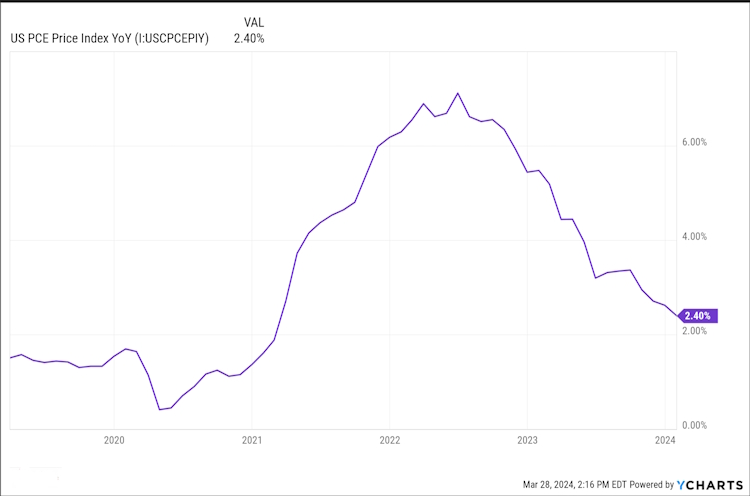
While the preferred measure, PCE, has shown more improvement, it is still above pre-pandemic levels.

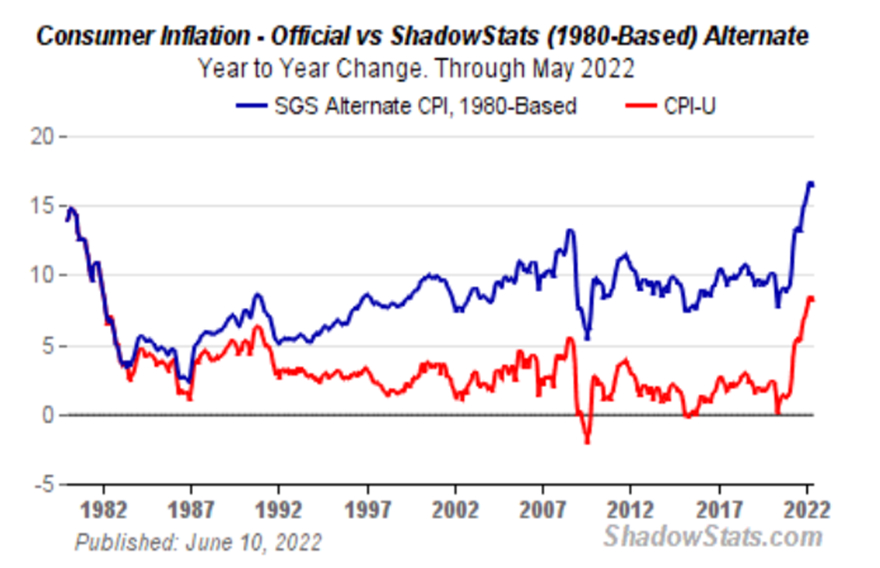
Larry Summers, an economist, and former Treasury Secretary for President Clinton and Director of the National Economic Council for President Obama, published a study in 2022 where he claims that the changes to the CPI calculations over the years are dramatically understating the current rates of inflation.

Of course, this would come as no surprise to John Williams over at Shadowstats.com who has been publishing Alternate Data based on 1980 and 1990 methodologies for over a decade. According to Williams, based on the 1990 methods of calculation, inflation is hovering right around 8% and well over 10% based on 1980 methods.

We’re sure that while John welcomes validation from someone like Summers, he takes no pleasure in being right as these high prices always impact those with the least ability to deal with them.

As we have stated before, the Fed needs inflation to deal with the growing national debt as we are way beyond the ability to just pay it off.

However, it is not wise to publicly state such policies, so instead, they change the calculations and hope we don’t notice. Even with the most recent “changes” though, we are still above the “ideal” target of 2%.

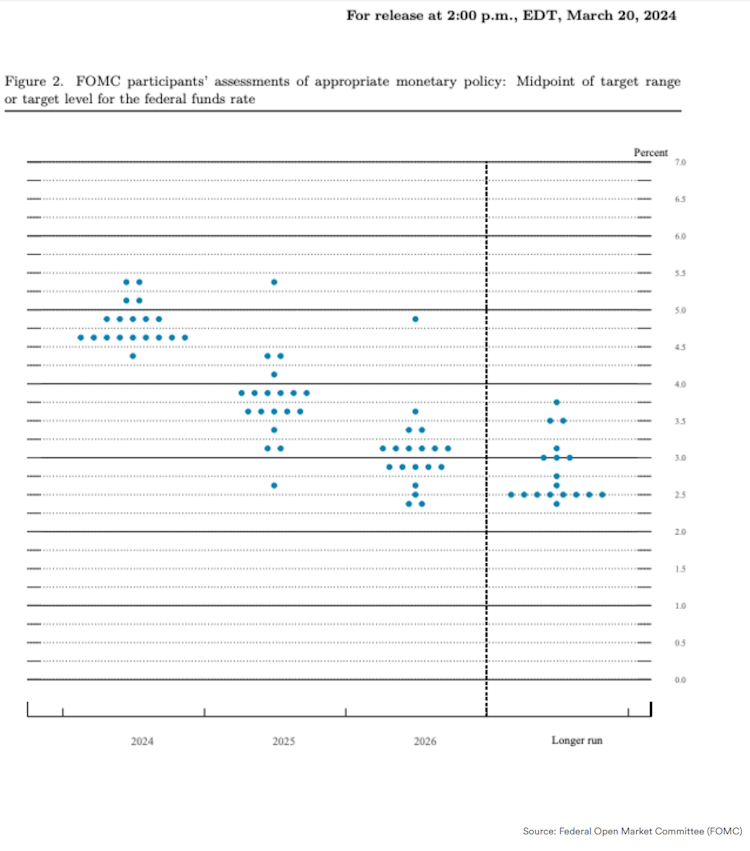
Yet Powell & Co. are still projecting three rate cuts this year according to their latest Dot Plot.

Call us skeptical, but we do not see a compelling reason for rate cuts at this time. As we noted above, inflation is still above the target rate and recent data indicates the rebound in inflation may be prolonged. Shipping troubles, even before the incident in Baltimore, and geopolitical tensions in the Red Sea have contributed to rising prices.

The economy and job market, as measured by the Fed, continue to grow and areas such as health care, apartment rents, and restaurant meals still experience persistently high inflation. So, if the economy is at least stable, if not growing, and the job market is still healthy, there is no economic justification for lowering interest rates.

US Real GDP Growth, measured as the year-over-year change in the Gross Domestic Product in the US, adjusted for inflation is at 3.40%, compared to 4.90% last quarter and 2.60% last year.

How much of this is organic growth versus stimulated growth is difficult to accurately assess. Although growth is down from the peak in 2022, post-pandemic spending is still alarmingly high for what we would expect to see based on Keynesian economic models which almost all government economists claim to follow.

When the government injects substantial funds into the economy through deficit spending, it can provide an immediate boost. These funds flow into various sectors, creating demand for goods and services. The resulting economic activity can lead to higher GDP growth rates, lower unemployment, and improved consumer sentiment. In the short term, this can indeed make the economy appear healthier than it really is.

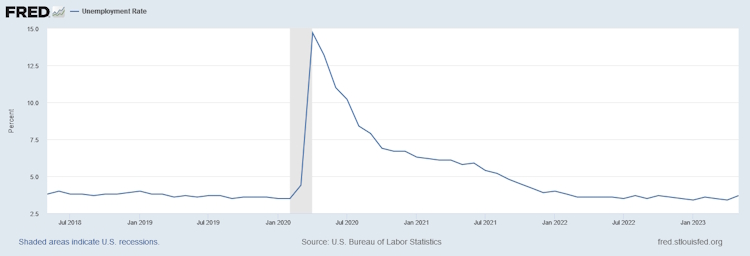
The employment front is a little easier to examine and the strong headline numbers reported each month appear slightly misleading.

The headline number focuses on quantity, but it doesn’t differentiate between full-time, part-time, or temporary positions. The BLS considers someone employed if they work just one hour per week, so a surge in low-paying, gig economy jobs or someone taking on multiple jobs could inflate the total count without necessarily reflecting robust employment quality.

The headline figure also doesn’t account for changes in labor force participation. If discouraged workers drop out of the labor force the unemployment rate may appear lower, even if the overall job market isn’t thriving. Finally, the initial job reports are subject to revision as more accurate data becomes available. For instance, looking at the February report, we see:

The change in total non-farm payroll employment for December was revised down by 43,000, from +333,000 to +290,000, and the change for January was revised down by 124,000, from +353,000 to +229,000. With these revisions, employment in December and January combined is 167,000 lower than previously reported.

So, if things aren’t as rosy as they appear, why are we at record highs for all three indices? The most popular explanations that we have heard, in no particular order are:

  • The markets are forward-looking, so investors are pricing in future profits today and Artificial Intelligence is going to unleash the greatest of innovation and prosperity since the internet.
  • The bond market knows more than all stock market investors and Federal Reserve governors put together and the 10-year Treasury yield is currently 4.2% versus the Fed Funds Rate of 5.31% indicating future rate cuts of over 110 basis points (BPS), which is bullish for stocks.
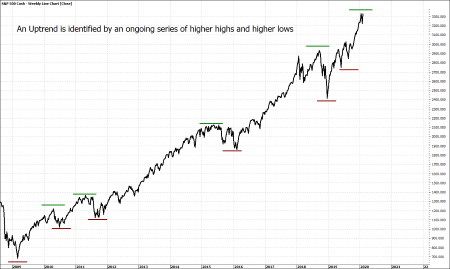
  • The stock market is simply in an uptrend and stock market trends often exhibit a remarkable persistence. They tend to stay in place until certain conditions or events such as central bank policy shifts, regulatory changes, technological breakthroughs, or unexpected events (like a pandemic) prompt a change.

All three explanations are reasonable, and we have seen nothing technical that indicates that, without a catalyst, there is no reason why the indices won’t continue the uptrend.

So, with that, let’s look at the possible catalysts that could cause the trend to end, also known as:

Things (still) Keeping Us Awake at Night

Chinese Real Estate Collapse

While the focus is on real estate because that is an area where we have some available information, our bigger concern is the overall Chinese economy.

Evergrande, a major Chinese real estate developer, filed for bankruptcy in August of 2023. A Hong Kong court has now ordered the liquidation of the company after it was unable to restructure the $300 billion it owed investors.

Evergrande has become symbolic of a Chinese economy that faces some major near-term obstacles: slowing growthincreasing debt, and a shrinking workforce. This is reflected in the performance of their stock market. Using shares of Blackrock’s China Large-Cap ETF (FXI) as a market proxy, not only has the market not recovered from pandemic-related weakness; shares have fallen well below the levels reached in 2020. This is not what you would expect to see from the world’s second-largest economy if it were in good health.

Again, as is so often the case, our concern is not with the crisis itself, but with how those in power react to the crisis. Diana Choyleva, a senior fellow on China’s economy at the Asia Society sees the potential for deflation ahead as the Chinese economy struggles with several issues going forward. In November, consumer prices in China fell at their fastest rate in three years.

Choyleva says. “If China is having severe deflation at home, pretty much the only choice left would be [for it] to export deflation.” This means that U.S. businesses would then be forced to compete with a flood of “discounted” Chinese products which would threaten revenue and profit margins.

Or worse, China could try and deal with deflation the way we did during the Great Depression and “go to war” by deciding that “now” would be the best time to unify with Taiwan.

Neither of these scenarios is good and our government’s response to either of them might exacerbate the problems.

BRICS+

If the Chinese were to decide that military conflict is their best solution to overcoming their economic troubles, they would likely try to mitigate the risk of dollar-based financial sanctions in advance of taking any actions.

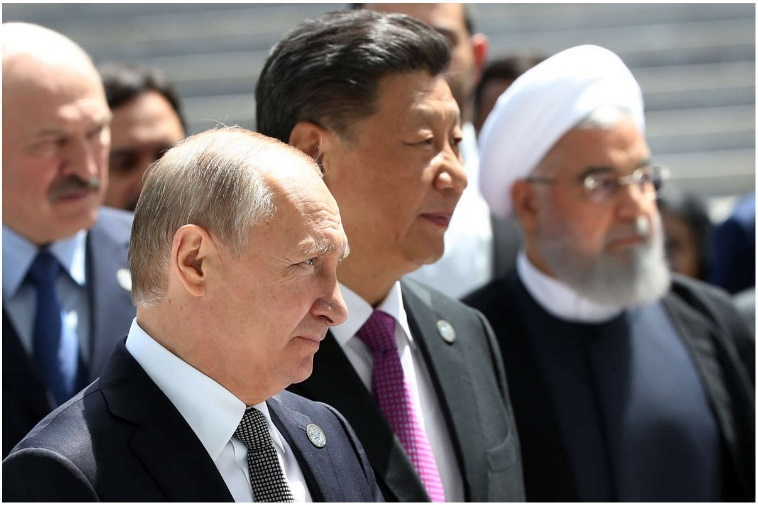
While the 2023 BRICS Summit did not yield an official announcement regarding a new currency, there is still a strong desire, especially by Russia and China, to establish one. Even if they are not successful in doing so, there are still many actions including currency swap agreements, creating alternative financial systems such as “development banks” operating outside of the global financial system, and even counter-sanctions as the BRICS have considerable control over global energy markets, critical minerals, and natural resources that are vital to our economy.

Social Security

According to the latest Social Security fact report, released in August 2022, without any changes, the Social Security system is now projected to be insolvent in 2035 (that’s 11 years from now), while Medicare is expected to face insolvency even sooner, in 2028 (just 4 years away). Again, we do not fear the crisis, as much as the response to the crisis.

While we have not seen any reasonable fix for Medicare, several steps can be taken to fix the Social Security system.

When Social Security was enacted in 1935, the average life expectancy of an American woman was 64, and 60 for an American man. If we had simply adjusted the Full Retirement Age (FRA) in line with the average life expectancy, the Full Retirement Age today should be either 76 or 77 according to the CDC (depending on whether you are using “at birth” or “at age 21” life expectancy). Even Larry Fink from Blackrock, whom we hardly ever agree with, mentioned the same thing in his annual letter to investors.

Of course, a structural change of this magnitude is easier said than done and any attempt to make those changes overnight would result in political uproar. A measured approach such as incrementally raising the benefits ages by one year, while leaving current recipients “unharmed” would have a greater chance of acceptance.

For example, if the system were changed so that every two years the age limits across all benefit levels (age 62 to 70) were raised by one year, a 65-year-old today who plans on waiting till age 70 to maximize benefits, would now have to wait until age 72 instead.

While there is no scenario where everyone would be pleased, given the choice of waiting two additional years for the full payout or taking a potential benefit reduction of 23 to 25% in 10 years, most rational people would take the delay. It might also create greater incentives to save for retirement so that people could still quit or reduce working hours at a younger age.

This is just one idea. Unfortunately, many of the other ideas being floated around in Washington D.C. tend to be on the opposite end of the spectrum. Perhaps the most troubling we’ve heard is the elimination of pre-tax benefits for 401K programs to collect more taxes now, which in theory would be targeted to shore up social security.

It’s not that we doubt the sincerity of our elected politicians to keep their promises, but we recall that as part of the Health Care and Education Reconciliation Act of 2010, President Obama signed into law a major overhaul of the student loan system to save an “expected” $68 billion which would be used to improve the quality of the education system and make it more affordable. Today student loan debt exceeds $1.6 trillion and loan forgiveness has become a political issue while college costs have continued to rise and education outcomes continue to deteriorate.

Our Thoughts on Artificial Intelligence

As we noted above, the investing meme of the year has been Artificial Intelligence (AI). Before going any further, we should distinguish between AI and Generative Pre-Trained Transformers, better known as GPT.

AI has been around since the 1950s when IBM researcher Alex Bernstein created the world’s first complete chess-playing computer program in 1957, which ran on an IBM 704 mainframe.

The issues surrounding AI’s advancement were on the hardware side. There just wasn’t enough computing power back then to allow the programmers to develop more sophisticated programs. AI is a powerful analytical tool that can be applied to nearly any complex analytical task.

GPT is relatively new and while it can be effective at some tasks, it still has some serious limitations as observed during the rollout of Google’s version of an AI chatbot called Bard.

Still, this technology also has a lot of promise, especially with the rapid advances in computing power that we are seeing. But, instead of us telling you about it, how about letting the technology literally speak for itself?

“Hey, Copilot (the Microsoft Edge version of an AI-powered search companion), you are my investment analyst, which industries or sectors of the economy could benefit the most from the application of Artificial Intelligence technology?”

Its answer:

Certainly! As an investment analyst, let’s explore the sectors poised to benefit significantly from the application of Artificial Intelligence (AI) technology. These advancements have the potential to revolutionize various industries:

Manufacturing:

The manufacturing industry stands to gain significantly from AI due to increased data accessibility. With more data available, businesses can apply AI and machine learning techniques to:

  • Reduce task time.
  • Improve accuracy.
  • Handle administrative tasks efficiently.

As digitization accelerates, we expect wild experimentation across industries, which will eventually benefit consumers as well.

Autonomous Vehicle Navigation:

AI has already demonstrated remarkable capabilities in autonomous driving. Key areas where AI excels include:

  • Recognizing driver patterns.
  • Predicting accidents.
  • Accounting for road variables.

These advancements not only enhance safety but also hold immense potential for accident prevention and the autonomous driving verticals.

Education:

AI can transform education by enabling holistic analysis and instructional optimization. Rather than merely optimizing performance against a standard, AI can:

  • Tailor learning experiences to individual needs.
  • Intelligently adjust to each student’s pace and learning style.

Despite limited resources, AI can help achieve better educational outcomes for diverse populations.

Medical Testing and Diagnosis:

Healthcare Delivery:

Carbon Emission Reduction:

Agriculture:

Customer Service:

  • AI-powered chatbots and natural language processing enable efficient customer interactions.
  • Enhanced customer experiences, reduced response times, and cost-effective support are the outcomes of AI in this sector1.

Remember, while AI offers immense potential, prudent investment decisions require assessing each industry’s specific context, regulatory environment, and long-term viability. As an investment analyst, staying informed about AI trends and their impact is crucial for making informed recommendations to clients and stakeholders.

So, there is the answer from a ChatGPT program (including the pictures), created after searching through multiple articles and posts with links to all citations. This was done in about the same amount of time that it took to type in my prompt. It’s an example of the ability of GPT systems to enhance productivity. It’s also an example of why we do not feel threatened with AI.

First, is the information accurate? Nobody knows and it would still require a review of the citations behind the various assertions made as surely some may be based on scientific studies while others are pure speculation. We recently saw a story of a GPT-generated legal brief where the program made up cases that did not actually exist.

Second, as much as we like to give these programs human characteristics, there are no emotions and there is no real intelligence as measured by human standards. They are and always will be just high-level math.

They care nothing about us, they don’t lie awake at night worrying about things that may adversely impact our personal or financial lives.

As we saw with Google, these programs are also limited by the bias, political or otherwise, of the person writing the program. Even if we eventually reach a point of programs writing programs, the original coding was still systemically influenced by humans and constrained by code. As I explained to a high school class during a Career Day event, anyone can code a program to “cry” during the scene where Bambi’s mother is killed, but my kids cried because it made them sad.

Looking forward to Q2

In summary, we will continue to ride the trend until it changes and will manage the various strategies when it does. It is not a matter of “if,” but “when” something, good or bad, will happen that will impact the prices of the various investment assets we use for our clients. We should be prepared ahead of time with a plan to act on when the change occurs. We will continue to look for opportunities to capitalize on the innovations that will be driven by the application of AI as well as using AI to help us find them.

These are both scary times as well as exciting times to be an investor, we are so very thankful to be able to do what we do and even more thankful to have you along with us on this mission.

As always, if you have any questions, concerns, or just want to catch up beyond the information provided here, please never hesitate to contact us.

Read More

Fourth Quarter 2023 Market Review

Santa Claus finally Came to Town!

Although all three of the major indices closed down on December 29th, they ended the quarter substantially higher than where they started.

For the year, they all ended up with the Nasdaq leading the way, although there was a speed bump in the third quarter.

Even our favorite comparative benchmark, the S&P Equal Weighted Index, finally showed signs of life by finishing the quarter essentially even with its mega-cap weighted cousin.

Most of these gains were fueled by a “consensus” that the Fed will begin cutting interest rates in 2024 and that the earnings recession is over.

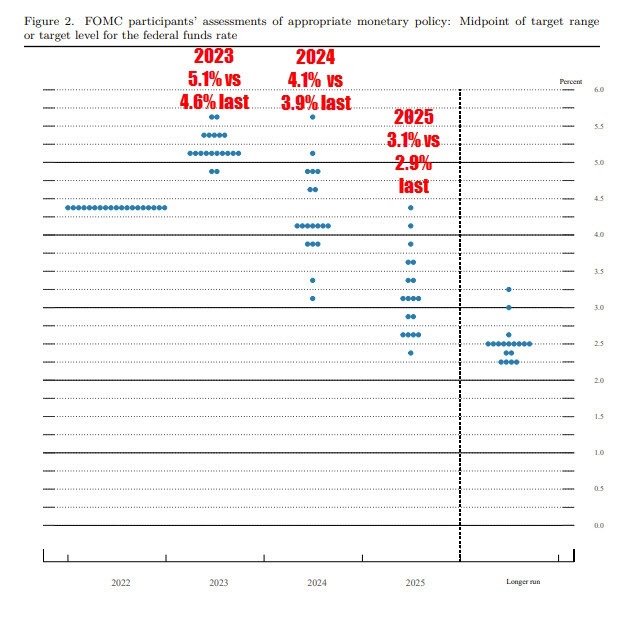
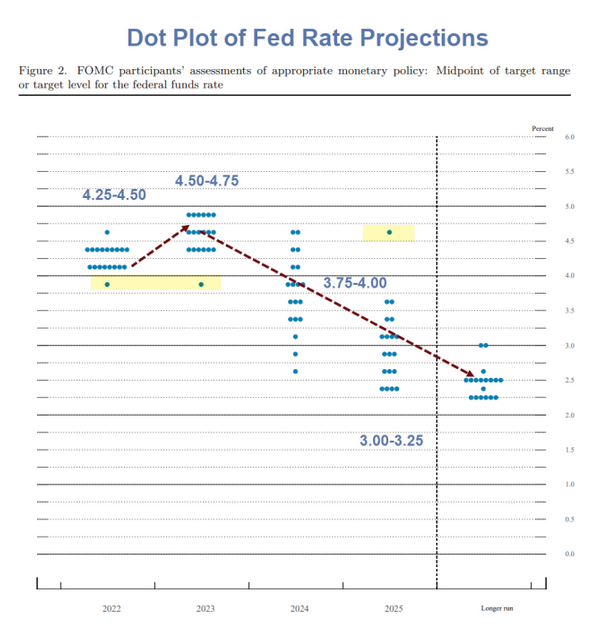
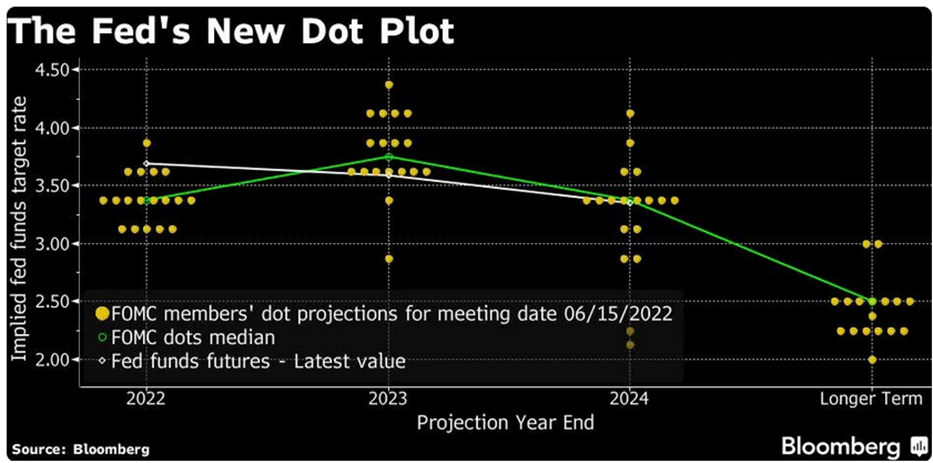
Regarding the first point, as we have written in the past, the Fed publishes the predictions of the 19 members of its Federal Open Market Committee (FOMC) four times a year. These predictions are commonly displayed via a dot plot where each dot represents a FOMC member’s prediction of the Fed Funds Rate at the end of each calendar year. Here is the plot from the December FOMC Meeting:

What this is showing is that by the end of 2024, most of the members believe interest rates will be between 4.25 and 5% which, although slightly lower than the current rate, would still align with Chairman Powell’s “higher for longer” comments.

Looking further out, most of the central bankers believe that rates will drop below 4% in 2025 and below 3% in 2026.

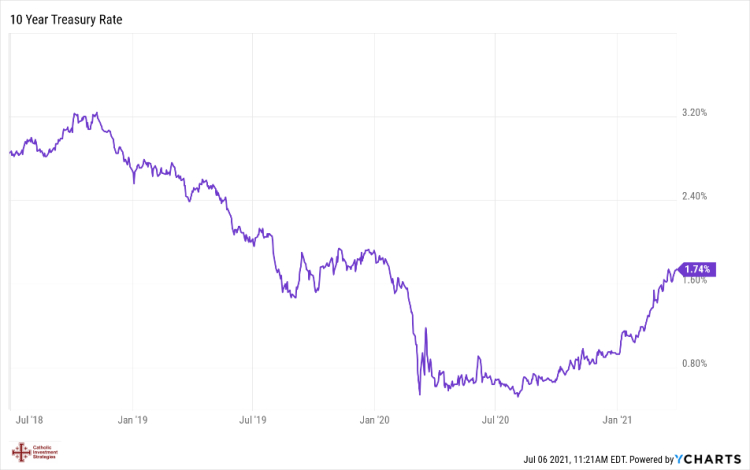
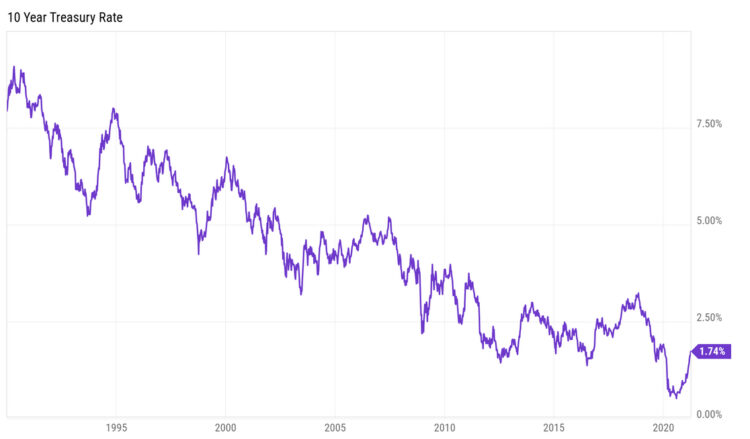
The 10 Yr. Treasury Yields have already come down below 4% in response to the Fed meeting after peaking near 5% in October.

10 Year Treasury Rate Historical Chart Source: MacroTrends.net

Since these predictions are supposed to be based on each member’s expectations for inflation and the economy, expectations of these dramatic rate cuts suggest that the FOMC members are anticipating either a substantial downturn in economic activity, a substantial drop in the rate of inflation, or a combination of the two. While we would assume that a slowing economy would mean a further drop in the rate of inflation, history shows that the two aren’t always perfectly correlated.

According to FactSet’s Earnings Insight Report:

For Q4 2023, the estimated (year-over-year) earnings growth rate for the S&P 500 is 2.4%.

If 2.4% is the actual growth rate for the quarter, it will mark the second straight quarter of year-over-year earnings growth for the index (emphasis ours).

Still, as of December 15th they report that:

For Q4 2023, 72 S&P 500 companies have issued negative EPS guidance and 39 S&P 500 companies have issued positive EPS guidance.

This tells us that all is not rosy across the economy as some sectors will experience continued growth while others continue to struggle under the current business conditions.

While many experts expect positive returns for stocks in general for 2024, most agree that the biggest threat to solid returns in 2024 is the risk of recession with some financial pundits wondering out loud why we aren’t already in one.

Where’s the Recession?

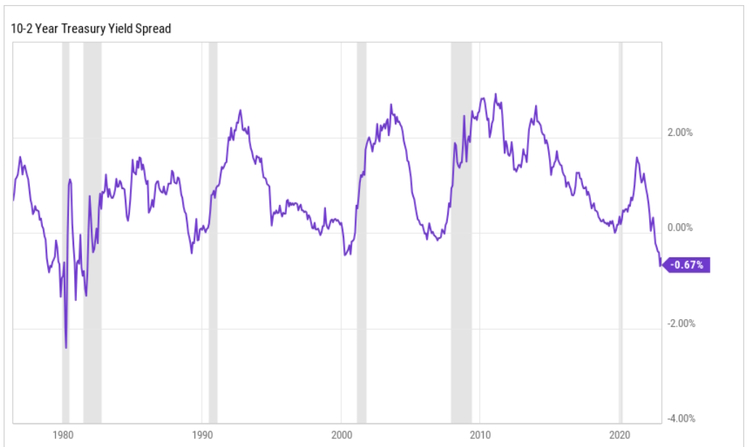
The Yield Curve has been inverted since July of 2022 and “typically” it has taken between six to twelve months after inversion for a downturn to occur. Heading into 2024, the curve is still inverted as measured by the 2Y / 10Y Yields.

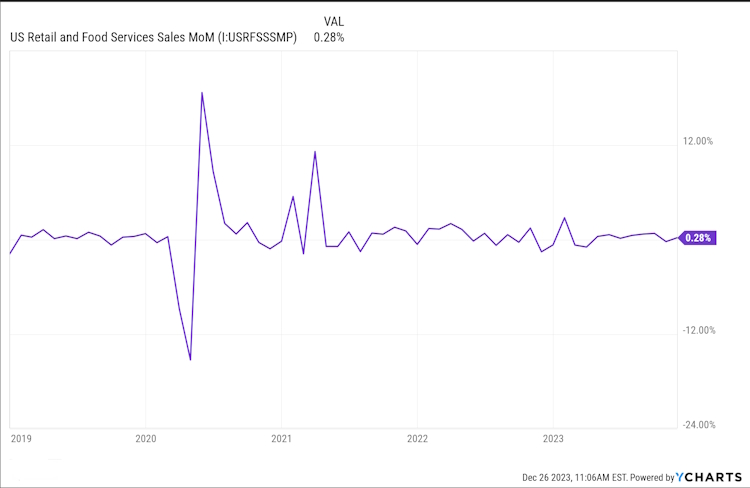
Yet there are still no signs of slowdown in the government’s favored economic metrics such as GDP, Labor Markets, and Retail Sales / Consumer Spending and Income.


Could this be the “Soft Landing” everyone has hoped for? As reported in Forbes:

Throughout the first half of 2023, Bank of America economist Michael Gapen had been calling for a recession, but recent economic data changed his mind.

“We revise our outlook for the U.S. economy in favor of a soft landing, where growth falls below trend in 2024 but remains positive throughout our forecast horizon,” Gapen said in August.

Bank of America is the second largest bank in the U.S. after Chase, so one would assume that their economists have a good idea of what’s happening in the economy.

Fed Chair Jerome Powell said during the FOMC’s post-meeting news conference in September that he’s always thought a soft landing “was a plausible outcome—that there was a path.” He told reporters: “I do think it’s possible.”

Still there are warning signs that should not be ignored.

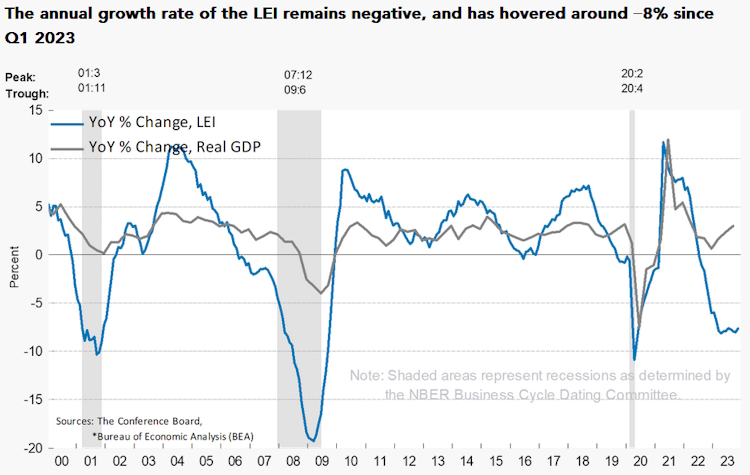
The US Leading Economic Index (LEI) continued declining in November, with stock prices making virtually the only positive contribution to the index in the month,” said Justyna Zabinska-La Monica, Senior Manager, Business Cycle Indicators, at The Conference Board. “Housing and labor market indicators weakened in November, reflecting warning areas for the economy. The Leading Credit Index™ and manufacturing new orders were essentially unchanged, pointing to a lack of economic growth momentum in the near term. Despite the economy’s ongoing resilience—as revealed by the US CEI—and December’s improvement in consumer confidence, the US LEI suggests a downshift of economic activity ahead. As a result, The Conference Board forecasts a short and shallow recession in the first half of 2024. – https://www.conference-board.org/topics/us-leading-indicators

As indicated in the name, the Leading Economic Index reading tends to lead Real GDP as reported by the Bureau of Economic Analysis (BEA).

The LEI includes metrics on housing, credit, manufacturing, work hours and unemployment claims, so they are pretty comprehensive in their analysis.

If the U.S. does slip into a recession sometime between and 2024 and 2026, there’s still no reason for investors to panic.

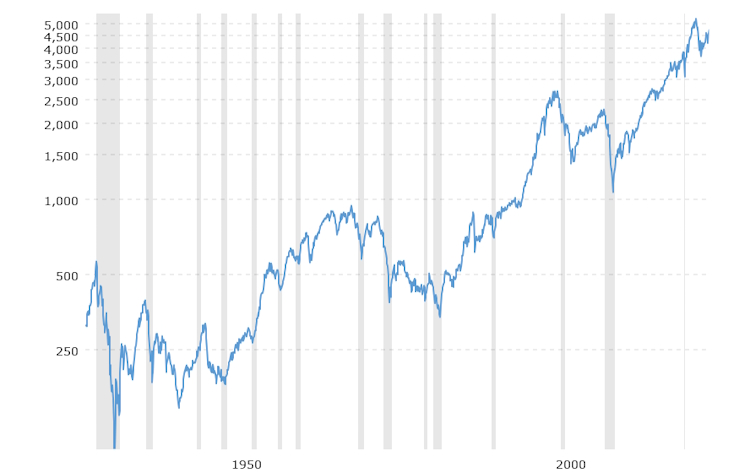
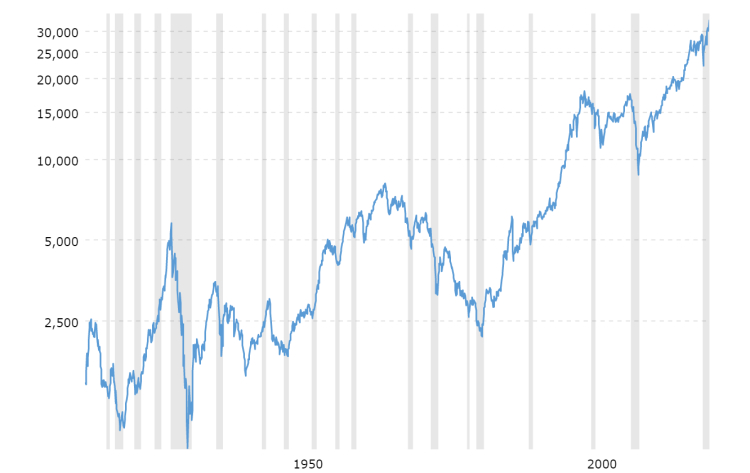
Defined as a period of negative economic growth, recessions are a natural part of the economic cycle, occurring about every five years since World War II, and lasting only 11.1 months on average. The Covid-19 recession in early 2020 lasted just two months. The shaded, vertical bars on the chart below show every official recession since World War II.

MacroTrends S&P 500 Historical Chart

This is why we always recommend holding a year’s worth of total expenses in cash in case of job loss.

For contrarian investors who “get nervous” and stockpile cash in Bull markets as well as dividend reinvestment strategies, recessions usually provide excellent buying opportunities. Some stocks even have a track record of performing relatively well during recessions. For example, Target (TGT), Walmart (WMT), and Home Depot (HD) shares significantly outperformed the S&P 500 during both the 2020 and 2008 recessions, and our database of dividend-paying stocks has a list of just under 300 companies that have a record of increasing their dividends during recessions.

Looking at the last two non-Covid rate cycles, we would expect stocks to fall in price shortly after the Fed starts cutting rates and proceed to rebound in the 12 months following the low point of a U.S. recession. This can be especially true for stocks of large, dividend growing companies as falling prices boost their short-term yields in line with many corporate bonds of equal quality.

What is more concerning to us is the federal government’s likely reaction to a recession. In the spirit of “never letting a good crisis go to waste,” recessions provide an opportunity for “stimulus” spending which will only serve to increase our national debt while providing little discernable benefit to the private sector.

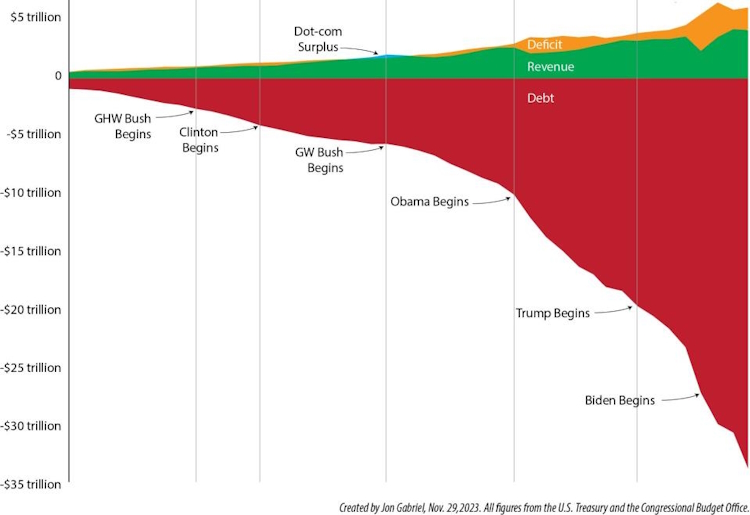
And, as Yahoo points out, it hasn’t mattered who is in office, the results have been consistent.

Our concern is that the “cure” for every crisis will create a bigger crisis than anything we have ever faced.

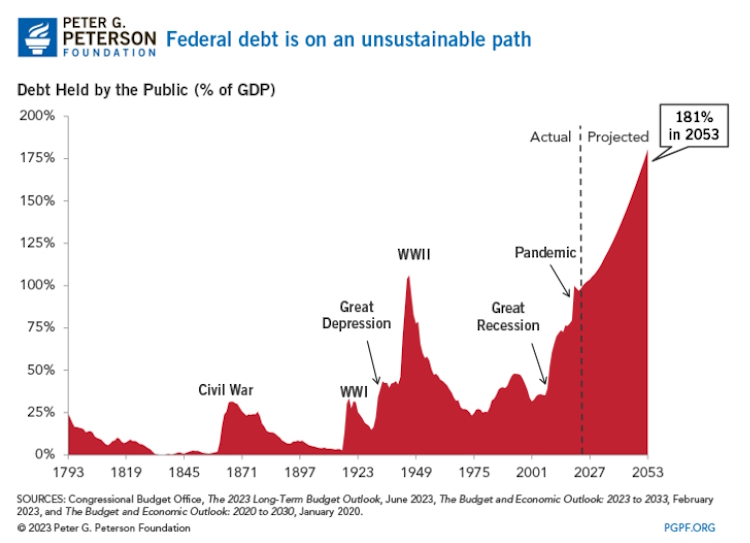
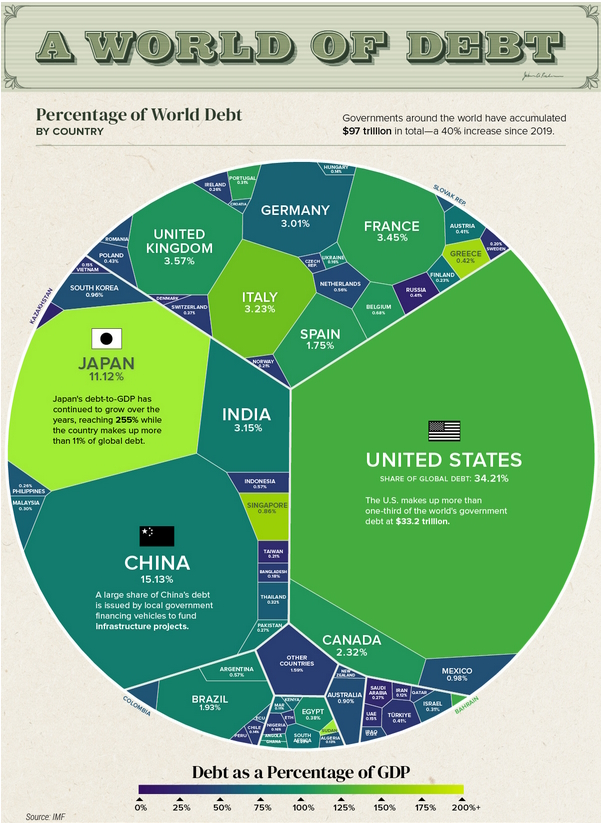
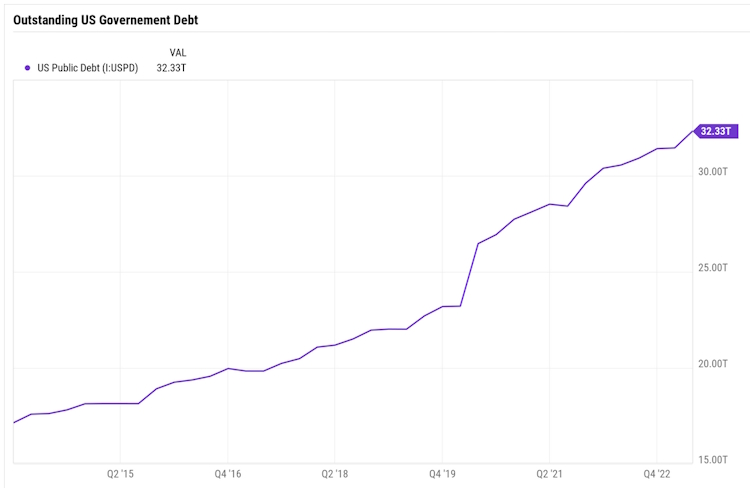
Approaching $34 Trillion, our national debt makes up 1/3 of the world’s total debt.

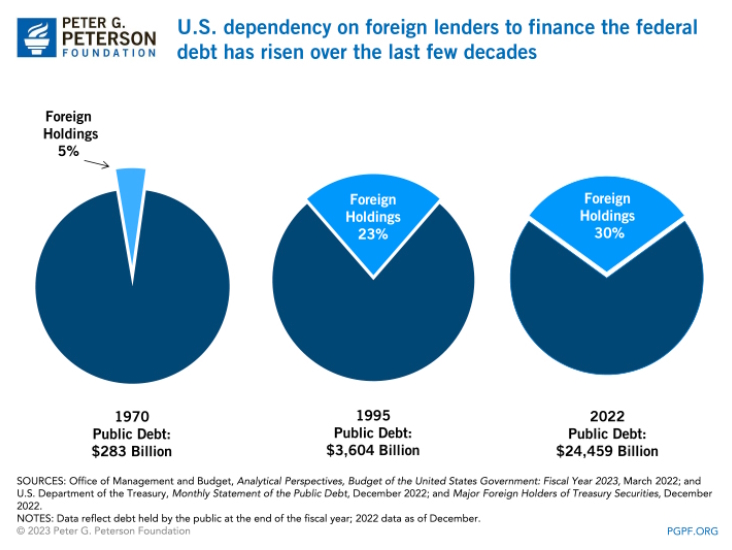
And we have grown more dependent on foreign lenders to buy our debt over time.

However, as the world is becoming more polarized, the U.S. has increasingly used international finances as a weapon against our adversaries, most recently against Russia as the Treasury Department has frozen all Russian assets that are under U.S. jurisdiction in retaliation for the invasion of Ukraine. We fear this will result in fewer foreign investors viewing U.S. Treasuries as a safe investment and there will be fewer and fewer buyers for an ever-increasing mountain of federal debt.

Even if that is not the immediate case, the U.S. produces over 25% of global GDP and there is a risk the global economy will not be able to produce enough wealth to satisfy our borrowing needs. When that happens, we have two alternatives: either get our fiscal house in order by balancing our government spending with tax revenues or print more money through the Federal Reserve to buy the debt. While we don’t like speculating, if there was one sure bet, it would probably be that the Federal Government will not cut spending. Which leaves us with option two.

The Federal Reserve Act mandates that the Federal Reserve conduct monetary policy “so as to promote effectively the goals of maximum employment, stable prices, and moderate long-term interest rates.”

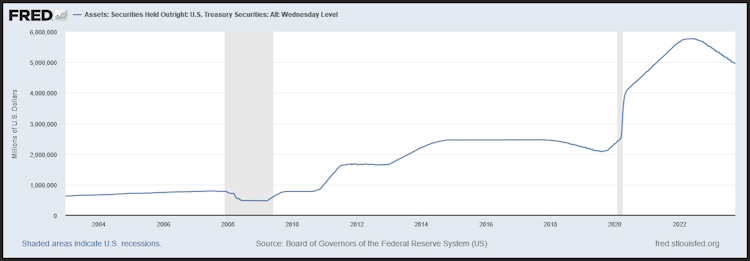
Yet, in the two most recent recessions, the 2007-2009 “Financial Crisis” and the 2020 “Pandemic Crisis” the Federal Reserve took what at the time was considered unprecedented actions of purchasing large amounts of Treasury securities and mortgage-backed securities (MBSs) issued by government-sponsored enterprises and federal agencies. They did this by creating bank reserves as liabilities, which an honest economist would refer to as “printing money.”

And, like so many other things the government does in response to a “crisis,” this is now being viewed by Washington as a cool way to keep the train running.

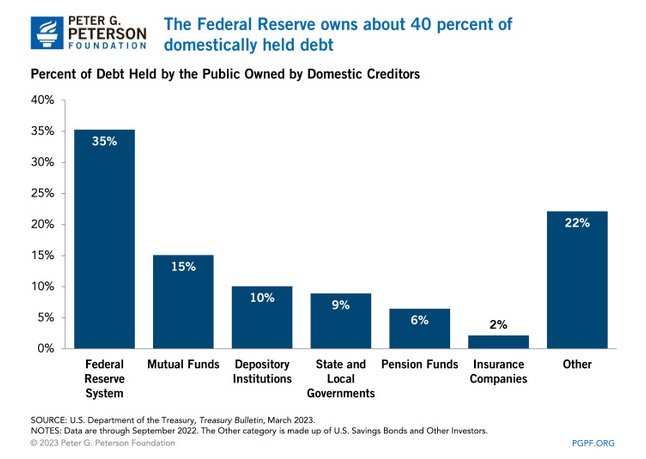
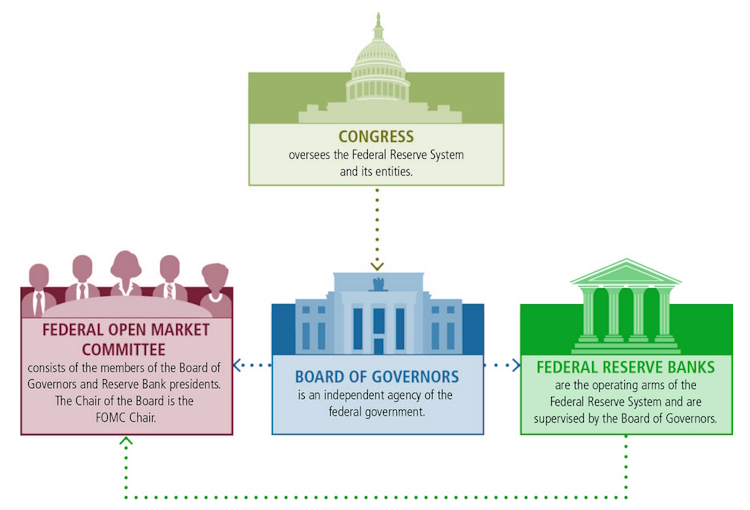
The Federal Reserve already holds a large amount of the national debt.

Unlike the other holders of US debt, the Federal Reserve’s Balance Sheet theoretically has no limits, so they have the legal ability to do this “forever.” The only limit would be a self-imposed ceiling on the amount of outstanding debt the government can issue. That limit was “temporarily suspended” until 2025, after the next election courtesy of the “Fiscal Responsibility Act of 2023.”

This is Modern Monetary Theory in all its glory, whereby we are just borrowing from ourselves.

The big flaw, besides the idea that you can “borrow your way out of debt,” is that we are not really borrowing from ourselves, but from a complex reserve banking system that we’d bet very few members of congress even understand.

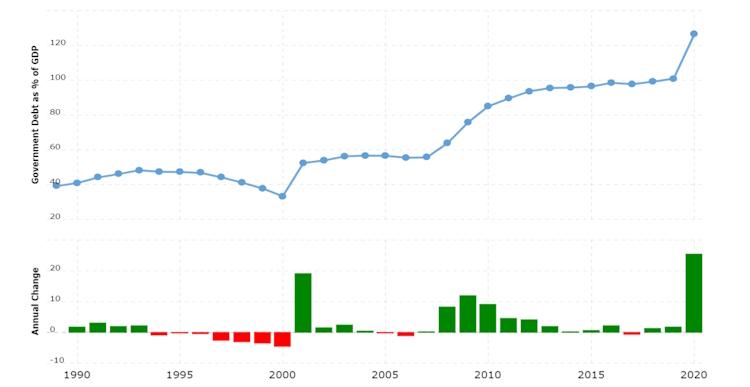
Since 2009, in what was considered a good economy, the national debt grew by nearly $27 Trillion. At its current total of $33.7 trillion, the interest alone on that debt is projected to be around $1.0 trillion. So, if there is a slowdown, or even a contraction in the economy between 2024 and 2026, we could see more “stimulus” taking us close to $40 trillion. At some point, this will start to have a long-term adverse effect on the economy. We don’t know what that will look like, but we will do our best to be ready to act as the situation dictates.

In the meantime, it is very likely that we are heading into an extended sideways market where stocks go through a series of sharp advances and declines as the markets try to regain momentum after an extended uptrend like we’ve experienced since 2008. Higher interest rates, even considering the projected rate cut, will make it difficult for many “growth companies” to survive as they will have to restructure their debt liabilities due to increased interest costs. Some of that is already visible as U.S. corporate bankruptcy filings hit their highest level since 2020.

Now is not likely the time to load up on speculative companies.

Add to that a growing list of other risks — two major wars (Ukraine and Israel), heightened geopolitical tensions, and an enormous number of national elections around the world (including the U.S.) that could dramatically change the global economy in unexpected ways—and you have a strong case for owning income producing assets. In the case of stocks, that means companies in boring sectors of the economy that are better positioned to weather economic turmoil.

This doesn’t mean just large-cap companies, but it does mean companies with strong balance sheets, pricing power, and sustainable profit margins. While there are companies outside the U.S. that meet these criteria, you still find most of them here. Almost in spite of ourselves, we still have the largest economy, the most liquid markets, and some of the world’s best businesses.

Penultimately, I will be speaking at the Oxford Club’s 26th Annual Investment University Conference, February 26-29 in Ojai, California. If you are planning to attend, please let me know so we can plan to meet up while you are there

As always, we welcome your phone calls and emails. We are always watching the markets as well as those events that can influence them and will continue to research the best ways to help you achieve your financial goals with the lowest relative levels of risk.

Read More

Third Quarter 2023 Market Review

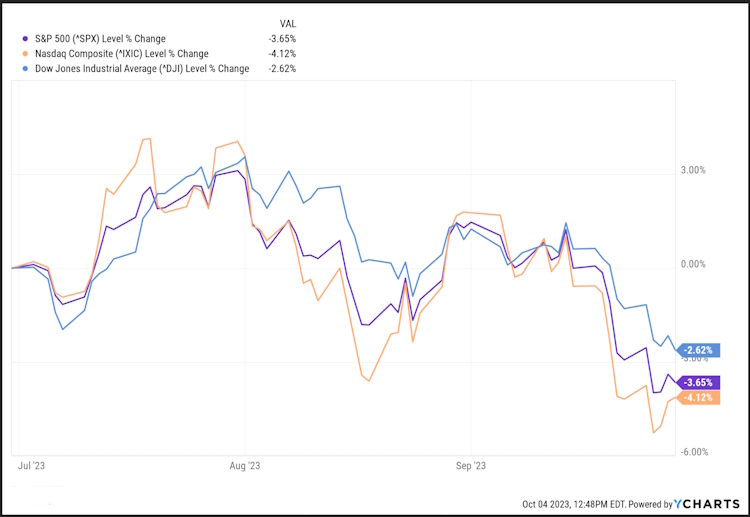
The third quarter saw the major indices give back some gains from the first half of the year with the S&P 500 falling about 3.6%, the Dow Jones dropping 2.6%, and the Nasdaq shedding 4.1%.

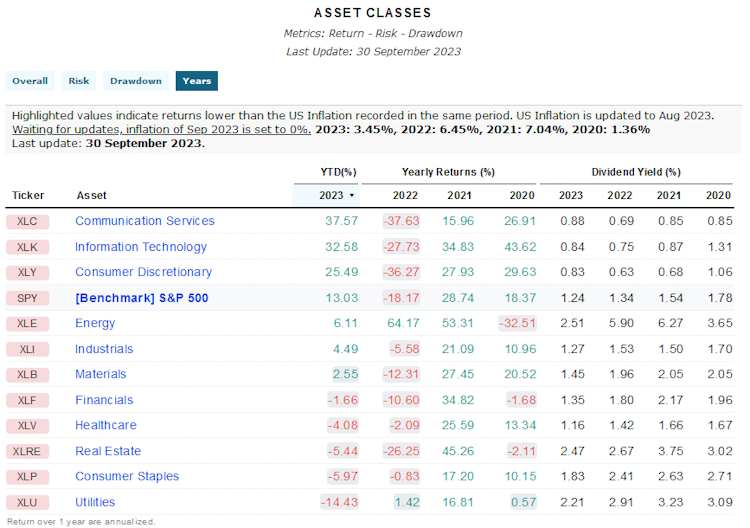
Looking at the S&P 500 sectors as represented by tradeable ETF’s, we can see how uneven the returns are so far this year, especially when compared to 2021 when we could find an up-trending stock using the Wall Street Journal and a dart.

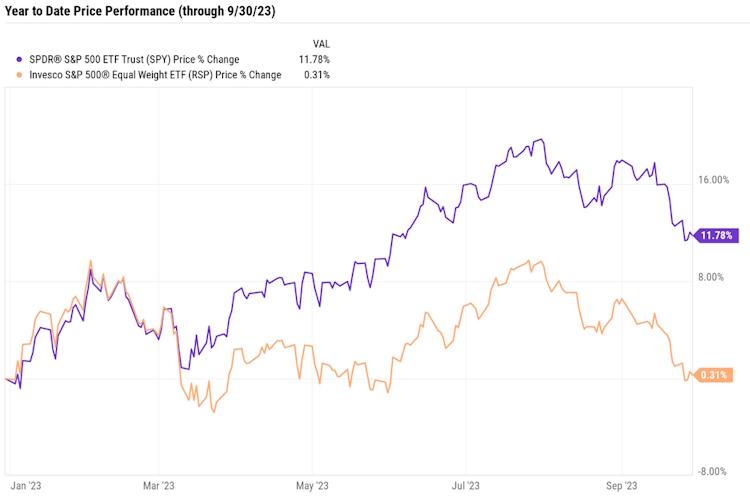
The S&P 500 Equal Weight Index – which holds an equal percentage weight (or equal dollar amount if you prefer) of each stock in the S&P 500 – briefly dipped into the red. As of the end of the quarter it was up 0.27% on the year. That means that if you had bought an equal dollar amount of each stock in the S&P 500 at the beginning of the year, you’d be about flat on a price basis. In the charts that follow, we’ve used the SPDR S&P 500 ETF and the Invesco S&P 500 Equal Weight ETF to represent the two indexes.

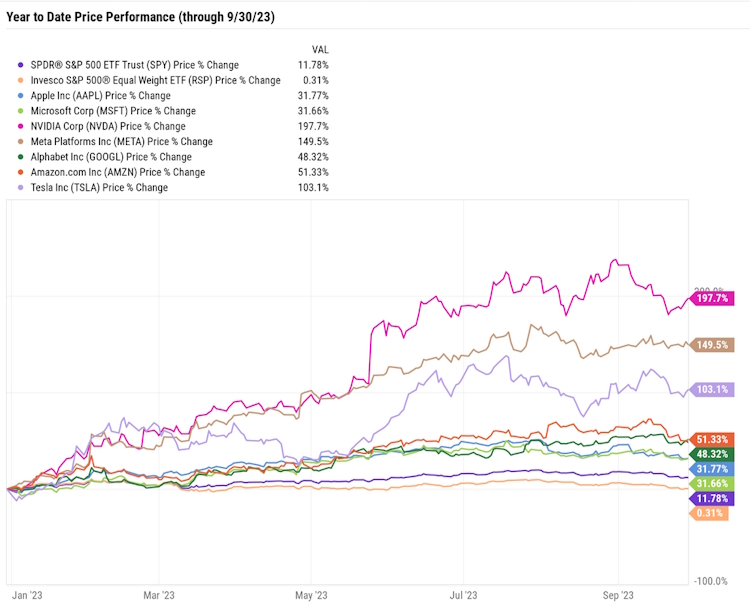
The overall market has been dominated by the “Magnificent Seven” tech companies since March – also referred to as the “S&P 7.” This includes Apple (AAPL), Microsoft (MSFT), Alphabet (GOOGL), Amazon (AMZN), Nvidia (NVDA), Meta Platforms (META), and Tesla (TSLA). All have huge market caps, and together they account for 27.3% of the S&P 500.

The artificial-intelligence (“AI”) boom led these tech-heavy companies in a massive rally through July.

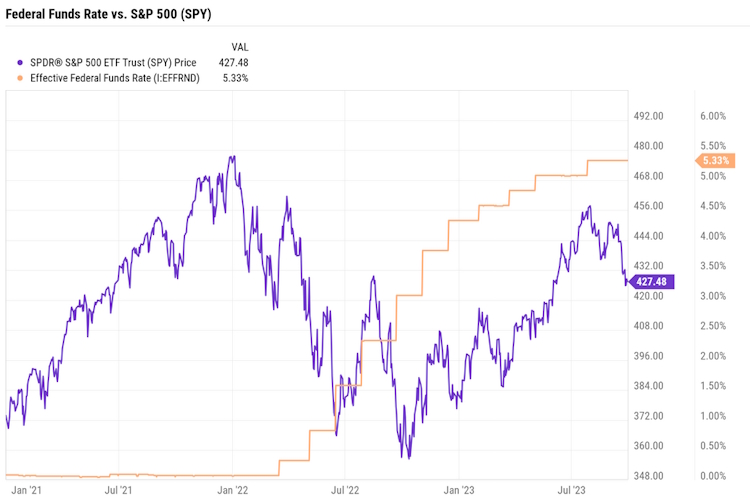
Bond yields have continued to surge as the Federal Reserve hints that rates could inch higher and that any rate cuts are not likely anytime soon.

On a fundamental basis, forty-five (roughly nine percent) companies in the S&P 500 index provided positive earnings per share guidance for the second quarter – the highest number since third quarter 2021. However, overall the S&P 500 companies reported a 4.1% decline in earnings year over year. This marks the third straight year over year decrease for the index. The top growth sector (as measured by earnings growth, not stock price) was Consumer Discretionary at 54%.

Looking at the most recent inflation data, the consumer price index (CPI) saw year-over-year gains of 3.0% in June, 3.2% in July, and 3.7% in August.

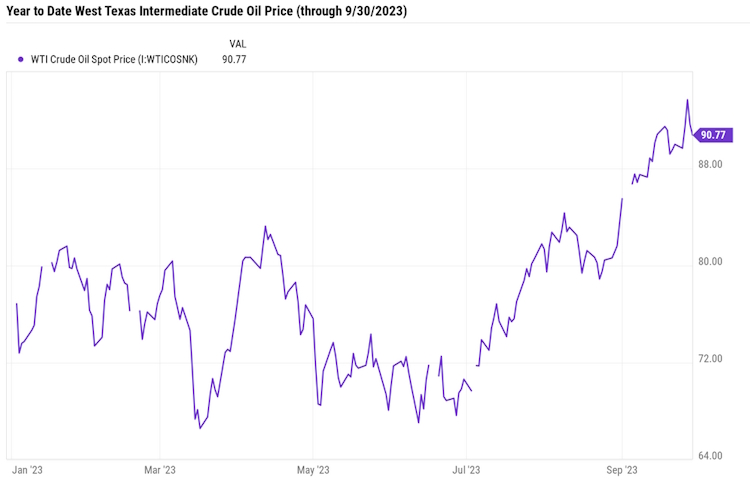
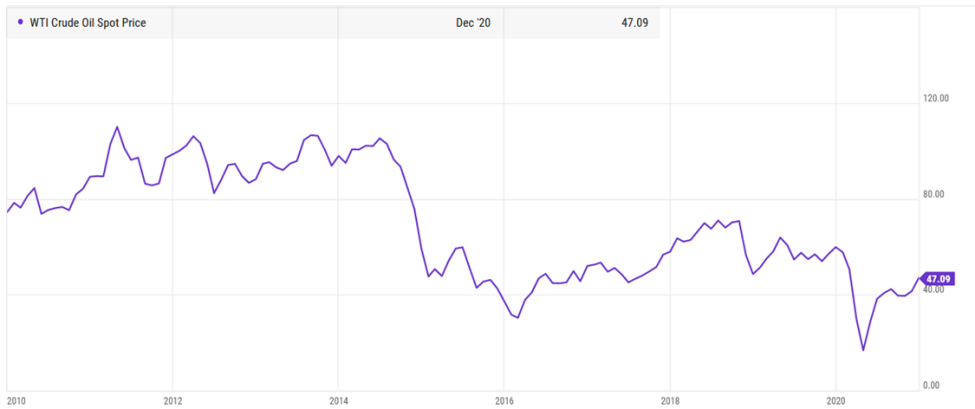
Oil, as measured by West Texas Intermediate Crude (WTI) rose above $90 per barrel in September after dipping below $70 in the first half of the year.

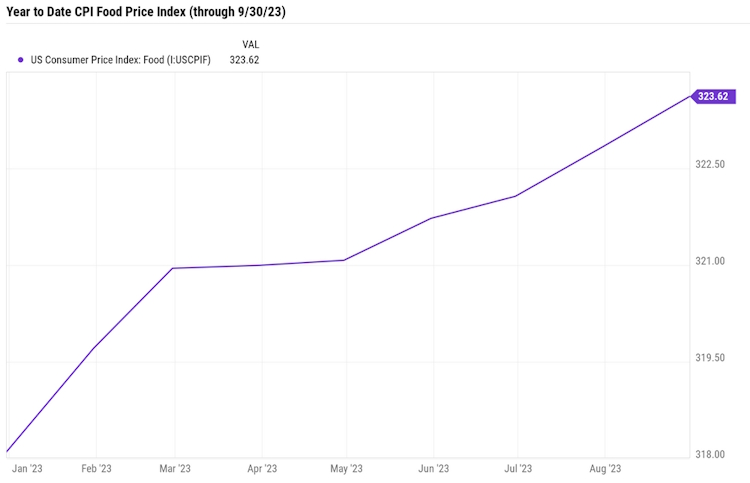
Food price increases also started accelerating in the 3rd Quarter.

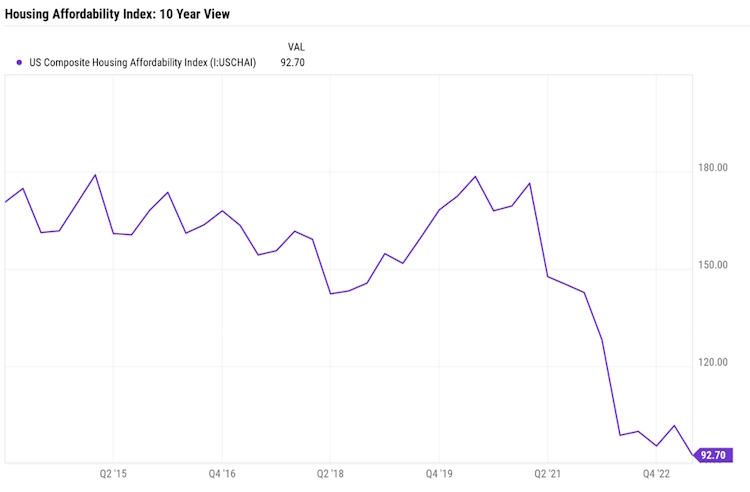
Housing Affordability as measured by the US Composite Housing Affordability Index is at the current level of 92.70, down from 101.80 last quarter and down from 98.80 one year ago. Notably, the index is also at a new ten-year low.

The index uses the value of 100 to represent the position of someone earning a population’s median income, with values above 100 indicating that housing is affordable and values below 100 indicating housing is unaffordable.

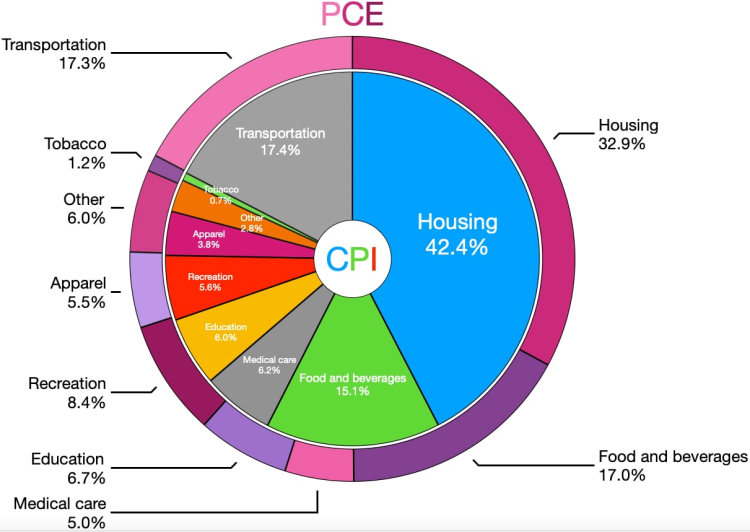
Of course, “professional economists” ignore the CPI headline data and look at CPI core (excluding food and energy) and super-core (excluding food, energy, and housing), which only makes sense if you can live without food, energy, and shelter. The truth is Americans spend most of their money on food, gasoline, home cooling/heating, and housing. Americans don’t pay for ‘super-core’ CPI. They pay headline CPI every time they go to the store or the gas station. A new analysis from Moody’s Analytics found consumers are spending $709 more on everyday goods in July compared to two years ago. One-third of all U.S. households spent more than 30% of their income on housing in 2021, according to recently released data from Harvard’s Joint Center for Housing Studies.

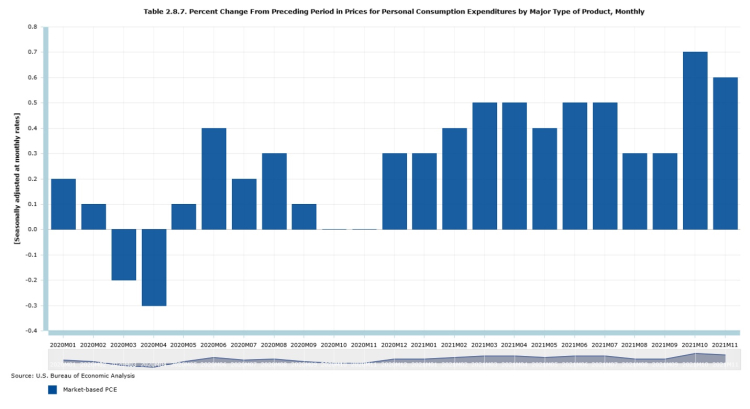
The “good news” is that the Fed’s most favored Inflation metric, the Personal Consumer Expenditures (PCE) Index, is registering inflation at 3.48% compared to 3.40% last month and 6.52% last year. The US Core PCE Price Index, which, like the Core CPI, also strips out food and energy, is up 3.88% year over year compared to

4.29% last month and 5.21% last year. It’s also the lowest since September 2021. That might be enough to reduce expectations the Fed will hike rates in November and ignite a short-term rally heading into the end of the year. So, the final quarter of 2023 could, through the Fed’s action on rates in November, be a tell-tale sign of what is to come for investors in 2024.

Inflation, Interest Rates, and the National Debt (The Song Remains the Same)

This headline says it all:

“Treasury yields near highest levels in more than a decade after hawkish Fed projections” and with that, the markets recalibrated again.

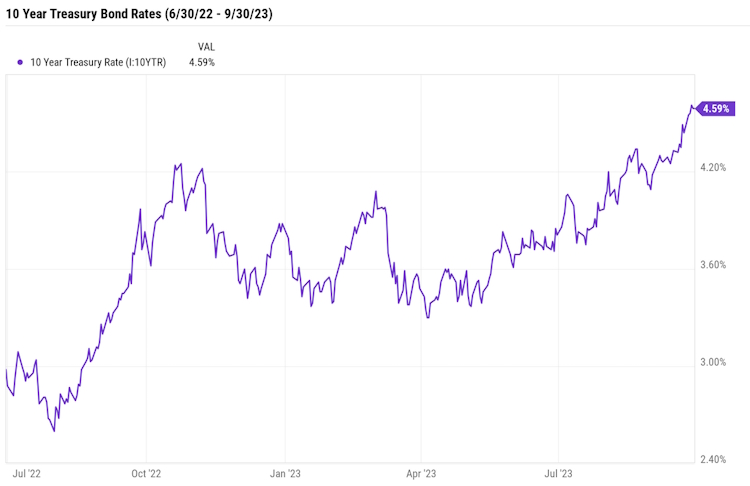
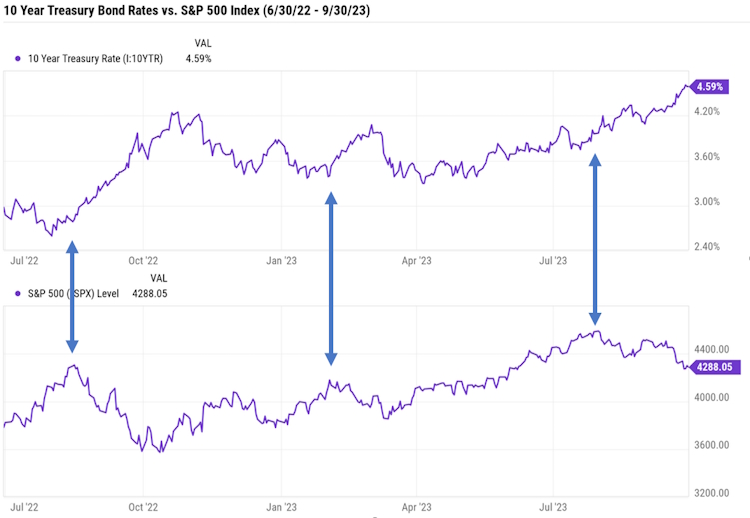
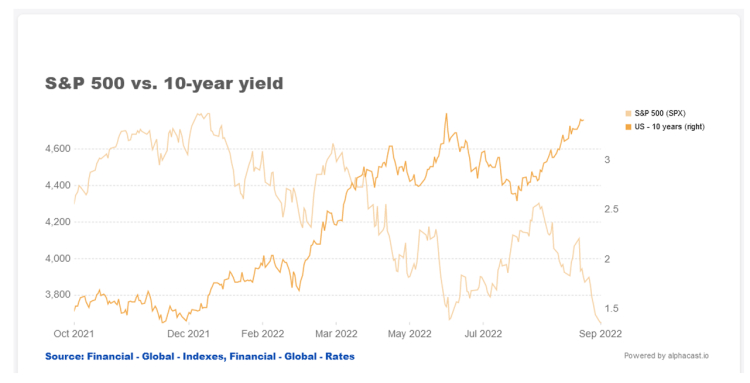
The Fed paused their rate increases for the second time this year. However, as has been the case before, it was Chairman Powell’s comments and the reaction of Treasury Bonds that set off a bond market decline. Looking at the chart below, on September 20th, the day of the announcement, the 10 Year Treasury Bond was sitting at a yield of 4.35%. Since then, the yield has climbed quickly to a 15-year high of 4.61% just before the end of the quarter and is now sitting above 4.70% and is most likely heading to 5.00% sooner rather than later.

If we compare a chart of the S&P 500 for the same period, we get a striking visual of how sensitive the stock market is to interest rates, even on a daily basis (Note that last year’s stock market downtrend “bottomed” in October of 2022).

We all have “old sayings” that we like to bring out when the time is appropriate:

“A fool and his money are soon parted.”

“Don’t go broke trying to look rich.”

“All that glitters is not gold.”

There’s a saying in economics which we think is appropriate for the current environment:

“Once the inflation genie is out of the bottle, it’s hard to put it back in.”

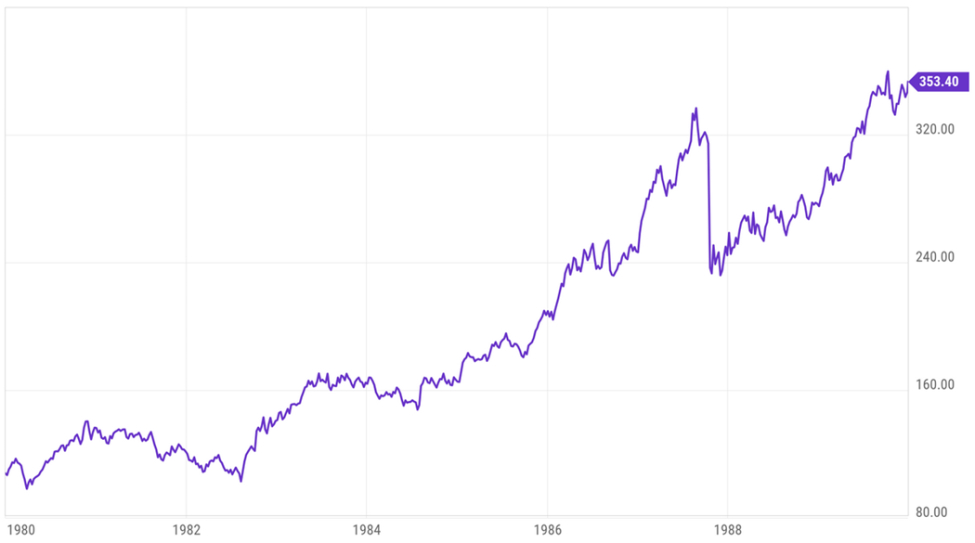
The late 1960’s and 1970’s saw the inflation genie come out in full force. It was not until the Federal Reserve board, led by Paul Volcker, raised the federal funds rate aggressively that it was finally put back in the bottle. The Fed funds rate averaged 11.2% in 1979 and peaked at 20% in June of 1981. The prime rate rose to 21.5% in 1981 as well, which helped lead to the 1980–1982 recession and a national unemployment rate of over 10%.

The government bailed out Chrysler, and there were deep cutbacks at Ford after they suffered a $1.5 billion loss. At the time that loss was the largest ever by an American corporation (until Chrysler reported a $1.7 billion loss not long after). For perspective, Ford is now predicting a $3 billion operating loss for their Electric Vehicle operation in 2023 alone after a more than a $2.1 billion operating loss recorded in 2022.

The inflation we are experiencing today began as a “transitory” supply chain issue. It soon became enduring as government energy policies discouraged investment thereby driving up energy prices which impacted the cost of nearly everything. Eventually, you would expect these cost increases to decelerate either from a lessening of demand or by the introduction of lower cost alternatives.

In the meantime, however, another shoe is dropping, wage push inflation.

According to the Bureau of Labor Statistics, compensation costs (wages, salaries, and benefits) for civilian workers increased 4.5 percent for the 12-month period ending in June 2023 and increased 5.1 percent in June 2022. Other categories likewise showed increases of 3.5 to 5.5 percent.

More recently:

In August UPS workers ratified a labor deal that would, at the time, make full-time UPS delivery drivers the highest paid in the U.S.

Airline pilots have approved labor contracts this year with pay raises ranging from 34% to 40% over four years.

The UAW is currently on strike against all three of the major unionized car makers, also asking for wage increases of 40% over the life of the contract.

And in Hollywood, the Writers Guild of America approved an agreement that raises pay and future residual earnings between 3.5% and 5%.

Few can blame these people for seeking pay increases as, just like the rest of us, they are struggling with a much-increased cost of living.

But these increases are way above the Fed’s target rate of 2% annual inflation and will soon start driving up the cost of goods and services even more. According to some studies, labor costs can account for as much as 70% of total business costs; this includes employee wages, benefits, payroll, and other related taxes.

These costs, of course, are passed on to consumers, a group that includes UPS drivers, autoworkers, pilots, and screenwriters. Hopefully, you see where this is going. We may end up with a cycle of higher prices driving higher wages driving higher prices, much like we saw in the 1970’s.

Eventually, this situation will be dealt with. On the monetary side, the Fed may raise interest rates to the point of driving the economy into a deep and extended recession. On the fiscal side, the government could reduce the constraints on energy policies, bringing down costs which would eventually flow through the rest of the supply chain. Finally, businesses will find solutions such as replacing labor with automation, enhanced by AI technology, and outsourcing means of production to lower cost companies located in or outside our country.

Based on what we have seen so far, we do not think it is likely that the Fed will drive up the funds rate much further from here, even though it would be effective in eventually driving down the rate of inflation. The Fed would surely be blamed for the pain and misery an eventual recession would cause. We do not think the political will exists to accept that. We are, therefore, inclined to believe that, instead of continuing to raise rates, they are more likely to leave rates where they are for longer than most people expect.

But even though we may see a pause in the Fed funds rate, that does not mean that we will not see interest rates continue to climb. While the Fed funds rate is a key driver for everything else, there are other rates that could continue to climb even after a Fed pause.

The prime rate is the interest rate that banks charge their corporate customers with the best credit profile. It is based on the Fed funds rate, but set by the banks, usually around 2.5% to 3% higher than the Fed funds rate. The prime rate is usually the basis for setting interest rates for mortgages, credit cards, and home equity lines of credit. Since each bank can charge its own prime rate, the published prime rate is the average rate banks charge. Both the Federal funds rate and the prime rate are market determined interest rates. In other words, they are determined through the interaction between supply and demand in their respective credit markets.

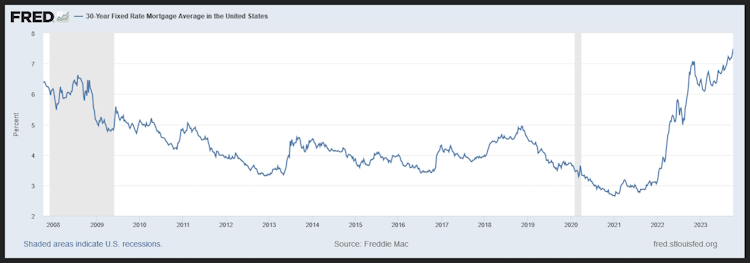
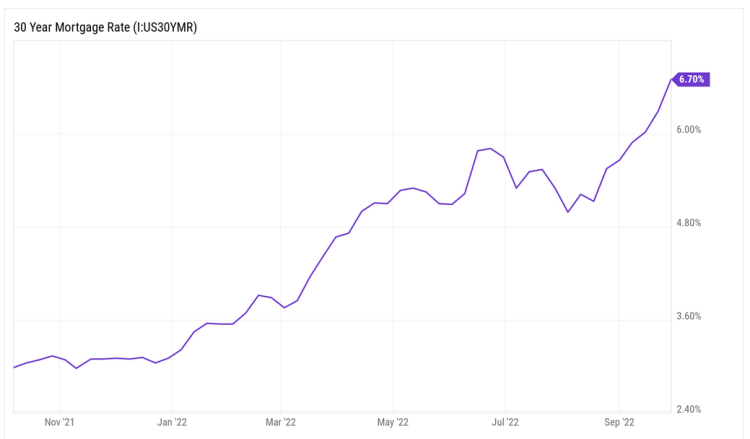
As shown below, the 30-year fixed mortgage rate is already well above levels just before and during the financial crisis even though the Fed Funds rate is not.

Mortgage rates directly impact the housing market which, as mentioned earlier, has now become unaffordable for the average person.
It’s also possible that Treasury yields could go much higher, particularly on 10-Year Treasury bonds.

It should be no secret that the US government has been running a budget deficit for decades. Those deficits must be funded by issuing debt in the form of Treasury bonds.

Up to now, the government has not had a problem selling those Treasury bonds. Most of our trade partners were more than happy to buy Treasuries with the dollars they received by exporting products to us. Over the past 20 years, Japan and China have owned more US Treasury bonds than any other foreign nations.

In fact, according to the US Treasury Department, in the year 2000, $1.7 trillion, or 18%, of total US government debt, was foreign-owned. By 2014, those figures had grown to $7.7 trillion and 34% — the highest percentage in US history. This made sense as the US possesses the only bond market capable of handling such large inflows of cash and was also considered to be the safest place to invest.

However, geopolitics is rapidly changing the situation. Because of actual economic sanctions or threats of sanctions, many countries are reducing or are no longer buying our debt. Investors from Russia, China, Saudi Arabia, and Indonesia sharply reduced their holdings of US Treasuries over the last several years due to sanctions and short-term capital needs, among other reasons. With fewer willing buyers and ever-increasing government spending, the interest rates on these bonds will likely have to increase simply by the law of supply and demand.

This also leads us to wonder what happens if there are not enough buyers, even at much higher interest rate levels. The last decade has seen increasing action by the Federal Reserve particularly in response to Covid policies over the last three years.

Has the Federal Reserve been pushed into becoming the “Lender of Last Resort” for the US government? This was never the intent, nor is it in its charter, but given the seemingly endless revolving door between Wall Street, the Fed, and the US Treasury, we believe that, regardless of original intent, the Fed is more likely to become a willing participant by funding the government debt than the government is likely to return to pre-pandemic spending levels.

In our Q1 2021 Letter, we gave a brief explanation of Modern Monetary Theory. Whether we like it or not, we may soon find that we are the guinea pigs in a grand experiment of that theory.

To summarize, higher interest rates impact the market in two different ways. Initially, they increase the cost of borrowing for businesses.

That makes it difficult to maintain operations and fund future growth. This hurts both promising companies with innovative products and services as well as questionable businesses that can only survive in a low-interest rate environment. Already, there have been over 120 major bankruptcies in the U.S. this year. And global data shows that troubled bonds and loans have increased substantially since 2021, suggesting that a significant number of companies may face challenges ahead in repaying their debts.

As interest rates rise, they compete with equities for investment dollars and can lead to a mild or even severe sell-off as larger investors keep their cash on the sidelines to collect that higher rate of interest.

While we can always hope for a return to some level of fiscal sanity, the more prudent approach is to accept that the situation will probably get worse before it is forced to get better and to position our investments accordingly. The best investments in a high-interest rate environment are companies with strong balance sheets and the pricing power to maintain their margins and cash flow. While not all such companies pay dividends, many of them do and at an increasing rate, allowing us to construct allocations that target both growth and income while still maintaining a conservative approach.

China and the BRICS+

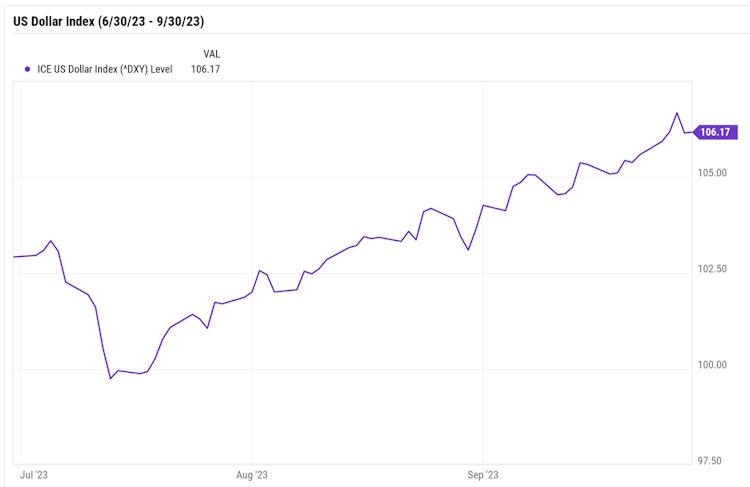
Despite all the build-up prior to the BRICS+ Summit, the meeting did not result in the crash of the US dollar, and in fact, the dollar index has risen since then.

However, the meeting was not without consequence. The group voted to expand the membership of BRICS for the first time since 2010. Saudi Arabia, the United Arab Emirates, Egypt, Argentina, Ethiopia, and Iran were all admitted to membership effective January 1, 2024.

Saudi Arabia is the key player in the so-called “petrodollar” arrangement forged by the Nixon administration nearly 50 years ago, agreeing to price their oil in dollars and getting other OPEC nations to do the same. In return, Washington agreed to protect Saudi Arabia and its allies against foreign invaders and domestic rebellions. From 1974 until last year, anyone who wanted to buy oil needed dollars and the dollar became the dominant global exchange currency for the modern world.

Could the dollar lose its reserve currency status? Most “experts” think not, but we’re in uncharted territory. The “BRICS + 6” are striving to increase their influence in areas long neglected by the West, namely Latin America and Africa along with the Persian Gulf countries. All these areas are rich in energy and resources necessary to fuel a modern economy. Should they prove successful, they will certainly exert more influence on the world stage than they’ve been able to in the past.

Of course, much of this is contingent on China being able to rise to economic dominance, which appears to be more in doubt every day.

What was once a nation driven by agriculture turned into one of the greatest economic development case studies in history. China’s economy grew from about 10% the size of the U.S. economy in 1978 to nearly 75% today. For years, it has been one of the fastest-growing economies in the world.

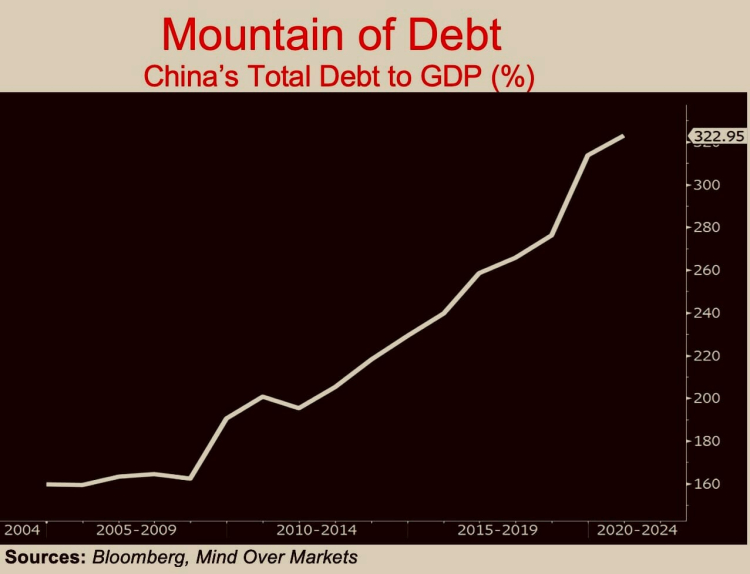
However, the same factors that helped its economy grow also led to a huge pile of debt. As of the first quarter of this year, China’s debt was more than 250% of its GDP.

The International Monetary Fund expects China to fall below 4% GDP growth in the coming years. That’s less than half of its tally for most of the past four decades.

Capital Economics believes China’s average GDP growth has already slowed to 3% and will fall to around 2% by 2030.

Carnegie Endowment for International Peace thinks China’s annual GDP growth is unlikely to exceed 2% to 3% for many years unless there’s a substantial increase in the growth rate of consumption.

The policies that propelled China into a global powerhouse yesterday are simply not working now.

A recent post at Visual Capitalist indicates how bad things are…

In July, the urban youth unemployment rate reached 21.3%, the highest ever recorded in the country, leading the National Bureau of Statistics of China to suspend future releases.

Exports fell by 14.5% in July, marking the third straight month of declines, and hitting lows not seen since February 2020.

The consumer price index moved into deflationary territory for the first time since 2021, with prices falling 3% year-over-year.

The yuan fell to a 16-year low against the U.S. dollar on August 16, 2023 in offshore trading

It’s no wonder that consumer confidence has plunged so low. At least we think so: the Chinese government stopped publishing that too.

In his zeal for achieving global supremacy, it could very well be that Xi has simply taken his eye off of the economy, assuming that it would just manage itself, or it could be that centrally planned economies simply don’t work. Regardless, it does not appear that China is positioned to lead the BRICS+ to an overthrow of the economic world order at the moment. At the risk of repeating ourselves, historically, the go-to remedy for a faltering economy is war.

We believe that countries like India and Suadi Arabia are hedging their bets, looking to benefit from a post-globalist world of dueling economic factions. Interestingly, both countries, along with Brazil, are now members of the G20 as well as the BRICS and all attended the G20 Summit held in September.

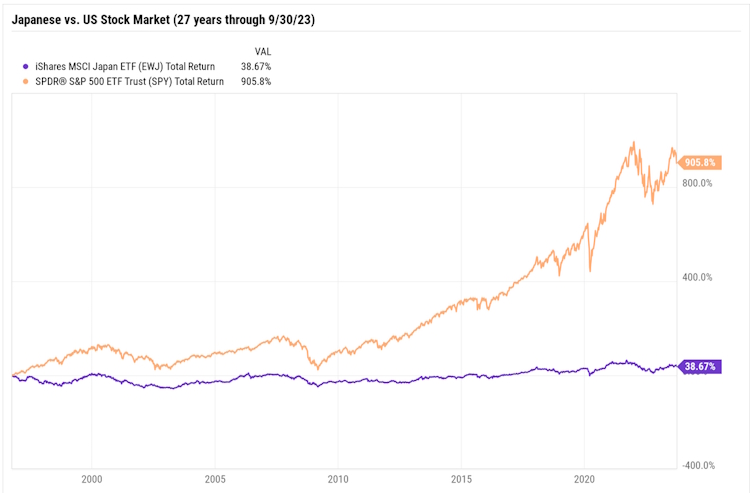
In the long run, the world economy will shift and contort, economies will rise and fall, and the leader will constantly face challengers for supremacy. In the 1980’s and 1990’s it was Japan that looked like it was going to take over the economic world, before their markets collapsed and left them dealing with decades of negative economic growth.

Now China is showing signs of the same type of potential collapse and with a much more authoritarian government, only time will tell where that will lead. In the meantime, other countries such as India will likely position themselves to fill any void left by China’s missteps.

Commercial Real Estate

As this topic is closer to home and will likely have a larger impact on domestic monetary and fiscal policies, we have spent a lot of time studying the situation.

The bad news is that commercial office buildings in the large metropolitan cities like Los Angeles, San Francisco, Chicago, and New York are operating well below capacity and as a result are losing value. We have seen estimates of as much as $250 billion in expected write-downs over the next few years.

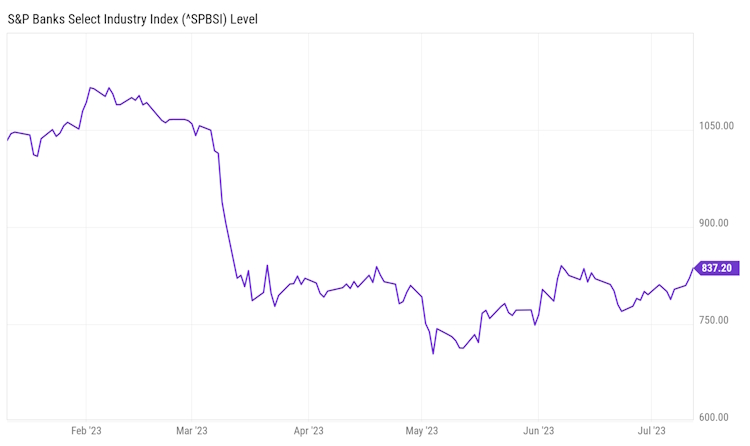
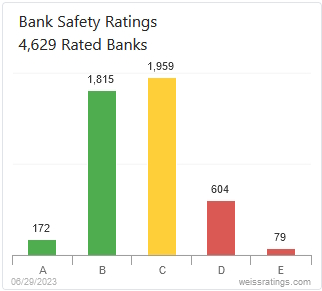
The good news is that all other areas of commercial real estate, including regional office space, industrial space, and data centers are holding up very well. So, we are not likely to see a 2008 type meltdown resulting from the glut of office space. The bad news is that the large commercial real estate holdings are not evenly distributed across the banking industry, meaning that we could see more, even several more, bank failures in the coming year. This could raise fears about a possible “contagion” effect resulting in short-term selloffs in both the financial sector and the broader market.

However, if we are correct that these selloffs will be short-term in nature, then they will be buying opportunities to purchase good businesses as described earlier. They would also benefit from dividend reinvestment strategies that are still in the accumulation phase. If we keep ourselves out of situations where we must sell holdings to pay our bills, we should be able to come out of this period, however long it may be, in a better position than we were going in.

As always, we welcome your phone calls and emails. We are always investigating different strategies as well as individual investment opportunities and won’t hesitate to incorporate them into the mix if we are confident that they will be beneficial to our clients in the long run. Our business is not to sell subscriptions based on the hyped-up investment theme of the day, but to allocate your investment dollars responsibly and in line with your individual aspirations. Hopefully, the difference between the two approaches will become clear over time.

Read More

Second Quarter 2023 Market Review

Second Quarter 2023

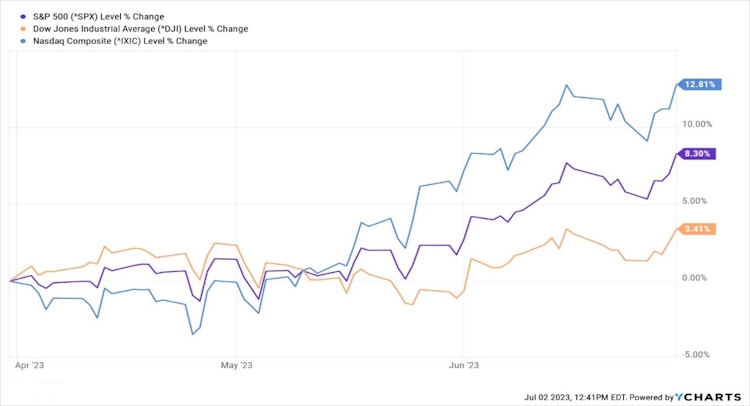
After months of sideways movement, the S&P 500 finally broke through resistance and ended the quarter up 8.3% at the 4350 level. The Nasdaq ended up 12.8% while the Dow Jones Industrials, which led the “Big Three” Indices in 2022, closed up 3.4%.

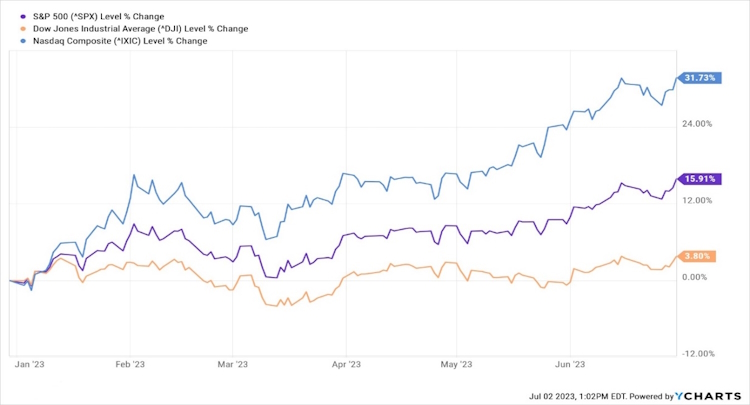
So far this year, the Nasdaq is up 31.7%, followed by the S&P with a 15.9% gain, while the Dow is up a mere 3.8%.

The disparity between the three indices provides a hint as to what has really been happening so far this year. We tend to check on what “the stock market” is doing to get a feel for our individual investments. We ourselves look at our own assets under management, the sum total of all our accounts, each week relative to the market’s performance and we would expect to see AUM rise and fall with the overall market. But, as you will see below, the performance of the major indexes doesn’t always match up with every individual sector or company.

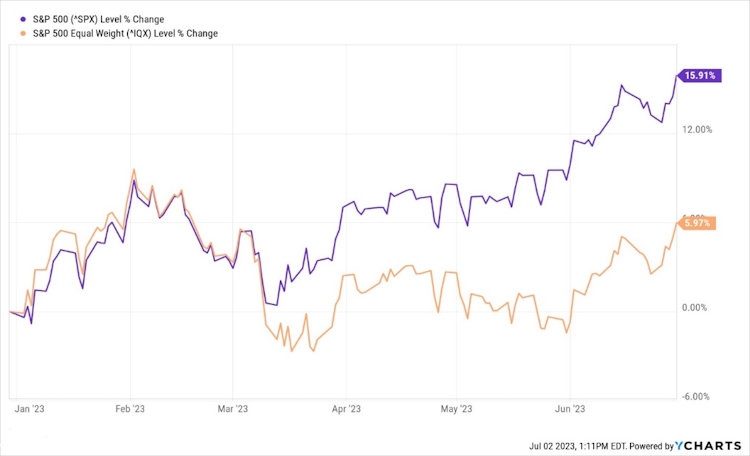
Most of the S&P and Nasdaq gains so far this year have been driven by just seven companies – Apple, Amazon (AMZN), Alphabet (GOOGL), Meta Platforms (META), Microsoft (MSFT), Nvidia (NVDA), and Tesla (TSLA). This is clearly seen when looking at the chart below showing the Cap-Weighted S&P 500 index (in which each company is weighted in accordance with its market capitalization and is the one that it always reported) versus the S&P 500 Equal Weighted Index (where, as the name suggests, each company is given an equal weight regardless of market capitalization).

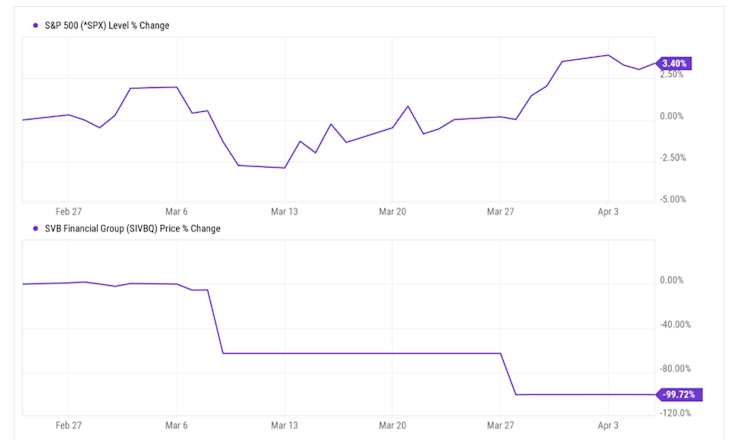
As these “Magnificent 7″ mega-cap tech stocks drove the S&P 500 from 3,00 to 4,200, after the “Silicon Valley Bank weekend” (more on that below) in March, the other 493 stocks stayed relatively flat until mid-June, providing evidence that everything doesn’t go up or down at the same time. However, we have rarely seen such a divergence in performance as we have seen this year, especially this last quarter.

So, the good news is, we didn’t miss the rally, it’s only getting started. While most accounts contain shares of the seven tech leaders, the concentrations may have been too low to match the index moves. While we incessantly preach that cash flow, not stock price, is the main driver of wealth and a secure retirement, we understand that it still feels nice to see your account values increase over time. We expect to see that play out in the second half, although not without ongoing volatility.

Looking into the next quarter, one thing to keep an eye on is the rollout of the FedNow service. FedNow is NOT a new digital currency aimed at replacing the dollar. FedNow is the Federal Reserve’s new instant payment service that will enable customers at participating banks and credit unions to send and receive money within seconds, 24/7 every day. We will be able to complete payments or transfers on weekends, holidays and after banks’ business hours, which isn’t the case for standard online transfers such as the commonly used Automated Clearing House Network (ACH).

FedNow will enable participating banks to offer instantly available funds and real-time payments to their customers. Two uses for FedNow at its launch include bill payments and account-to-account transfers. Being able to send money instantly could be helpful, especially if you’re on a tight budget and susceptible to late payment fees. You could pay right when a bill is due and receive immediate confirmation that a payment is accepted. FedNow will be available to all banks and credit unions, but there’s no current requirement for them to join.

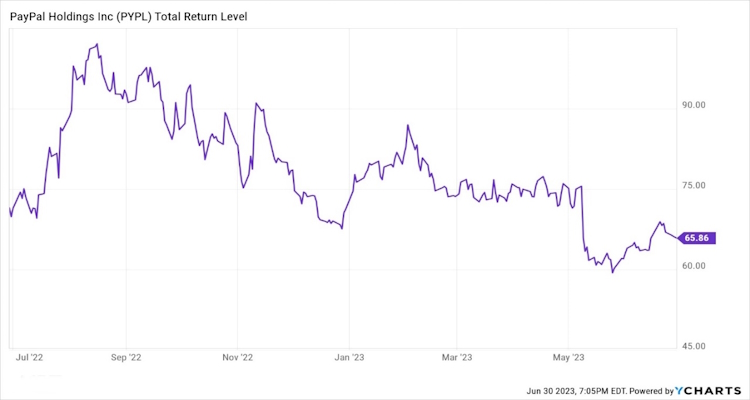
While we see this new capability as being positive, any issues during the rollout could cause short-term panic across the financial markets. It may also become a threat to consumer-facing services like Paypal and Zelle (owned by seven of the largest US banks).

The Economy

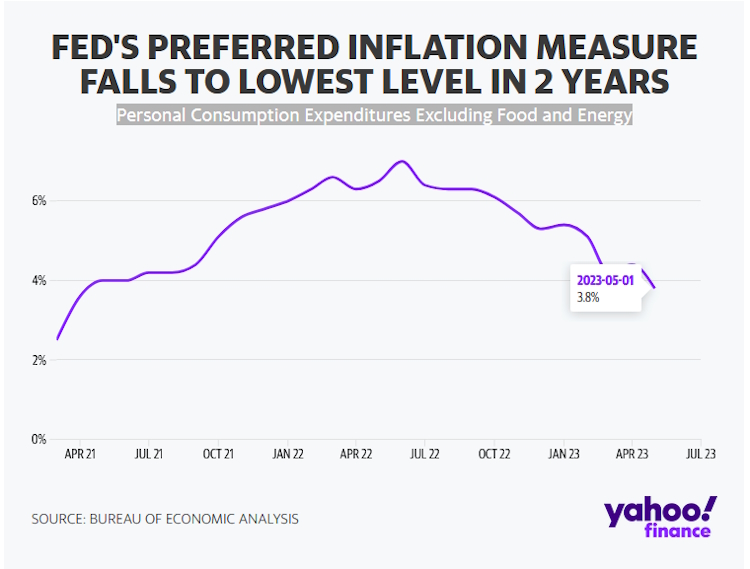
The “big” news was that the Personal Consumption Expenditures Excluding Food and Energy Index, the Fed’s preferred inflation gauge, dropped last month to its lowest level since April 2021, pulled down by lower gas prices and slower-rising food costs.

From Yahoo Finance:

last month’s progress in easing overall inflation was tempered by an elevated reading of “core” prices, a category that excludes volatile food and energy costs. The increase underscored the Fed’s belief that it will need to keep raising interest rates to conquer high inflation.

Core prices rose 4.6% in May from a year earlier, down slightly from the annual increase of 4.7% in April. It was the fifth straight month that the core figure was either 4.6% or 4.7% — a sign that the Fed’s streak of 10 rate hikes over the past 15 months hasn’t subdued all categories of prices. From April to May, core prices increased 0.3%, a pace that, if it lasts, would keep inflation well above the Fed’s 2% target.

Per the New York Fed, total household debt rose by $148 billion, or 0.9 percent, to $17.05 trillion in the first quarter of 2023, according to the latest Quarterly Report on Household Debt and Credit. Mortgage balances climbed by $121 billion and stood at $12.04 trillion at the end of March. Auto loan and student loan balances also increased to $1.56 trillion and $1.60 trillion, respectively, but credit card balances were flat at $986 billion. This could partially explain why personal spending only increased by 0.1 percent in May 2023, compared to a 0.6 percent gain in April (income tax refunds?). Perhaps spending limits are getting maxed out.

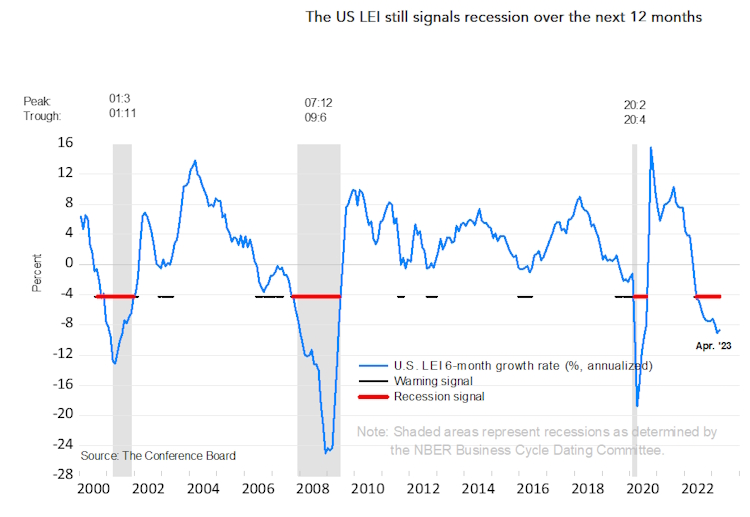
The Conference Board Leading Economic Index® (LEI) for the U.S. declined by 0.7 percent in May 2023 to 106.7 (2016=100), following a decline of 0.6 percent in April. The LEI is down 4.3 percent over the six-month period between November 2022 and May 2023—a steeper rate of decline than its 3.8 percent contraction over the previous six months from May to November 2022. They also revised their Q2 GDP forecast from negative to slight growth, and project that the US economy will contract over the Q3 2023 to Q1 2024 period.

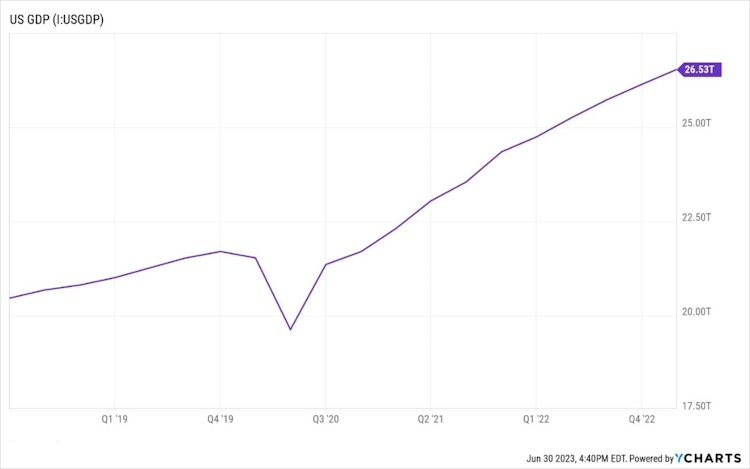
This may come as a surprise to those who track GDP as the government’s third estimate was revised up notably to a 2% annualized advance in the first quarter.

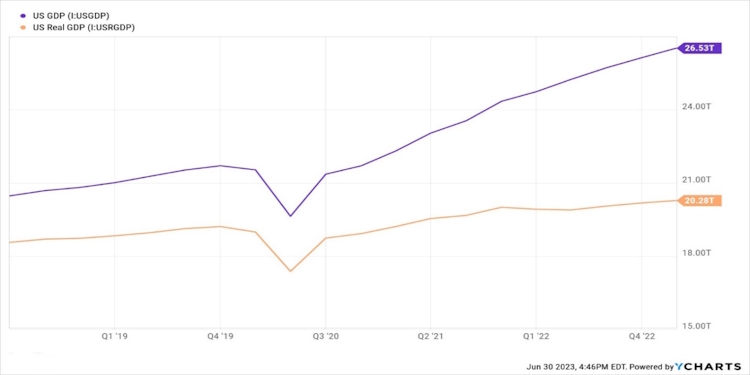
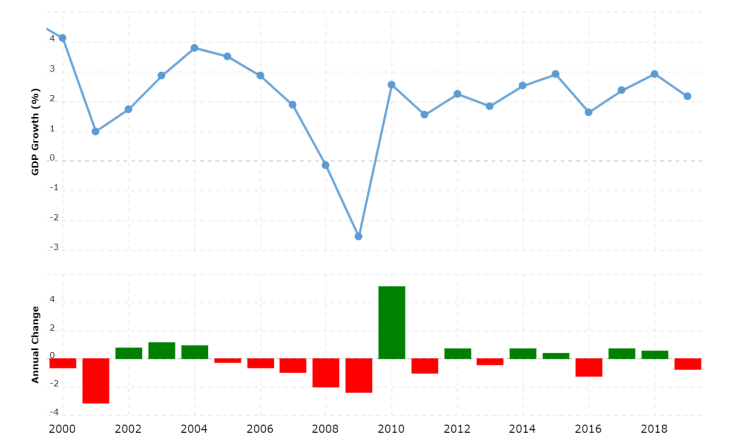
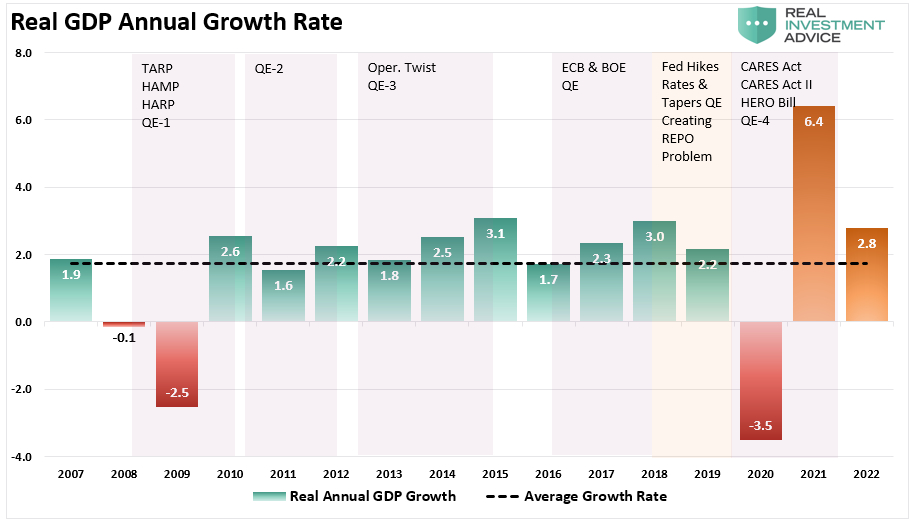
However, there are two factors to consider. The first is that GDP measures the monetary value of final goods and services—that is, those that are bought by the final user—in a given period of time. But because GDP is collected at current, or nominal, prices, one cannot compare two periods without making adjustments for inflation. To discount the impact of inflation, we need to look at Real GDP, doing so gives us a different story.

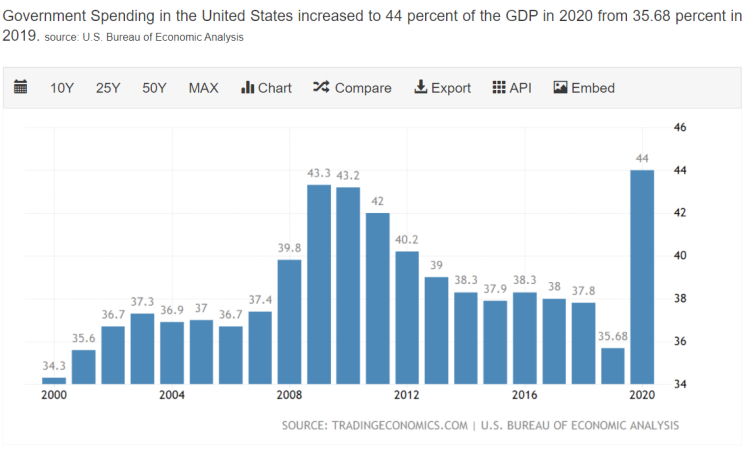
As you can see, when we account for inflation, true economic growth is trending at a far lower rate than the headline numbers would have us believe. Second, since the end of World War II, the U.S. government’s share of expenditures as a percentage of GDP has steadily increased, and as the government’s contribution increases, it becomes harder to use GDP as a measure for the real economy because in good times and especially in bad, the government doesn’t stop spending money. Between the American Rescue Plan Act ($1.9 Trillion), the Inflation Reduction Act ($700 Billion), and the Omnibus spending bill ($1.65 Trillion), there’s plenty of government cash to paper over a slowdown in personal spending.

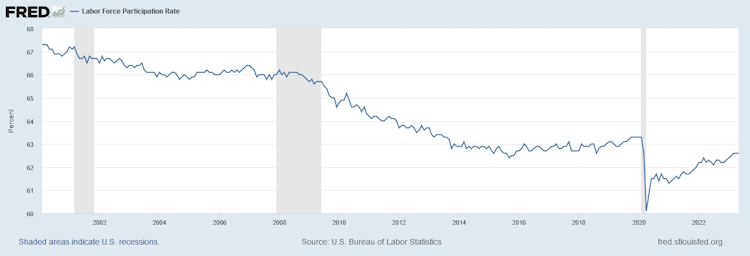
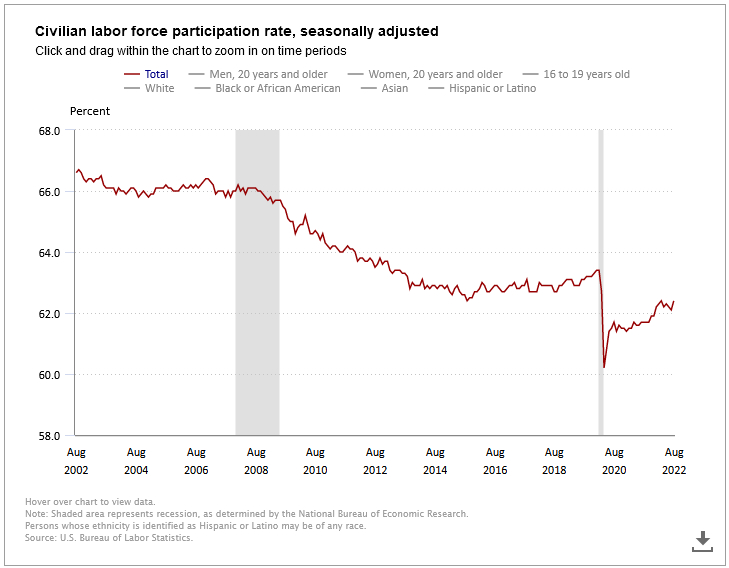
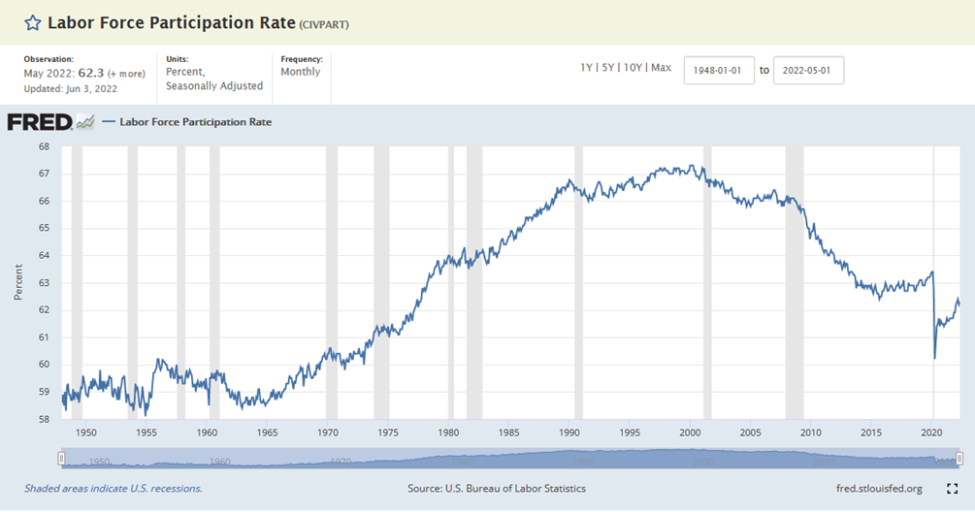
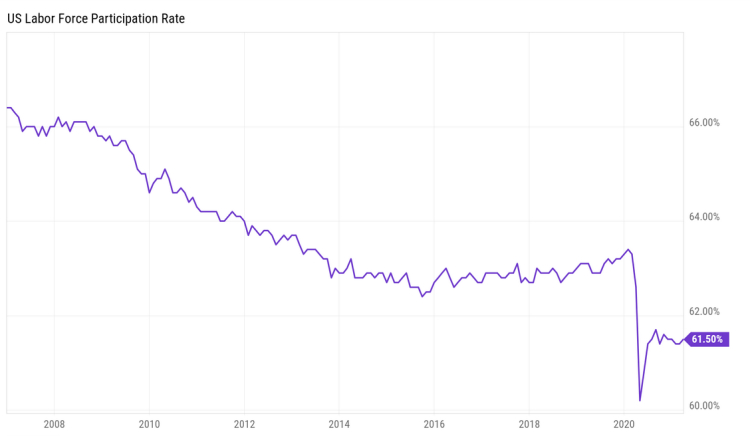
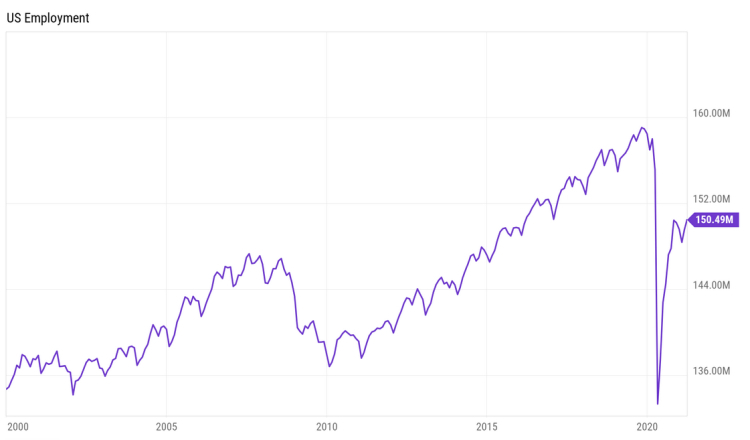
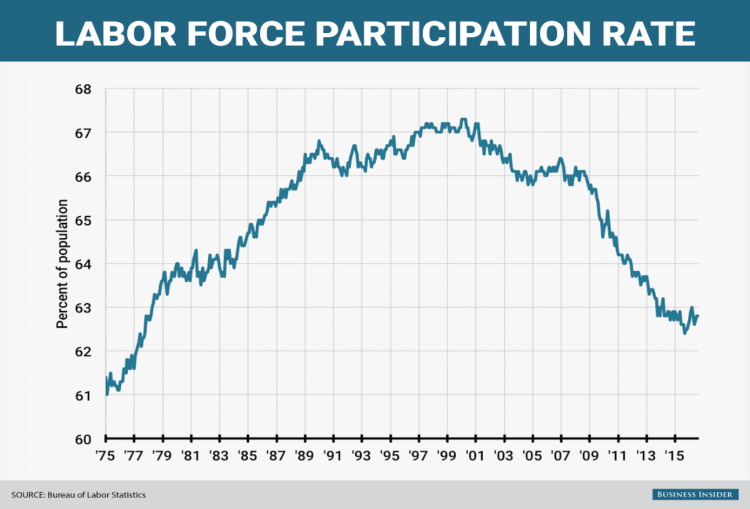
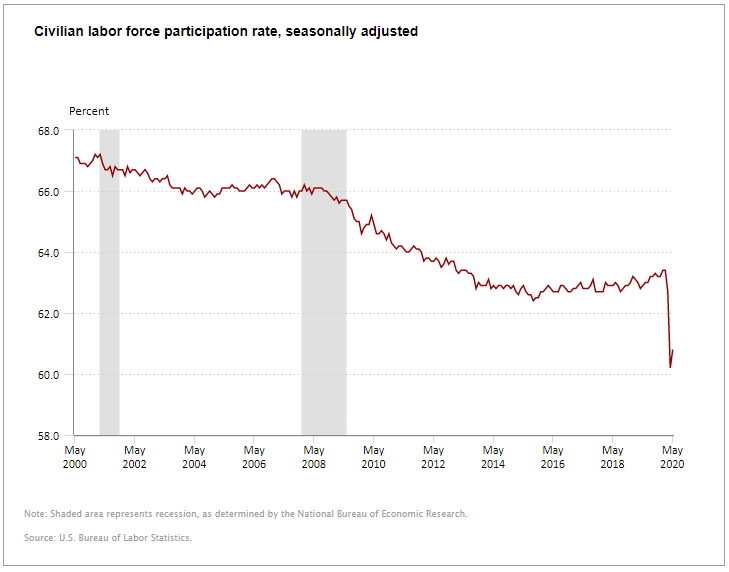
Labor Force Participation continues to remain below pre-Covid levels and substantially below its peak in early 2000.

This drop in the workforce remains a mystery to us as, especially with rising prices, we would expect more people needing to work in order to make ends meet. The US Chamber of Commerce put out a study in June where they took a deeper look into the data behind the labor force gap. They found not one, but several factors contributing to the low participation rate.

Twenty-seven percent of non-working adults indicated that the need to be home and care for children or other family members has made the return to work difficult or impossible. More than a quarter (28%) indicated that they have been ill, and their health has taken priority overlooking for work. Along those same lines, the study also revealed some are still concerned about COVID-19 at work while others said that the pay for what they were being asked to do was too low, while others were more focused on acquiring new skills and education before re-entering the job market.

Additionally, women are participating in the labor force at the lowest rate since the 1970s. In the spring of 2020, 3.5 million mothers left their job, driving the labor force participation rate for working moms from around 70% to 55%. 23% of women cited others in the family making enough money that working full-time is not as critical as the reason they have not re-entered the workforce. However, high inflation is driving down savings accounts, necessitating the need for many to return to the workforce.

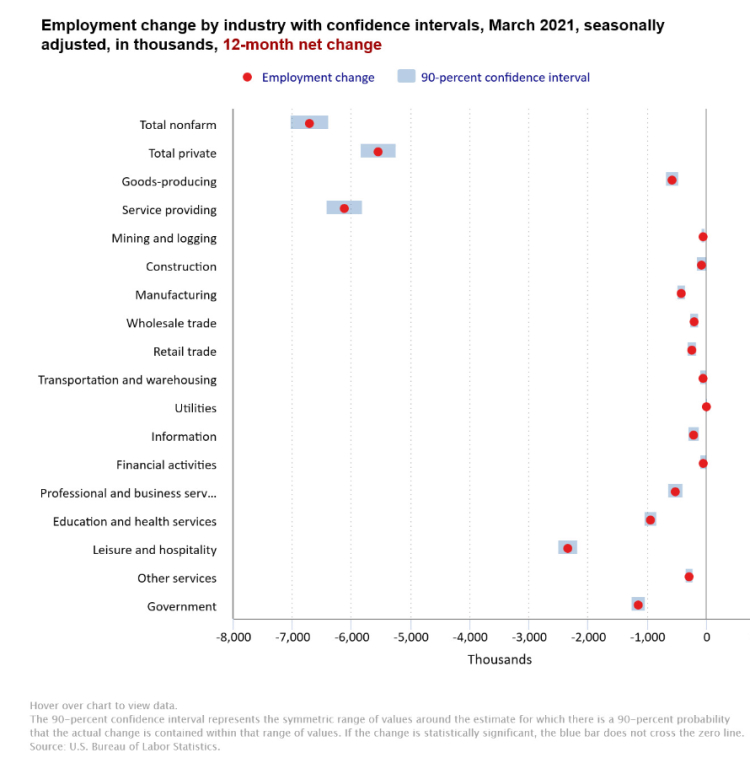
Another stumbling block is that workers need reliable childcare. The government reaction to Covid forced many childcare providers to close or scale down: between February and April 2020, the industry lost 370,600 jobs — 95% of which were held by women. So, employers are caught in a chicken and egg cycle that makes recovery slow and financially difficult.

Finally, there is the issue of teen employment, once a staple of our working-class culture. According to a study by the Hamilton Project and Brookings Institution, the share of teens participating in the labor force peaked 40 years ago and has declined ever since. In 1979, nearly 60% of American teenagers were employed, an all-time high. Today, just over one-third, or 35%, of teens between the ages of 16 and 19 are part of the workforce.

The current Labor Force Participation Rate is essentially back to where it was in the late 1970’s, the beginning of the dual-income family model. Whether this is a sign of a shift back to the one-income family, or something else, is yet to be seen. In the meantime, businesses will have to deal with ongoing labor shortages either through the creation of more efficient processes, greater investment in automation wherever it is cost effective to do so, or continued out-sourcing to emerging economies with cheap and plentiful labor. Companies that navigate this proficiently will create greater competitive advantages in the marketplace.

While we look at Labor Force Participation, the Federal Reserve prefers to look at the Unemployment Rate, which seems to have leveled off to pre-Covid percentages and gives the illusion of a tight labor market.

Using this metric allows the fed to justify additional rate hikes. In their latest economic forecast, which is released each quarter, central bank officials project interest rates will peak at 5.6% by year-end, 50 basis points higher than the previous projection and suggesting two more 25-basis-point rate hikes after this short pause.

Rate hikes, of course, increase borrowing costs for businesses trying to scale up capacity. These headwinds will have a negative impact on growth and will favor the larger, established companies in those industries that are more capital intensive such as manufacturing and energy. It will also negatively impact poorly capitalized start-ups, many of them in the technology sector. This is not necessarily a bad situation. In recent years, many companies not worthy of investment were brought public via IPO’s as venture capitalists took advantage of near-zero interest rates to keep those companies going long enough to cash out with big gains.

In the age of 24-hour news, email, and social media, it is a lot easier to sell a bad business with a good story to an impatient public hoping to buy the next Apple, Google, Tesla, or Facebook before the price goes vertical.

Mania is the enemy of the individual investor who thinks 100% gains are commonplace. In truth, a good idea is one thing, implementation is another, and profiting still another. Sometimes the ideas with the most sex appeal make the worst investments.

Whether the promised additional rate hikes are enough to pull us into a technical recession or not is of little consequence in the long term, especially when we are focusing on using investments as vehicles to deliver cash flow. In the short term, stock prices will drop during a recession, but recessions don’t last forever and the prices of well-run companies (and lately, some poorly run, but well-connected companies) have always recovered and eventually surpassed their previous levels.

In between, the market gives opportunities to load up on great companies either through dividend reinvestment or fresh capital.
What does concern us are those potential seismic events that could potentially produce long-term harm. Here’s what’s at the top of our list.

The Banking Crisis

To be honest, we were expecting the market to at least test the December or October lows following the collapse of Silicon Valley Bank (SVB) in March. This was based on comments made by Treasury Secretary Yellen on Sunday, March 13, that while the collapse of Silicon Valley Bank, “is clearly a concern”, a federal bailout was not on the table.

Then, before the financial press even had time to dissect and report on Yellen’s morning commentary, US regulators rolled out emergency measures Sunday evening to stem potential contagion from the collapse of Silicon Valley Bank. The measures included ensuring that depositors with the failed bank would have access to all their money, not just the $250K guaranteed by the FDIC, on Monday morning.

The announcement came as a second bank, Signature Bank, was closed on Sunday by regulators. Depositors in Signature were also made whole.

More significantly, the announced actions included a measure allowing banks to borrow essentially unlimited amounts from the Federal Reserve for the next year, as long as the loans are matched by safe government securities. The idea is that banks can meet withdrawal demands without having to sell government bonds that have fallen in value over the last year as interest rates have risen. In turn, it is hoped the increased bank liquidity will short-circuit the type of bank runs that doomed Silicon Valley and Signature banks.

Below is a chart of the S&P 500 versus SVB Financial Group, the listed security for Silicon Valley Bank. Note how the market reverses direction almost immediately after the government’s actions.

Without this government action, the entire bank sector was at risk of a meltdown. After the failures of Silicon Valley and Signature banks, the market was tested by the collapse of First Republic Bank on May 1st. The swift resolution of that event provided confidence that any further bank problems could be contained and the turmoil in the banking sector had abated. The bank index bottomed out within days and has begun recovering, albeit modestly.

Nonetheless, according to Weiss Ratings, there are currently 683 banks with a rating score of D or E which means that “these institutions currently demonstrate significant weaknesses which could negatively impact depositors or creditors. In an unfavorable economic environment, these weaknesses could be magnified.”

Additionally, the Federal Deposit Insurance Corporation maintains a Problem Bank List based on measures of a bank’s capital adequacy, asset quality, management, earnings, liquidity, and sensitivity on a scale of 1 to 5, with 5 being the worst. The latest available data on the number of FDIC-insured institutions on the “Problem Bank” list which is comprised of banks with an overall rating of 4 or 5 is for the year-end 2022. According to the FDIC’s reports, the number of problem banks at that point was 39. Assuming that Silicon Valley, Signature, and First Republic were on that list implies that 36 banks are likely considered troubled. If more bank failures materialize the sector would likely see further price weakness.

Commercial Real Estate

One of the issues that could put pressure on banks is the commercial real estate market.

Commercial real estate vacancy rates in the US are at an all-time high, with 12.9% of office space being vacant in the first quarter of 2023, according to CoStar Group. Much of the vacancies are in major US cities.

Office vacancy rates across the country stand at a record 19.1%, with Chicago, Houston, and San Francisco running above 20%, according to Jones Lang LaSalle (JLL). Seattle’s vacancy rate rose 3.8% over the past 12 months to 19.53%, with a sublease vacancy rate of 4.3%, the third highest among major markets (source is again JLL).

New York City’s office vacancy rate hit a record 16.1% in the first quarter of 2023, representing more than 76 million square feet with Manhattan’s skyscrapers hovering around the 50% occupancy mark. The industrial vacancy rate for the Outer Boroughs recorded an uptick of 20 bps from the previous quarter to 4.2%. 2 Remote work is killing Manhattan’s commercial real estate market, with a study estimating that lower tenant demand due to remote work may cut 28%, or $456 billion, off the value of offices across the US, and about 10% of that would be in New York City alone.1

Shopping center giant Westfield confirmed that the company and partner Brookfield Properties earlier this month stopped making payments on a $558 million loan securing the San Francisco Centre property, less than a week after Park Hotels & Resorts announced it had handed two prominent hotels back to the bank. The real estate investment trust said it was abandoning the Hilton San Francisco Union Square and Parc 55, saying the city’s streets are unsafe and expressing doubts about the area’s ability to recover. Some analysts have forecast a dim future for city centers, likening the crisis to the slow death of many American shopping malls.

More than two-thirds of all commercial real estate loans are held by small- and medium-size banks, prompting concern that regional banks might be unable to withstand a wave of defaults if landlords cannot pay off loans.

Global Conflicts

The Russia / Ukraine war has now extended beyond 500 days, in a report updated in May from the Kiel Institute for the World Economy, since the war began, the U.S. has directed more than $75 billion in assistance to Ukraine, which includes humanitarian, financial, and military support. The report notes a large amount of assets coming out of the US arsenal which will eventually have to be replaced by equivalent, or even more advanced, weaponry, systems, and equipment. This is great for the aerospace and defense industries. However, the longer this continues, the greater the chances of escalation with weapons that can reach anywhere in the world.

China

As we have stated previously, a weakened opponent is often more dangerous. China’s economic recovery showed signs of weakening in May, with a slowdown in growth observed in both industrial output and retail sales. To stimulate the economy, the People’s Bank of China recently lowered the interest rate on its one-year policy loans by 10 basis points to 2.65%. The country’s economy is facing several challenges, including low business and consumer confidence, a sluggish property market, and a decline in global demand for exports.

According to World Bank data, approximately 42.9 per cent of China’s total population still lives in extreme poverty. If the economic growth that drove President Xi to power begins to falter beyond his ability to maintain public confidence, he may be inclined to create even greater conflicts outside his borders as a means of distraction. Right now, the prevailing sentiment is that China is the rising superpower ready to overtake the US in global reach and influence. Anything less than that would be an embarrassment and we can only speculate how far he is willing to go to avoid a change in perceptions.

BRICS+ (Brazil, Russia, India, China, South Africa, plus…)

Bangladesh, Algeria, Argentina, Egypt, Iran, Saudi Arabia, the UAE, Nigeria, and Syria are the latest group of countries that are now expressing their desire to sign up for BRICs+ membership.

These are among the most populous nations in the world (Nigeria, Egypt, and Bangladesh) and several of them have significant natural resources including Nigeria (oil), Algeria (natural gas), and South Africa (minerals).

The BRICS+ next annual leaders’ summit conference is scheduled for August 22–24. Their desire to ditch the dollar for international trade in goods and services has been made abundantly clear. Announcements of bilateral and multilateral agreements among countries to trade for goods and services in currencies other than the U.S. dollar are on the increase since the US placed sanctions on Russia in response to the Ukraine invasion. Russia and China are far down the road in terms of using their respective currencies for bilateral trade. China and Brazil have agreed to accept each other’s currency for goods and services traded between them. China is now Brazil’s largest trading partner.

This has not been lost on the US and, on June 7th, the House Financial Services Committee held a hearing called “Dollar Dominance: Preserving the U.S. Dollar’s Status as the Global Reserve Currency.” And at a recent financial summit in France, Treasury Secretary Yellen directly pushed back on comments made by Brazil’s President Luiz Inacio Lula da Silva and South Africa’s President Cyril Ramaphosa regarding the role of the dollar as the world’s reserve currency.

We are sure that the West is already preparing counter measures and any further moves by the BRICS+ beyond what has already happened will surely get a reaction. Regardless of what they may do, any volatility in the value of the US dollar could roil markets and worsen our economic conditions. One thing we believe is that any reaction by central bankers and governments will be focused on preserving their power and status regardless of the impact on the average citizen.

As a country, we have not managed our finances well, especially over the period since 2008 with a debt to GDP ratio rising over 120%. If every dime we made was put toward paying down our debts, we could not take it to zero in a single year. Another recent study emphasized the idea that increasing debt beyond 100% of GDP does not enhance economic growth and may actually have the opposite effect, and while we may be in better shape than the rest of the world, we will not come out of an economic conflict unscathed.

US Debt to GDP Ratio

Source: World Bank

We will be paying close attention to events as they unfold in the second half of the year.

Again, thank you for being our clients and allowing us to work with you in attaining your financial goals. The purpose of our letter is to briefly explain what has happened in the last three months and more importantly, look forward to what is currently happening and to try to help you make sense of the world from a financial perspective.

When we see opportunities, we will shift our holdings to take advantage of them. We also adjust as risks arise, but always with a long-term view in mind. Personal financial success looks different to everyone, but in all cases, it is best managed as a marathon and not a sprint.

As always, we enjoy your questions and comments, whether through emails or phone calls so please do not hesitate to connect with us as questions or concerns arise.

Read More

First Quarter 2023 Market Review

Beginning of the End?

All the major indices ended the first quarter in positive territory, led by the tech-heavy Nasdaq composite up 17.05% and driven by anticipation of an end to the fastest series of interest rate hikes in the last 50 years.
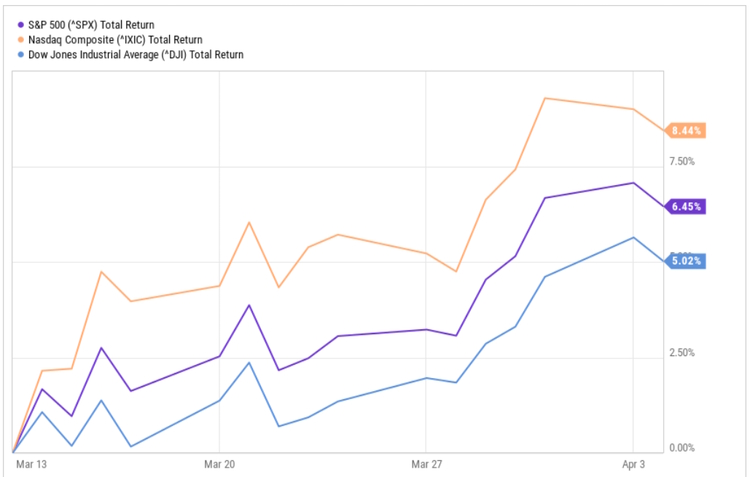
If you recall, the Dow Jones “outperformed” both the Nasdaq as well as the S&P 500 in 2022 so it wasn’t surprising to see it lag a bit this quarter. Is this the beginning of a new Bull Market, or just a pause on the way to lower lows? We don’t know the answer (no one does until the old trend is over and the new trend is confirmed), but we will look at the potential catalysts as well as risks heading into Q2.

Something Finally Broke

On Friday, March 10, Regulators closed troubled Silicon Valley Bank after deposit outflows and a failed capital raise plunged the country’s 16th largest bank into crisis, sending shock waves through the banking sector.

California state regulators seized the Santa Clara institution and appointed the Federal Deposit Insurance Corporation as receiver, meaning the FDIC will be able to sell off assets and return money to insured depositors.

We note that while SVB was not part of any of the portfolios we manage, it was only a month earlier that, during a February 8 episode of MSBNC’s Mad Money, host Jim Cramer instructed viewers to buy Silicon Valley Bank (courtesy of @watcher.guru). We don’t know how many people view this show as nothing more than entertainment versus solid investment advice, but we’re pretty sure that it may have triggered some people to invest.

Most people are now aware of the SVB collapse and multiple articles have been written about it as well, so we won’t spend a lot of time on what you already know but focus on details that resonate around investing themes.

Silicon Valley Bank had been around since 1983 and offered one-stop shopping to the tech community. They made loans to venture capital (VC) funds that would use those funds to make private equity investments in start-ups and small to medium size companies considered to have high growth potential.

If they weren’t already, many of these small companies became customers of SVB and SVB would make loans directly to them for funding operations and growth. In fact, SVB would often require borrowers to deposit the loan proceeds in their account and it is reported that some loan agreements even prohibited any deposits by the borrower at other banks. This meant that SVB dominated Silicon Valley finance by controlling both sides of the balance sheet. Its assets were loans to entrepreneurs, and its liabilities were deposits from those same entrepreneurs.

Many companies that had been SVB clients in their start-up stage went on to great success and built multi-billion-dollar cash positions. The CEOs of those successful clients, including Roku, Vox, Etsy, Cisco, and Coinbase, were loyal to SVB and continued to keep huge deposits there until the end.

SVB had always been vulnerable to startup booms and busts and had difficulties during the popping of the dot-com bubble and the Great Recession of 2007-2009 but it survived.

However, things changed after the Great Recession. Even though interest rates had been as low as 1% prior to 2008, they had never gone below 1% even looking all the way back to 1971 when Nixon ended the gold standard. Nor were they held so low for such a long period of time as they were from 2009 until 2017.
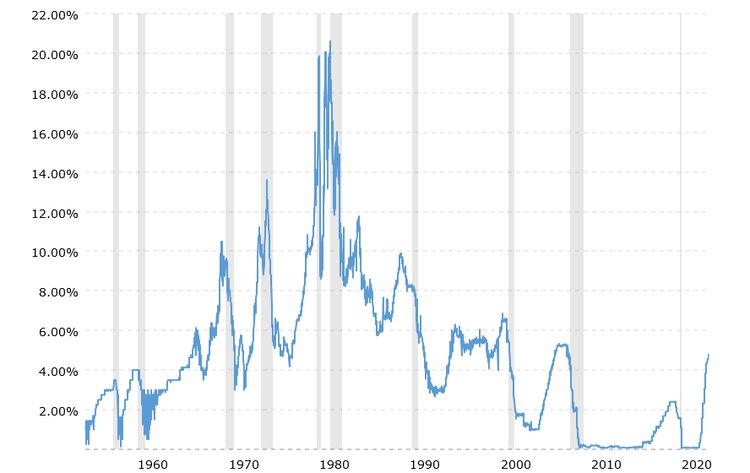
Federal Funds Rate – 62 Year Historical Chart

With interest rates so low, we see a situation similar to the one which led to the housing crisis. Venture capitalists, with easy access to cash, became less choosy about the ventures they were investing in and more concerned about “flipping” these businesses either to the public via

Initial Public Offerings (IPO) or to larger companies via acquisition.
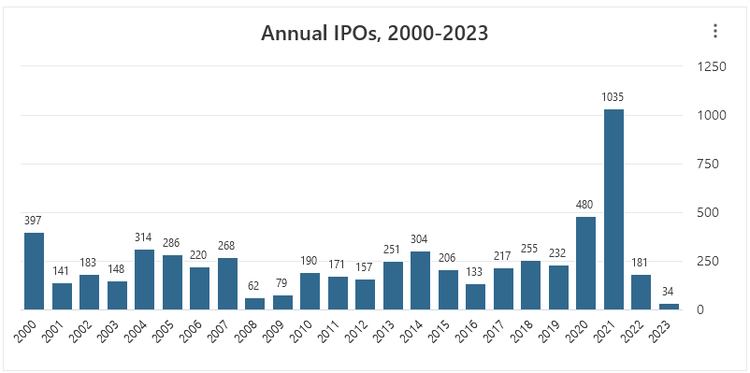
Source: Stockanalysis.com

It is speculated that the quality of loans to some riskier venture-backed companies with deposits at SVB had deteriorated over the past year. Many of those firms have come under significant financial pressure as rates have risen and securing capital has become more difficult compared to the low interest rate environment from just a couple of years ago.

With a portfolio full of potentially non-performing loans and deposit accounts owned by shaky start-up companies that received those loans, it was only a matter of time that the high inflation / rising interest rate environment would start wreaking havoc on the business.

To make matters worse, SVB was ill-prepared for their depositors to need their money. In the interest of maximizing profits, SVB bought longer-term, higher-yielding bonds when it was cash rich. While these bonds are considered “conservative” from a default risk perspective, their longer terms made them more susceptible to declines in value as interest rates rose. And the bank had loaded up on them, to the point that they accounted for 57% of the bank’s investment portfolio.

In a classic example of the phrase “slowly, then suddenly”, the value of SVB’s long-term investment portfolio declined over the past year as the Fed Funds rate jumped from 0.25% in March 2022 to 4.75% by February 2023 at the same time depositors needed to withdraw money.

In February, Moody’s told bank management that it was planning to reduce the bank’s credit rating. To pay depositors and head off a ratings downgrade, SVB sold $21 billion of bonds at a $1.8 billion loss. Then SVB’s management announced that SVB would raise $2.25 billion in new capital to cover the loss. Instead of being reassured, depositors panicked and withdrew $42 billion the day following the announcement. SVB was insolvent, unable to pay its depositors. The FDIC seized SVB.

The Board of Governors of the Federal Reserve certainly deserves blame for the Fed’s failure to regulate Silicon Valley Bank (SVB). Responsibility should begin with Fed Chair Jay Powell and his Vice Chair for Supervision, Michael Barr. However, if you are a long-time client, you know that we have railed that interest rates should have started to rise in 2013 when the major indices had recovered to their previous levels and the economy was growing again.
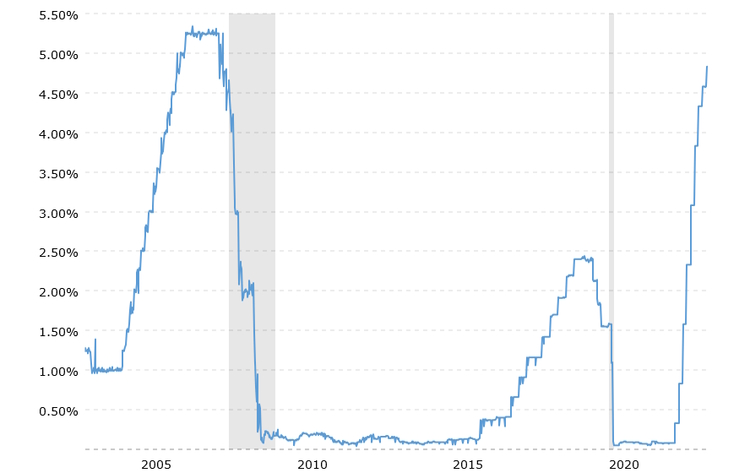
Federal Funds Rate

There was no sound economic justification for continuing the low-rate policy, yet Ben Bernanke refused to budge. His successor, Janet Yellen, who took over in 2014 after serving as the President of the Federal Reserve Bank of San Francisco, kept rates below 1% until 2017.

Still, the responsibility lies even closer to home than in Washington, D.C. The Federal Reserve is a system of twelve regional Federal Reserve Banks around the country that report to a Board in Washington. The regional bank responsible for the regulation of SVB is the aforementioned Federal Reserve Bank of San Francisco. According to an article published in the New York Times, Silicon Valley Bank’s risky practices were on the Federal Reserve’s radar for more than a year, to the point of receiving six citations in 2021.

Those citations, known as “matters requiring attention” and “matters requiring immediate attention,” flagged that the firm was doing a bad job of ensuring that it would have enough easily available cash on hand in the event of trouble. But neither the bank nor the Fed took any decisive actions before the bank was seized. So, this looks more like a failure of supervision by the regulator rather than the failure of the regulation regime itself.

We also note that during this time, right up to the moment of the bank’s seizure, one of the members of the Board of Directors of the San Francisco Fed was Greg Becker, who happened to be the CEO of Silicon Valley Bank. While we have no proof of cronyism within the walls of the San Francisco Fed, it could appear to an outsider that, at least in San Francisco, you get to regulate yourself.

The FDIC estimates the cost to the Deposit Insurance Fund to cover the collapse of Silicon Valley Bank to be $20 billion — including $18 billion to cover uninsured deposits, according to FDIC Chairman Martin Gruenberg. And the failure of Signature Bank is likely to require about $2.5 billion, including $1.6 billion to cover its uninsured deposits.

Like most insurance policies, whenever a claim is made, insurance rates will go up. This will impact all the FDIC-insured banks in the U.S. (approximately 4,700 institutions), most likely through special assessments on member banks. So, while, technically, no taxes collected by the U.S. Treasury will be used in this bail out, all taxpayers who bank at these institutions can expect to see higher fees in the future as banks take steps to protect their profitability.

For us, there are several investment lessons here to be learned:

Buy Quality

There is nothing more alluring than reading an email about a $5 stock that could become the next Google, Amazon, Tesla…take your pick. We get those same emails and research the recommendations. Often, we see statements like this:

“Currently unprofitable and not forecast to become profitable over the next 3 years”

While that doesn’t mean that the price of these stocks can’t rise under the right circumstances, it does mean that there is no fundamental basis for their valuations and eventually, those valuations matter.
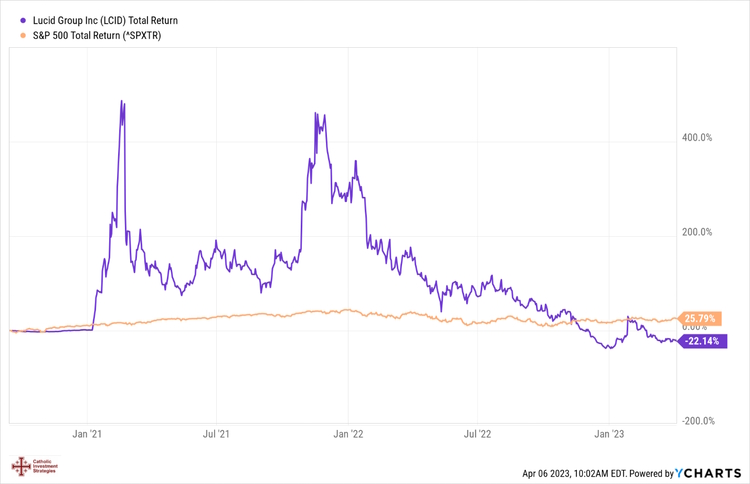
August 2022 email – The Next Tesla?

Alternatively, there is nothing more boring than a portfolio of well-managed companies that manage to grow and return value to shareholders despite economic downturns, wars, weather events, and even Presidential elections. While the average investor was panic-selling their high-flying stocks and moving to cash in 2022, the truly successful investors, as well as insiders of these better-run companies, were holding on and even getting out of cash and loading up on more bargains, all while probably sleeping better at night.

Cash (Flow) is King

In basic terms, SVB’s problem was cash flow management. They did not have sufficient cash to meet their obligations. To pay all the depositors, SVB sold $21 billion of bonds at a $1.8 billion loss. Those of you who are long time clients know how much we decry the depletion model of retirement based on withdrawal models like the “4% Rule.” We decry it because we know what can happen during bear markets.

At the worst possible time, the market will be down when you need to raise cash. It is reported that by the end of 2022, SVB had lost $16 billion in their bond portfolio. Interestingly, they, like all banks, had restrictions on how they could invest.

As small, private investors, we don’t have those restrictions. We are free to build a portfolio of quality businesses with a history of steady, or growing, profits and dividend distributions. If their fundamentals change, then we sell and go shopping for something better. Some of these companies have been around longer than we have and are adept at navigating rough waters. Also, we use bonds strategically; driving you crazy with questions about future expenditures to make sure that the cash is there when you need to write the check. If we believe that we can safely make a little bit of interest, we will. If not, then we advise you to stay in cash or cash equivalents.

Greed Kills

While their loan portfolio was less than AAA quality, SVB was not directly done in by those loans. Many analysts point out that if Silicon Valley Bank had exposed itself to less interest-rate risk by limiting its investment assets to much shorter durations, it would not have lost as much money when interest rates increased. SVB purchased most of these bonds when interest rates were near historic lows because they yielded a bit more than short-term securities. The pursuit of an extra fraction of a percentage point without considering what could go wrong is what ultimately led to their downfall.

Government Distorts

The fuse for the 2008 financial crisis was an obscure Bill signed by President Jimmy Carter called the Community Reinvestment Act of 1977 . While certainly well-intentioned, by the early 2000’s it had become a bludgeon used on the banking sector to make loans to the objectively uncreditworthy. To get these unmanageable portfolios of sub-prime loans off their books, banks bundled them into “collateralized default obligations,” or CDOs. It’s complicated, but by a process of breaking these pools into “tranches,” the banks were able to “create” AAA rated securities from what were originally BBB rated bonds. As implausible as it seems now, institutions hungry for yield bought these securities as they yielded more than other bonds with the same rating. Later, when the entire market fell apart, they were appropriately named “Toxic Assets.”

Similarly, the Fed’s maintenance of artificially low interest rates punished savers and caused many people to take unreasonable risk in order to get some level of return on their money by investing in vehicles including low quality bonds, land developments, managed futures, or structured products. When inflation raises its ugly head, whether due to profligate spending, government shutdowns, or war, it’s critical that your investments are allocated in such a way that these events do not upend your plan.

There are no Experts

The current President of the San Francisco Fed Bank is Mary Daly. She has worked at that institution since 1996, but has never actually worked at a bank. Her predecessor, John C. Williams, didn’t work in the banking sector either, nor did his predecessor, our current Treasury Secretary Janet Yellen. Most of these people came out of academia, with lofty college degrees and went straight into government or quasi-government roles. In fact, when we look at the various Fed Chairs, going back to Author Burns, we find very few people who actually ever worked in the private sector. To his credit, Jerome Powell spent some time working as a lawyer and investment banker in New York, so at least the word “bank” appears in his resume.

Joking aside, these people make policy decisions that impact us, our businesses, and institutions, like banks, that we rely on to conduct our daily activities. A strong, sound banking system is crucial to our economic well-being. By all accounts, SVB was an avoidable crisis that somehow the “experts” running the bank and regulating the bank all missed. The crisis was “contained’ only by extraordinary government intervention. It may well lead to more distortions down the road. We all want to believe that the people running our institutions are the best and the brightest that America has to offer, always acting in good faith for the benefit of the citizens. But alas, as Louisa Alcott wrote in her story, Jo’s Boys,

“The youngest, aged twelve, could not conceal her disappointment, and turned away, feeling as so many of us have felt when we discover that our idols are very ordinary men and women.”

We note that the extraordinary measures taken by the government (guaranteeing all deposits at both Silicon Valley Bank and Signature Bank beyond the stated FDIC insured limit of $250,000) helped reduce the potential of runs on more traditionally managed banks. While both SVB and Signature (which was heavily exposed to crypto currency) were unique in their client base and business practices, almost any bank would be severely strained by the coincident withdrawal of a significant portion of their uninsured deposits. For now, that fear has waned as reflected by the rally in all three major indices since March 13th.

In the meantime, there are still many other things to worry about.

The Federal Reserve and Inflation

While many pundits predicted that the Fed would put a pause on rate increases, they continued in March by increasing the Fed Funds Rate by another 25 basis points (bps), following their 25 bps increase in January. The targeted range is now between 4.75% and 5.0%. The current Dot Plot is still projecting 5.1% for end of year 2023 without a pivot from rate hikes to rate cuts until 2024.
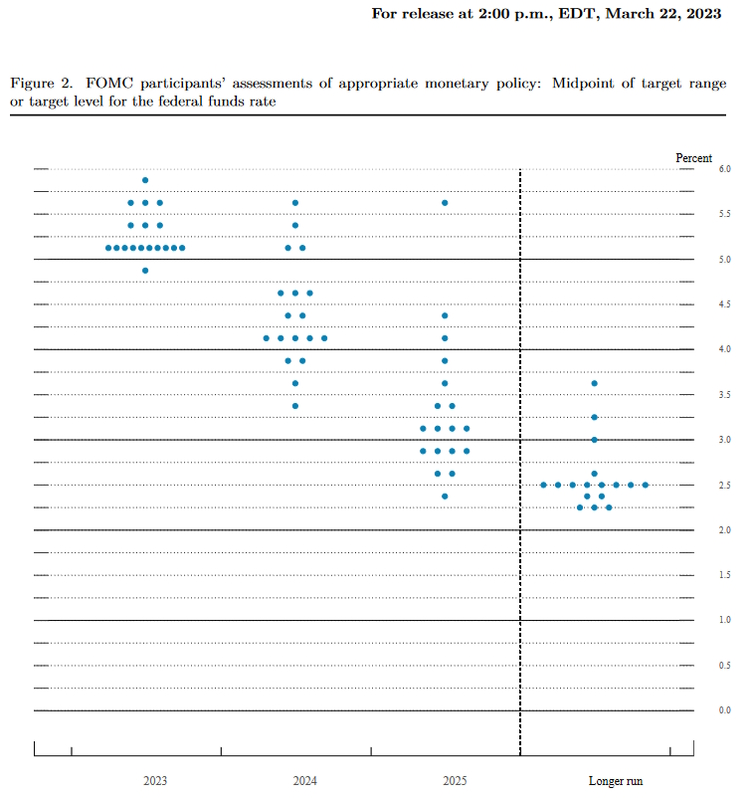
A Funny Thing Happened on the Way to the March Meeting

The U.S. Bureau of Labor Statistics recently changed its Consumer Price Index weightings for housing and gasoline in a way that will lower the Consumer Price Index (CPI). Here are the details:

In late 2022, the U.S. Bureau of Labor Statistics (“BLS”) announced that the weightings in the index will now be based on a single year’s spending patterns rather than the previous method of a two-year blend. That means that this year’s weightings will be based on spending habits in 2021. Under the previous method, the spending calculation would have been based on 2019 and 2020.

One of the biggest changes was the weighting for housing. As we covered in our Q3 2022 letter, Housing has accounted for nearly 43% of the index for the past decades. But now it will now make up 45%, thus giving it even more weight than before. While predicting a lower CPI level in light of an increased housing weight may seem counter-intuitive since housing prices “always” tend to rise, look at the Case-Shiller Home Price Index since the Fed started raising rates last March (Red Line):
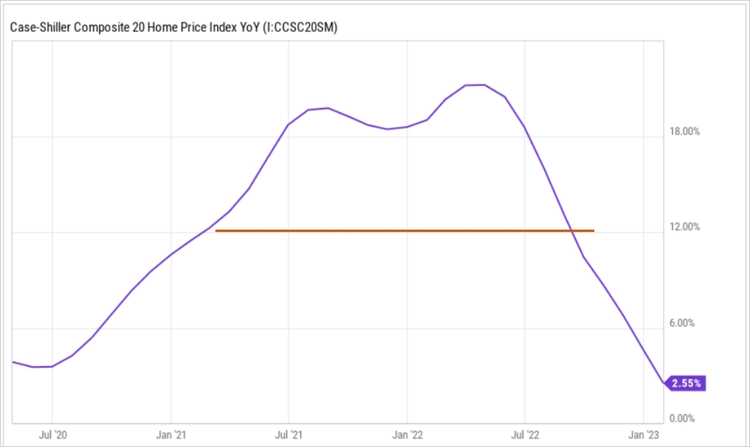
If you want to look like you’re winning the battle against inflation, while making sure that you don’t raise rates so high that you do some major economic damage, you change the way that inflation is measured so that it fits your narrative.

As home prices fall, they’ll bring down housing inflation. And, if housing has a larger weighting in the CPI, the overall inflation reading should tend to come down as well.

While they were at it, the BLS also changed the weighting for gasoline prices from 4% to 3.2%. And as we mentioned, the reading is now based on 2021’s spending habits.

While it is clear that government officials are changing the standard for inflation, this isn’t the first. The last change was in 2002 when George W. Bush was the sitting President. The economy was struggling after 9/11 and it was feared that things would go badly if the Fed started raising interest rates. So, the BLS changed its CPI methodology. It adjusted the index weightings from a 10-year spending average to a two-year average. It wanted to reflect consumers’ spending habits “more accurately.” The outcome was a slowdown in inflation growth and interest rates staying lower for longer.

Of course, as we have said before, none of this is new, from unemployment to inflation to GDP, the government has made changes when it has been in their best interest to do so. For more on this subject, we suggest that you visit John Williams’ Shadow Government Statistics although you may want to make sure that you’re sitting down before you look at the data.

If you recall, from our Q3 2022 letter, we stated:

So, the Fed doesn’t need prices to “come down” to declare victory, they only need the increases to be around 2% from the year prior. Therefore, beginning in March of 2023, we should see year over year inflation increases begin to approach that level.

With these new adjustments in place, it’s only a matter of time before slowing inflation starts showing up. We might be off by a month or two, but we feel very confident that Powell and company will be taking victory laps by summer and the administration will be touting the Inflation Reduction Act passed last September as the catalyst behind this.

Then, it will be on to the next crisis.

Recession Risk

One of our investing mentors always told us to keep the investment channels on mute so that we wouldn’t be influenced by people who knew nothing about what they were talking about and to trust the markets instead. In that spirit we consult the bond market to gauge expectations for the economy.

As you can see below, the yield curve remains inverted, and we note that the current inversion (green line) is “getting steeper” than it was back in December (red line). Since World War II every yield curve inversion has been followed by a recession in the following 6-18 months.

Officials at the New York Federal Reserve use the yield curve to calculate the probability that the U.S. economy will be in a recession in 12 months. The calculation is forward-looking, to the next 12 months from the time of the calculation, not anytime in the subsequent 12 months.

Noting the blue line, we see that that the curve first began to invert about a year ago. This means that if the historic pattern holds, there is a better than 50% probability that the U.S. could soon be entering into a recession and remain there at least through February 2024.
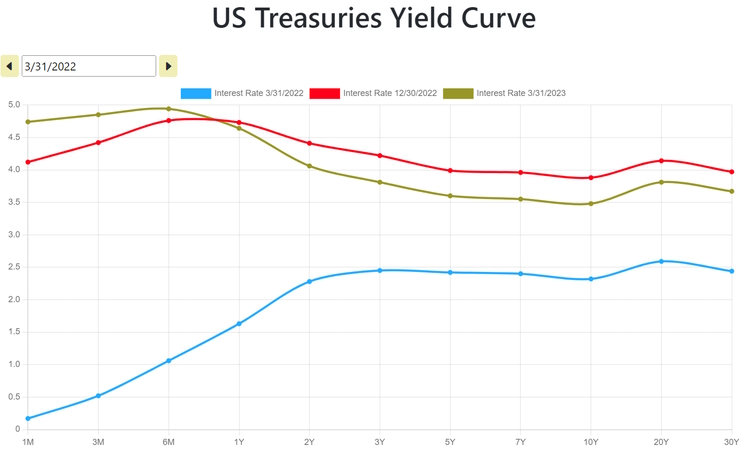
The prospect of an imminent recession aligns with recent estimates of corporate earnings. According to the financial data and analytics company FactSet, analysts lowered EPS estimates for the first quarter of 2023 by a larger margin than average. From their post, dated 3/31/2023:

The Q1 bottom-up EPS estimate (which is an aggregation of the median EPS estimates for Q1 for all the companies in the index) decreased by 6.3% (to $50.75 from $54.13) from December 31 to March 30.

The post goes on to say that the decline in the bottom-up EPS estimate recorded during the first quarter was larger than the 5-year average, the 10-year average, the 15-year average, and the 20-year average.
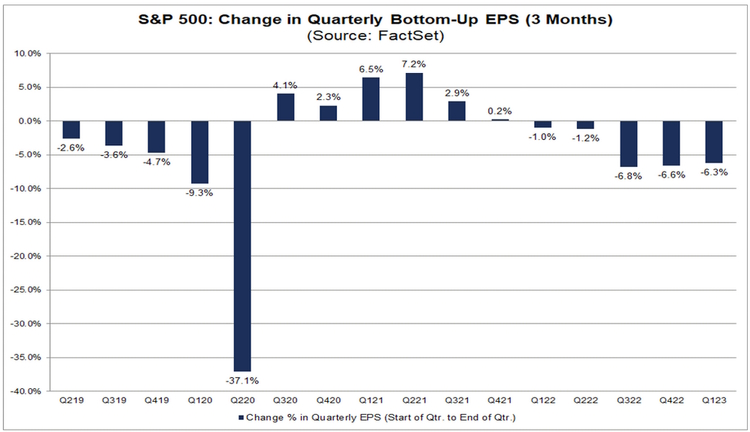
While analysts were decreasing EPS estimates in aggregate for the first quarter, they were also decreasing EPS estimates in aggregate for all of calendar year 2023. The bottom-up EPS estimate for 2023 declined by 3.8% (to $221.50 from $230.33) from December 31 to March 30.
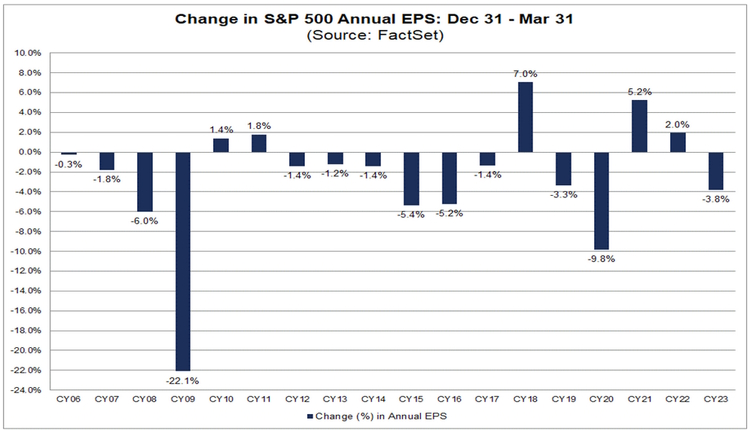
Consumer debt has also been giving off warning signals as Americans’ total credit card balance was $986 billion in the fourth quarter of 2022, according to the latest consumer debt data from the Federal Reserve Bank of New York. That is the highest total since the New York Fed began tracking the level in 1999. It marks a $61 billion jump from $925 billion in the third quarter of 2022, which is the largest quarterly increase in the history of the report.
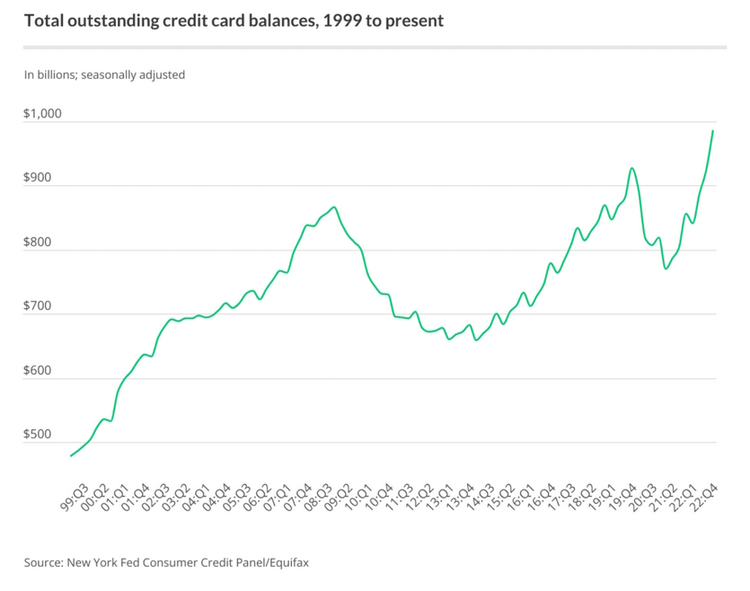
Overall, the national average card debt among cardholders with unpaid balances in December 2022 was $7,279. That includes debt from bank cards and retail credit cards.

To us, it appears that, likely out of necessity, consumers are dealing with higher prices by taking on higher credit balances. As most of us have experienced at least once in our lives, usually in college or shortly after, this is an unsustainable situation. At some point, those cards will be maxed out and people will be forced to cut back. Cracks may already be starting to form. According to TransUnion, the volume of borrowers more than 60 days behind on their auto loans in Q3 and Q4 2022 crept up by 0.13 percent—nearly double the seasonal average of 0.07—to 1.78 percent.

The most notable hike concerns subprime borrowers, 5.67 percent of whom were two months behind on their payments according to Fitch Ratings, per Bloomberg. That is up from just 2.58 percent in April 2021, and above the 5.09 percent high reached in January 2009.

And, according to a recent American Bankruptcy Institute (ABI) report, new bankruptcy filings in February 2023 registered double-digit increases year-over-year across all U.S. major filing categories, according to data provided by Epiq Bankruptcy, the leading provider of U.S. bankruptcy filing data.

Is Commercial real estate in trouble?

Commercial real estate has been through a pandemic, very rapid recovery, then massive tightening of financial conditions unlike anything we’ve seen in our lifetimes. Many commercial real estate owners have lots of space sitting empty in major city centers as a result of more hybrid and remote work arrangements resulting from the pandemic. Now they’ve come under pressure from the Federal Reserve’s aggressive campaign to raise interest rates, which raised borrowing costs and lowered building values.

Beleaguered banks, especially smaller ones, could get more aggressive with real estate lending terms, giving landlords even less room to breathe as they try to refinance loans coming due.

This year, roughly $270 billion in commercial mortgages held by banks are set to mature, according to Trepp, and $1.4 trillion over the next five years.

Two early warnings of the danger that rising interest rates pose to commercial real estate came last month. Giant landlord Columbia Property Trust defaulted on $1.7 billion in floating-rate loans tied to seven buildings in New York, San Francisco, Boston and Jersey City, N.J. That followed a default by giant money manager Brookfield Asset Management on more than $750 million in debt backing two 52-story towers in Los Angeles.

Still, in a recent press conference, Jerome Powell acknowledged that despite a tightening of credit conditions as banks pull back, which will help cool the economy, he did not see the current conditions presenting the kind of systemic risk that we saw in the 2008 mortgage crisis. Of course, two years ago he said that inflation was transitory…there are no experts.

What this means for investors is that as economic conditions deteriorate, inflation, especially as measured today, should moderate which will allow the Federal Reserve to pause interest rates and, if things get bad enough, even cut them, given the amount of room they have given themselves in the past year. That, as we’ve learned, will be “good” for stock prices. So, it may soon be time to take advantage of short-term volatility to finish our bargain shopping before prices begin to rise again.
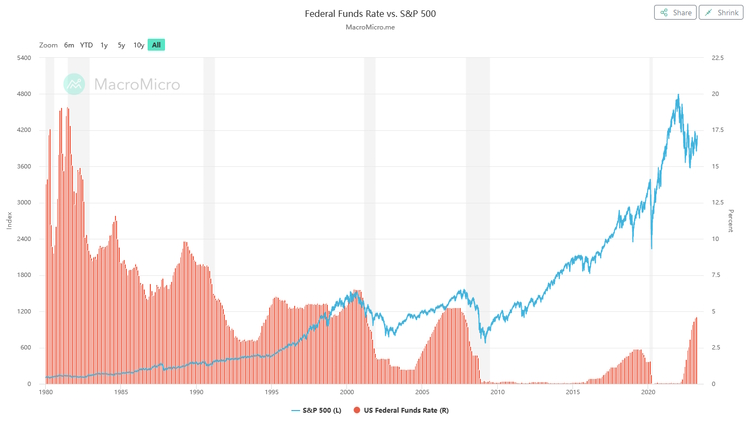
The Demise of the Dollar?

Over the past year, particularly after Russia invaded Ukraine, the BRIC nations have increased their efforts to create an alternative global financial system to compete with the West in general and, obviously, the U.S. in particular.

Earlier this month, Xi Jinping and Vladimir Putin signed an agreement solidifying their “No Limits” Partnership, much of which involves economic cooperation and trade.

China has emerged as a major buyer of sharply discounted Russian oil and gas as Western buyers have banned energy imports. Russia was China’s top oil supplier in January and February at 1.94 million barrels per day, up from 1.57 million in 2022, according to Chinese customs data.

China’s imports of Russian pipeline gas and liquefied natural gas last year jumped 2.6 times and 2.4 times, respectively, to $3.98bn and $6.75bn.

Meanwhile, China’s imports of Russian coal surged 20 percent to 68.06 million tons.

While Russia has been selling energy to China, Russia has been ramping up imports of Chinese goods, including machinery, electronics, base metals, vehicles, ships, and aircraft.

With Russia blocked from using the dollar-dominated international financial system after the West cut off Russian financial institutions from the international payments system SWIFT and Western banks and credit card companies stopped doing business in Russia, the Chinese yuan and cryptocurrency have stepped into the void.

The share of yuan-based transactions grew from 0.4 percent to 14 percent of the total in a nine-month period, according to the Carnegie Endowment for International Peace. In September, two Russian banks began to lend in yuan and also use the currency for money transfers in lieu of SWIFT.

The Russia/China agreement also pushed forward the planned Power of Siberia 2 pipeline, which would deliver 50 billion cubic meters (bcm) of natural gas per year from Russia to China via Mongolia. The pipeline has gained urgency as Moscow seeks to replace Europe as its major gas customer.

Russia’s news agency, TASS, reported that the two leaders also discussed the internet and agreed that they stand “against militarization of information and communication technologies and support multilateral, equal and transparent management of the Internet.”

“[They] support creation of a multilateral, equal and transparent global management system of the Internet with the support of sovereignty and security of all countries in this sphere,” TASS quoted the agreement as saying.

But Russia is not the only country China has been negotiating with. On March 29, it was reported that Brazil and China have reportedly struck a deal to ditch the U.S. dollar in favor of their own currencies in trade transactions. The deal will enable China and Brazil to carry out trade and financial transactions directly, exchanging yuan for reais – or vice versa – rather than first converting their currencies to the U.S. dollar.

China is Brazil’s largest trading partner, accounting for more than a fifth of all imports, followed by the United States, according to the latest figures. China is also Brazil’s largest export market, accounting for more than a third of all exports.

Additionally, Honduras just aligned with China, ending their diplomatic recognition of Taiwan. Saudi Arabia is reported to be considering using China’s currency for oil trades. China owns 15 of the 19 cobalt mines in the Congo, which are considered to be the largest cobalt reserves in the world. Cobalt is vital to electric vehicle production, a priority for our Departments of Energy and Transportation, among others.

Finally, according to a recent article in the New York Times, China is emerging as a new heavyweight in providing emergency funds to debt-ridden countries, catching up to the International Monetary Fund (IMF) as a lender of last resort.

To say that China has become an influential player in the global financial markets and geopolitics is an understatement; and now with the West distracted with economic turmoil and the war in Ukraine they seem poised to take their place on the world stage as a global superpower equal or even superior to the U.S.

Even Bridgewater’s Ray Dalio has predicted that the Chinese yuan would displace the U.S. dollar as the world’s leading reserve currency in a matter of time.

We are not experts in foreign relations. In truth, domestic relations are challenging enough for us. We do see implications in China’s efforts that will affect western economies in general, particularly the U.S.

First, since all of us get inundated with hyperbolic emails with every economic or geopolitical event, let’s start with an understanding of terms.

Many financial outlets as well as newsletter writers tend to confuse the idea of reserve currency versus the currency used for global payment systems. A reserve currency is, essentially, the currency in which your cash and cash reserve holdings are denominated. Most countries don’t hold piles of dollar bills in some vault. Instead they use those dollars to buy securities, usually U.S. Treasuries.

A great example of this is, in fact, China. Chinese exporters receive U.S. dollars (USD) for their goods sold to purchasers in the U.S., but they need yuan to pay their workers and store money locally. The People’s Bank of China (PBOC), buys the available excess U.S. dollars from the exporters and gives them the required yuan. China hence accumulates USD as forex reserves.

China needs to invest its huge stockpile of dollars to earn at least the risk-free rate. With trillions of U.S. dollars, China has found the U.S. Treasury securities to offer the safest investment destination for Chinese forex reserves. Since U.S. Treasuries are denominated in the U.S. dollar, the dollar is considered the reserve currency. And while it has been reported that both China’s and Russia’s central banks have been using some of their cash reserves to accumulate gold, the truth is that they are among the top five gold producers in the world and are likely buying those gold reserves in yuan and rubles.

This is different from a global payment currency where all parties are using the same currency for cross-border transactions. The best example of this is the idea of the “Petro Dollar,” where oil transactions were all made using U.S. dollars.

The truth is that anything can be used as a currency, but as technology has improved and global trade has increased, it makes sense that the world’s major importers will make transactions in their currencies. As late as January 2023, the Euro and U.S. dollar together made up more than seven out of 10 SWIFT payments worldwide, outperforming all other currencies.

This is where the USD is going to suffer, as financial sanctions will push countries to enact transactions in something other than the USD or the Euro. Still, if you’re a net exporter, you will still be trading with the largest importers in their currency, not yours. Based on 2020 data, the world’s largest importers, by a factor of 10, are the U.S., China and Germany. According to Marc Chandler (no relation), the chief market strategist for Bannockburn Global Forex, the dollar is on one side of 88% of currency trades, little changed from 1989 (when the dollar was one side of 90% of currency trades). China may be the most important trade partner for more countries than the U.S., but the dollar’s role remains paramount. You can read the entire article printed by Barron’s: The Dollar Rules the Financial Universe. China Can’t Change That.

A More Immediate Threat?

What we believe China is doing is securing energy sources and strategic materials for its manufacturing-based export economy. While they do have mining resources, they lack oil and natural gas reserves. They are still heavily reliant on coal for generating electricity as well as metallurgy while they are transitioning to nuclear power (as opposed to wind and solar). Russia, Iran and now Saudi Arabia are all secure sources of oil and natural gas.

Additionally, you may recall that Russia secured vast amounts of uranium when in 2013 they acquired a Canadian uranium mining company known as Uranium One which owns assets in the U.S. Many of Africa’s most mineral-rich states currently rely on China for a sizable margin, if not all, of their exports (crude petroleum from Angola and South Sudan, zinc and copper ore from Eritrea, cobalt from DR Congo, raw tobacco from Zimbabwe, iron and titanium from Sierra Leone).

By securing global resources, China appears to be cornering the market for critical as well as noncritical supplies. China now dominates the world’s production of new generation batteries that are essential for electric vehicles and most portable consumer electronics such as cell phones and laptops. “China controls the processing of pretty much all the critical minerals, whether it’s rare earth, lithium, cobalt or graphite,” according to Pini Althaus, the chief executive of USA Rare Earth.

China may feel that, by controlling major components and resources that the U.S. and EU have become dependent on, they will be more likely to realize their ambition to become the dominant world power within 30 years (as detailed in a 2021 speech by Xi).

A major part of that speech involved resolving the “Taiwan question.” China has become increasingly direct in its threats to invade Taiwan. Taiwan Semiconductor (TSM) accounts for more than 50% of global chip manufacturing and, therefore, it is of vital interest to Western economies. China faces real headwinds of debt, demographics, and the potential for decoupling of trade with the West. Chinese leaders might feel that this is the moment to seize control of the Western Pacific and South Asia while so many Western resources are being expended on Ukraine. While we don’t believe that this would result in an all-out war, it would certainly increase stress on the already fragile global supply chain and throw the U.S. economy into further chaos.

Conclusion

We apologize for the heaviness of this letter, we’d much rather be writing about sunshine, rainbows and 20% annual returns as far as the eye can see. But the world rarely, if ever, cooperates when we want it to. There are times like these when it does feel like darkness is closing in from all sides, but for most of us, that means that we simply haven’t lived long enough.

As an example, I present my 93-year-old Carlsbad neighbor, Jack, who, along with his family, was sent to an internment camp during World War II for the crime of being Japanese. He later enlisted in the US military and fought in the Korean War, came back to the U.S., got an engineering degree and is responsible for much of the current water and sewage systems still in use in Carlsbad today.

When discussing the issues of the day, Jack just smiled at me and said, “You know, I’ve seen a lot of ‘stuff’ in my life, and I’ll tell you what, this is nothing new and this is still the best country to be born and to live in.”

And we’ll end with a quote from a successful investor in his most recent letter to shareholders:

“I have been investing for 80 years – more than one-third of our country’s lifetime. Despite our citizens’ penchant – almost enthusiasm – for self-criticism and self-doubt, I have yet to see a time when it made sense to make a long-term bet against America. And I doubt very much that any reader of this letter will have a different experience in the future.”

As always, we appreciate you and the trust you place in us as we pursue your financial goals together.

Read More

Fourth Quarter Market Review

A Sea Change in the Markets?

This headline from Yahoo Finance on Friday, December 30, pretty much says it all:

S&P 500 falls 19.4% in 2022, worst year since 2008 financial crisis

More from the article:

With Friday’s losses, the S&P 500 fell 19.4% in 2022, its largest calendar-year decline since a 38% drop in 2008. Closing at 3,839.50 on Friday, the S&P 500 now stands at the same level as March 2021. The Nasdaq Composite dropped 33% and stands at the same level as July 2020. The Dow, meanwhile, fell a comparably modest 9% in 2022, while the bond market suffered through its worst year in modern history.

Zooming in on the 4th quarter, we see a strong gain in the S&P 500 and a very strong gain in the Dow, while the more interest rate sensitive Nasdaq saw a modest loss.

Adding TNX (the CBOE Ten Year Treasury Note Yield Index) to the full year chart, we see confirmation that the Fed is driving market returns through its rate actions.

This Index is based on the yield-to-maturity of the most recently auctioned 10-year Treasury note. The notes are usually auctioned every three months in February, May, August, and November. We use TNX as a good “general” gauge of the current interest rate environment. Keep in mind that the index moves inversely with bond prices, so the gain in the index reflects a substantial drop in the value of bonds or funds that invest in bonds such as the iShares 7-10 Year Treasury Bond ETF (ticker symbol IEF).

This is one reason why we are seeing so many articles announcing the demise of the “60 / 40” portfolio, usually accompanied by an alternative strategy that has a very short performance history.

With 2022 now firmly in the rear-view mirror, let’s look at those issues that may impact the markets in 2023.

The Federal Reserve

The Federal Reserve “slowed” their rate of interest rate hikes in December by increasing the Fed Funds Rate by only 50 basis points (bps), taking it to a targeted range between 4.25% and 4.50% after four consecutive hikes of 75 bps from June to November. The current Dot Plot is projecting 5.1% for end of year 2023 versus a forecast of 4.6% back in September 2022 and that there will not be a pivot from rate hikes to rate cuts until 2024.

So far, the forecast aligns with our Q3 projections that Powell is using “inflation” to raise rates back up to a pre-2008 range of 4%-6% which will provide more room for cuts in the face of the next economic downturn, even if the Fed causes it.

Target Federal Funds Rate 2000 – Present

With the December rate hike putting the current range at 4.25% – 4.50%, it would not surprise us to see another 50 bp hike at the January / February meeting and then a 25 bp hike in the March meeting taking the range to 5.00% – 5.25% before announcing a pause.

This would fit with our belief that the year over year rate of inflation from March 2022 to March 2023, will be substantially “lower” than what we saw between March 2021 and 2022, as the intial spikes from the various inputs have subsided and home prices in particular have “crashed” from June highs.

An announced pause in rate hikes will help to establish a floor for the markets and serve to reduce market volatility which remains elevated compared to recent levels.

There are two caveats to our theory that we must point out.

“Push me-Pull you” Economic Policies

We know that Federal Reserve and government officials speak with each other both in formal hearings as well as behind closed doors. The current Treasury Secretary IS the previous Fed Chair before Powell. We also know the official narrative is that this inflation is caused by all the stimulus spending over the past two years. Yet, since the end of the year, Congress has passed two massive spending bills; the Orwellian, “Inflation Reduction Act” and the more aptly named “Omnibus Spending Bill.”

The two bills combined will add approximately $2.4 trillion of new spending to the $2.8 trillion (fiscal 2021) budget deficit.

The spending initiatives are so vast that it is beyond our capability to know their short-term impact on costs. The likely case for the markets, and the rest of us for that matter, is that this new spending exacerbates upward pressure on prices and forces the Fed to raise rates higher for longer than currently planned.

Supply-Driven Inflation

No modern economy can thrive without a source of low cost and reliable energy. Domestic oil production is still sitting below pre-pandemic 2020 levels which translates into higher prices as demand continues to increase.

And while the Inflation Reduction Act allocates billions of dollars to the development of wind and solar power, those technologies cannot replace oil and gas as currently configured. In Germany, a country the size of the state of Montana, the government has spent nearly $500 billion to convert energy production to wind and solar from oil, natural gas and nuclear power, yet the economy remains highly dependent on (previously Russian) natural gas for energy production.

Instead of learning from Germany’s mistakes, the US Energy department seems determined to follow it and the EU down the same path.

In contrast, China, who did not connect its first nuclear power station to the grid until the early 1990s, now has a massive 228 nuclear reactors in development, according to GlobalData.

Should energy prices resume an upward trajectory, this will continue to impact prices across the economy and make taming inflation via the Fed’s current strategy even more difficult.

Balance Sheet Redux

In addition to direct rate hikes, the Fed continues to allow up to $60 billion in Treasury securities and $35 billion in agency mortgage-backed securities (MBS) to mature and roll off its $8.5+ trillion balance sheet each month (an operation coined “quantitative tightening”) as part of its battle against inflation. These actions will continue to prop up interest rates, even after an announced pause, and so it is hard to gauge if this will have a muting effect on the markets. They will however, better position the Fed for the next financial crisis as they have become the world’s central bank in these situations.

Persistent Higher Prices

Remember that PCE (Personal Consumption Expenditures) is a measure of the prices people in the United States pay for goods and services. So, while the Fed can play games with year over year changes to justify rate decisions, the hard truth is that the cost of everyday goods and services have continued to increase and will continue to increase at an uncomfortable rate.

Not only do higher costs impact our quality of life, often forcing painful tradeoffs regarding annual spending decisions, they also impact profitability if input costs cannot be fully passed through to the consumer. Which leads to the next concern:

Earnings

According to FactSet:

For Q4 2022, the estimated earnings decline for the S&P 500 is -2.8%. If -2.8% is the actual decline for the quarter, it will mark the first time the index has reported a (year-over-year) earnings decline since Q3 2020 (-5.7%).

Additionally, for Q4 2022, 63 S&P 500 companies have issued negative EPS guidance and 34 S&P 500 companies have issued positive EPS guidance.

For perspective, 73 companies issued negative guidance for Q4 2019, so while this is not a good situation, it is certainly not catastrophic.

However, when combined with the current interest rate environment, it certainly can lead to more market volatility in the short term, at least until the Fed announces a pause.

This also matters to us because, regardless of short-term market direction, earnings drive dividends. Specifically, dividends are a distribution of corporate earnings to eligible shareholders as determined by a company’s board of directors. Any slowdown in earnings growth can have a negative impact on annual increases of dividend payments made by the companies we own.

Recession

As of 12/30/22, the yield curve remains inverted, again signaling the possibility of a recession occurring in 2023.

Looking beyond the US, International Monetary Fund Managing Director Kristalina Georgieva said the group anticipates one-third of the global economy will experience a recession in 2023.

In these days of non-stop government intervention, a recession can be a double-edged sword. On one side, we see higher unemployment, lower economic activity, higher deficit spending, and typically lower sales and earnings (see above). On the other hand, a slowdown would certainly force the Fed to pause on interest rate hikes or possibly to slowly cut rates as indicated in their latest dot plot, which would likely provide at least a short-term boost for the markets.

Looking at the three most recent recessions, we can see that the Fed has been quick to drop rates and drop them substantially with each succeeding downturn, and the market has responded positively.

The worst-case situation would be “stagflation” where the economy dips into recession, but supply-side cost drivers, particularly energy, continue to push the Fed’s measure of inflation higher. It wasn’t that long ago we were reading that the Fed had “painted themselves into a corner” with zero interest rates and a wobbly economy. Now it seems that they could be sitting in a different corner with stubbornly high inflation and a recession. We addressed stagflation in our First Quarter 2022 Market Review.

Ukraine / Nuclear War

As the war drags into its 11th month with no end in sight, Russian President Vladimir Putin devoted his annual New Year’s address on Saturday to rallying the Russian people behind his troops and pledging victory over Ukraine and a West “intent on destroying Russia.”

Again, it is difficult to find facts through the fog of war, but we are clearly seeing Ukraine as a proxy for a larger conflict.

Even before the latest Omnibus Spending Bill, which pledges an additional $48 Billion in military support, the US was already the largest contributor of resources to Ukraine from among a large contingent of western countries.

This data suggests that we are once again in a proxy war with Russia (see Charlie Wilson’s War). In addition to money and military hardware, the US is also providing a large amount of intelligence support enabling the Ukrainians to navigate around the supposedly superior Russian forces. So, while the Ukrainian forces are doing the actual fighting, the US is firmly in their corner with money, technology, and weapons.

While the West is providing support for Ukraine, it is reported that Iran and North Korea are providing resources including military drones to Russia while both China and India continue to purchase oil from them.

The US government had been critical of these purchases, although it’s now made clear that it accepts that India can continue to buy discounted Russian oil.

While these actions likely mean that this war will drag on much longer, these alliances could potentially reduce the possibility of a desperate move by Putin, such as setting off a nuclear bomb. It also suggests a larger divide of the global economy than was thought possible even a few years ago.

We alluded to this in our Q2 Market Review in which we discussed a virtual Summit among the BRICS nations (Brazil, Russia, India, China and now, South Africa) and their ambitious list of proposals for strengthening the group’s economic and political influence.

We may be seeing a continuing realignment of the world’s countries, and certainly stronger ties between China, India, and Russia. China is the world’s second largest economy with stated global ambitions and India has now overtaken France as the sixth largest economy and has also overtaken China as the world’s fastest growing economy according to Business Insider. Both countries see the unprecedented economic warfare the US-led coalition has unleashed against Russia including expulsion from the SWIFT system which is used for international financial transfers and the freezing of the hard currency reserves of the Russian central bank.

These actions are not lost on Chinese and Indian leadership, and they may decide that it is in their long-term best interest to reduce financial vulnerability by setting up alternative systems.

This will continue to be a situation to be watched as the West, already dependent on “cheap labor” in developing countries, continues to become more dependent on resources from other countries as a consequence of refusing to utilize their own. We think eventually the developing countries will begin to see the amount of leverage they hold and once again throw a wrench into the American-led world order.

In the 1990s, the US and its Western European allies accounted for 70% of global GDP and today that number is under 50%. The oil embargo of the 1970s is a useful example of how quickly economic fortunes can turn.

Obviously, the key player in all of this is…

China

It doesn’t seem right to finish our letter without a look at the world’s second largest economy. As we have documented, China has been struggling with the effects of its Covid lockdown policies as well as the collapse of its real estate market.

Despite efforts to spur demand, China’s real estate crisis remains an issue as it appears prices are declining at an accelerating pace thereby putting more pressure on their credit markets and requiring ongoing intervention from the banking system.

We thought that Chinese President Xi had backed himself into a corner with his strict Covid lockdown strategies. Despite shutting down entire cities and implementing ruthless testing protocols, the policies failed to eliminate the disease from the country of over one billion people.

However, as with nearly every world leader we follow, Xi has followed the number one rule of politics: never admit you’re wrong. He seemed to be stuck with a policy that was doing nothing to curb infections while at the same time causing serious damage to his economy.

Then, in November, a fire broke out in a locked down residential building which resulted in the deaths of 10 people and injury to nine others. Soon afterwards, videos appeared to show crowds of people protesting the government’s strict “zero-COVID” policy in the streets of cities across the country.

While many in the West saw this as a political uprising, Xi saw this as an opportunity to gain more public support and escape the economic box he had created by announcing sweeping changes to the policy including allowing home quarantine, scrapping the health QR code that had been mandatory for entering most public places, restricting lockdowns to only “high-risk areas,” and making domestic travel within China easier.

In an address to the nation’s top political advisory body, Xi announced “We have optimized Covid control strategy based on time and situation in order to best protect people’s lives and health, and minimize the impact on economic and social development.”

China appears to be playing three-dimensional geopolitical chess with the rest of the world. Within a span of five days, the following headlines have come across our newsfeed:

New Chinese Foreign Minister Qin Gang sought better Sino-U.S. ties in a phone conversation with Secretary of State Antony Blinken on New Year’s Day, according to a statement from the Ministry of Foreign Affairs in Beijing. – Bloomberg

Putin and Xi to speak by video link on Friday Russian President Vladimir Putin will speak with Chinese President Xi Jinping via video link on Friday to discuss a host of bilateral and regional issues. – Reuters

While the U.S. has sought to persuade countries to reduce their dependence on China, trade ties Between the world’s second-largest economy and the rest of Asia are deepening as economies grow and companies refashion supply chains – WSJ

There is a delicate balance going on here. China is still a predominantly export based economy with a nearly $1.0 trillion difference between exports and imports and is still highly reliant on the US ($577.1 billion) and the EU ($472.2 billion) as trading partners. These flows must continue to fund their global ambitions.

At the same time, energy and agriculturally rich Russia shares a border with China and the two countries recently announced the opening of a new bridge to symbolize their strengthening alliance.

They announced a “no limits” partnership in February of 2022 and China declined to condemn Russia’s actions in Ukraine while they criticized the Western sanctions on Moscow. In order to grow their economy, China (like the US) needs a low cost, reliable source of energy and Russian oil is a close and cheap supplier until the build out of the Chinese nuclear power program is completed and can substantially replace it.

Finally, since 2013, China has been revitalizing ancient overland trading routes connecting Europe and Asia. Built largely with Chinese expertise, the initiative is integral to China’s efforts to create more secure trade routes and to make participating nations dependent on the Chinese economy thereby building economic and political influence for China.

Should they succeed, China would certainly rival, if not surpass, the US as an economic superpower. While that alone is not cause for concern, we are sure that as part of their newfound influence, China would take aggressive actions to dethrone the US Dollar as the world’s reserve currency (for more on this, we recommend Ray Dalio’s book, The Changing World Order).

At a current level of $31 trillion, the US debt burden is high and, by most estimates, too high to ever be paid off. However, since the debt is denominated in US dollars, our Reserve Currency status allows us to simply “print” more money to service the debt. If the US dollar were to lose its reserve currency status, we would very quickly find ourselves in severe financial trouble.

On the other hand, if their plan were to fail, a potential Chinese economic collapse could reverberate across the globe. The impact would vary with the rest of the world’s reliance on China for critical goods and services. During the pandemic it became apparent just how many prescription drugs, medical devices, and other vital supplies had been outsourced to China or other countries dependent on China for inputs. While there has been a lot of talk about reducing our dependency, we have seen little in the way of concrete actions by companies to onshore production.

Neither of these scenarios are good, but neither are they inevitable. China has a lot of problems, many of which are not in its control, so it might be forced to “optimize” its ambitions, much the way it did with its COVID-Zero policy.

Conclusion

In his latest memo, Oaktree Capital founder, Howard Marks, another successful investor we follow, stated that he believes we are in the midst of a “sea change” in the investment world, the third in his career. You can read the memo in its entirety but, in essence, he believes that the main driver of investment returns over the last 40 years was the massive drop in interest rates which started in the early 1980’s.

Furthermore, after a series of fits and starts, we have made the turn from a low-interest rate environment to a higher-interest rate environment where investors will once again be able to make reasonable returns with bond investments. Lenders and “bargain hunters” will have much better prospects going forward than they did from 2009-2021 and many of the hot investment strategies that worked so well the last ten years may not be the ones that outperform in the years ahead.

While we don’t disagree with Mr. Marks about the current environment, we have a lot less faith in the commitment of our institutions influencing that environment. We have seen how suddenly things can change when someone like Powell becomes the Fed Chairman and replaces someone who had no desire to raise interest rates. We have seen how fast the environment can change after an election. We know that there are long term trends in place such as energy demand, demographics, medicine/health, and war, and acknowledge that these trends can have major influences on the short-term investment environment. To our minds, the only thing that has lasted throughout our careers is change.

Therefore, we spend our time and money on research and doing our homework to find stocks to buy that will best fit our strategies. When those stocks are trading below their fundamental value as often happens in a bear market, we try to buy more of them.

This is how many of the legendary investors became legends. By realizing that they have no control over short-term stock prices, inflation, interest rates or geopolitical conflict, they focused on buying companies that can survive and even thrive whatever the current environment may be.

Read More

In Good Company

Not Even Legends Escape a Bear Market.

A recent search of Investment Legends took us to an Investopedia post titled “The World’s Greatest Investors” which listed 11 investment legends including Benjamin Graham, Fidelity Magellan Fund manager, Peter Lynch, and Vanguard founder John Bogle.

Of the 11, only one mentioned today is active in the market in a measurable way, that being Berkshire Hathaway Chairman, Warren Buffett. According to the website Buffett Online, Buffett’s personal portfolio consists of his approximate 16% stake in Berkshire Hathaway (229,016 shares) and shareholdings in two banks – JP Morgan and Wells Fargo (the size of those stakes is not known).

Since the beginning of the year, Buffett has seen the value of his Berkshire stock go from a high of $539,180 per share on March, 28th to $419,100.80 as of October, 17th, a drop of approximately 22.27%.

The “Warren Buffett Portfolio”, which is made up of stocks of public companies which he owns via Berkshire Hathaway, is heavily concentrated with roughly 75% in just 5 holdings:

Apple (AAPL)

Bank of America (BAC)

Coca Cola (KO)

Chevron (CVX)

American Express (AXP)

As you can see from the charts, other than Chevron, the portfolio has also seen a substantial drop in value since the beginning of the year.

So, how is Buffett reacting to this drop in the value of his net worth? Is he panicking, selling his positions, and cursing his luck and putting his money in US Treasuries? Is he hoarding cash?

To the contrary, according to the website Stockcircle.com. Through Berkshire, Buffett has been putting his accumulated cash (see How One Investment Legend Manages the Trends) to work buying high-quality companies that have good margins, steady cash flows, and low valuations. These investments include an increase in shares of Apple (AAPL) by 0.4% and a $20 billion increase in Chevron among other purchases.

Fox Business reports that Berkshire has put more than $51 billion to work in the stock market this year, including buying up roughly $12 billion worth of Occidental Petroleum stock and completing a $11.6 billion acquisition of the Alleghany Corp. The deal is the billionaire’s largest since acquiring Precision Castparts for $37.2 billion in 2016. Additionally, Berkshire is reported to have announced that at the start of next year, it will more than double its stake in the Pilot chain of more than 800 truck stops across 44 states and six Canadian provinces.

This is what successful investors do. They are restrained, raising cash during strong uptrends and are not panicked by market corrections. Yes, the stock market has been volatile. And yes, there could be more downside in the short term.

Buffett, along with other successful investors, knows that bear markets can offer investors the best opportunity to accumulate sound investments, often at fire-sale prices (especially when the selling becomes indiscriminate as you often see near the end of a market correction).

While traders are being whip-sawed by market volatility driven by the day-to-day headlines, long-term investors use times like these to build long-term wealth by purchasing shares of profitable, well-managed firms that are selling at a discount to their true financial worth.

Read More

Third Quarter 2022 Market Review

A Confluence of Unfortunate Events

All three major indices ended the third quarter about where they started. Despite the stomach-churning volatility it took to get there, it took declines the last two days of the quarter to breach the lows we previously hit in June.

We have now experienced three technical bear markets in the last five years, which is a bit unusual according to the people at Hartford Funds who state that the average frequency since 1929 is 3.6 years:

While financial experts may argue, as they did in 1990 when a drop of 19.9% was not deemed to be an official bear market, that 2018 was not an official bear market because the lows were hit intraday instead of at the end of day close, anyone with money in the market knows that technicalities don’t matter when your account is down.

Not wishing to sound like a broken record, the main driver of market volatility is still the Federal Reserve and its response to the current economic climate. Below is a chart of the S&P 500 price movement (blue line) with change in the federal funds rate (orange bars) over the past year from macromicro.com

You’ll notice that the market started dropping in advance of the increase in the fed funds rate and that is because the yield on the 10-year Treasury Bond had already started moving up in December of 2021 as the Fed “pivoted” to a more hawkish stance. From U.S News:

“The central bank also signaled it could raise interest rates sooner than it had earlier forecast, with the possibility of three hikes during 2022. The “Powell pivot,” as it has been coined by economists, came after Chairman Jerome Powell was nominated for another term by President Joe Biden.”

While changes in the fed funds rate are limited to the scheduled Federal Reserve meetings, Treasury Bonds are traded on the open market. Investors hearing talk of rising rates will react to a change in policy by selling their bonds, which lowers prices and increases yields. The inverse relationship between stock prices and 10-year yields is illustrated in the chart below courtesy of alphacast.com:

We wish they would use more contrasting line colors! Nonetheless, the chart shows that as the 10-year yields (dark orange) began to increase, the S&P 500 Index (light orange) rolled over and hit lows corresponding to the highs in the yield in June and now in September.

With that in mind, it was no surprise that the latest blow to the market came on Wednesday the 21st following the Federal Reserve policy decision to raise interest rates by 75 basis points.

The 0.75% increase had been telegraphed for weeks and was likely priced in the market by the traders and trading algorithms. However, the market was not prepared for the change in the forecast that came out of the meeting. The Fed updated its economic projections and now call for a year-end median target rate of 4.6% which is a full 1.0% higher than June’s projections.

This change in the interest rate outlook spooked the markets. Up to this point, many investors believed that the Fed was near the end of its tightening. Earlier statements by Fed policymakers indicated target rates of 3.5% to 4% by the end of this year. Before September 21st, the Federal funds rate was 2.50%. The expected September increase of 0.75%, therefore, would bring the rate to within 0.25% to 0.75% of target. So, prior to this change in expectations, the markets were pricing in probable increases of 0.50% in November and 0.25% in December with at least a pause in further increases heading into next year.

The new year-end target rate now implies a likely and unprecedented fourth 0.75% increase in November followed by another 0.5% hike in December assuming that the Fed doesn’t change its mind again.

There are two things that rattle the markets: uncertainty and surprises. The Fed’s surprise comments caused the market to recalibrate the impact of higher projected rates and begin considering the risk that the Dot Plot may change again in November.

Adding to the uncertainty is the pace of the rate hikes. In an article from Bankrate, looking at Fed funds rates since the 1980s, increases of 0.75% or even 0.5% have been extremely rare with 0.25% being the overwhelming norm through four decades. As seen in the table below, the current pace of rate hikes is truly aggressive by recent standards.

According to several economic studies, it takes about six to nine months for a Fed Funds rate hike to work its way through the economy. Assuming that to be true, the impact of the March rate hike is only now beginning to be felt.

In other words, it will be another six to nine months until we see the cumulative economic impact of the last five rate hikes. As the Fed has a reputation of being wrong more often than it’s right, there is a high risk that it overshoots and pushes the U.S. economy into a deeper recession than anticipated. All this contributed to a sudden and violent sell-off sending 10-Year yields close to 4% and taking the S&P 500 back down to its June low.

Until the risk of more surprises subsides, the market will likely remain volatile and highly responsive to any changes in rates.

Taking a little longer perspective, you can see that the uptrend in 2021 was really a case of the market going too far, too fast and only now coming back to the longer term trendline which started at the end of the 2007-2009 bear market.

This is similar to the 2000 – 2002 bear market during which prices fell back to the longer term trendline starting from the 1987 bear market low.

Many pundits refer to these events as the “popping” of market bubbles and, to some degree, that is a fair description. In the case of the mid to late 1990s, 401K plans were becoming more broadly accepted and a good portion of that money went into the stock markets. That, combined with the advent of online trading and the surge of investors buying into any internet related company (the “dotcom” mania) produced an unsustainable trend. Warren Buffett described the phenomenon this way during a speech in September, 1999:

“The fact is that markets behave in ways, sometimes for a very long stretch, that are not linked to value. Sooner or later, though, value counts.”

More recently, huge sums were driven into the stock market due to the combination of stimulus money from the government’s response to Covid, a zero/low interest rate environment, and a fixation on technology related growth stocks.

In each case, investor fear of missing out (“FOMO”) on stock market riches is a powerful emotion when the markets are rising and is equaled only by the fear of losing everything when markets tumble. Unfortunately, too many people have short memories and let their emotions get the better of them, especially during rapidly moving markets.

Somewhat tongue in cheek, we refer to our “looking forward “portion of the letter as “Things Keeping Us Awake”. Unfortunately, we have recently found ourselves waking around 2:00 AM unable to fall back asleep as our brains start relentlessly processing all the news and events from the previous day.

Nuclear War

It is rumored that Barack Obama once referred to Russia as a “gas station with nuclear weapons”. While we couldn’t find the direct attribution, it does appear that several politicians and dignitaries have made similar comments. Unfortunately, the “gas station” owner is once again threatening to use those nuclear weapons.

It is hard to get a true read on how the war in Ukraine is going, but what is certain is that nothing has gone as Putin planned since the invasion started last February. Like many dictators, Putin has shown no regard for human life as shown through his actions both at home and abroad and he has sole discretion as to the use of his arsenal.

We don’t know where the line is or when it could get crossed, we just know that any time you have desperate people in power, they are often willing to go much further than expected by reasonable people. Putin has amply demonstrated this by his actions this year.

Should we get word of any kind of a nuclear attack, no matter how small, the market will experience a flash crash as the computers go into sell mode in microseconds following any alert. There is little that can be done in a cost-effective way to hedge against nuclear lunacy.

Complex option strategies are expensive and difficult to manage and moving all of your holdings to gold and treasuries until this conflict is resolved leaves you with a large potential opportunity cost if nothing of the sort occurs. We’re not predicting a global war, but perhaps it is at least somewhat reassuring to look at a bit of stock market history.

The Federal Reserve

We’re going to spend more time on this than any other topic this quarter because, right now, the Fed has more influence on short term market moves than anything else. As noted earlier, the Federal Reserve is going to raise interest rates until inflation is under control, even it tanks the economy, period.

There are three things that need to be understood regarding the Fed Governors:

First, they are economists who look at data and seem to believe that by turning certain knobs and levers, they can make changes to the economy to keep it running according to their own ideal. What is lost on everyone is that a degreed economist holds an Arts degree, not a Science degree, and even scientists have problems controlling complex systems.

Second, the Governors are political appointees and, like most politicians, will manipulate the data in a way as to put them in the best light.

Third, they are insulated. Since we first started paying attention to the economy (about the time we were looking for that first job out of college), we have yet to see a Federal Reserve Governor face a layoff because of economic conditions. When they do leave their positions, they quickly move to positions within the same community. Some, like former Fed Chair Janet Yellen, come out of academia while the current Chair, Jerome Powell, came out of a Wall Street investment bank. Almost all of them have Ivy League Degrees and none wind up unemployed let alone broke.

What this means is that Fed policy, which greatly impacts the lives of millions of Americans, is being set by people with a very narrow understanding of how things work in the real world but a very deep view of how they think things work. As such, when faced with rising prices, they don’t look at what might be causing the rise in prices but only look at what they can do to slow down (not reverse) the rise as quickly as they can.

The one tool the Fed has for fighting inflation is raising the Fed Funds rate, which impacts other interest rates. One aspect of raising rates is that it tends to increase the strength of the dollar, which increases U.S. buying power for goods produced elsewhere. However, as we have said over and over, we are not experiencing higher costs because of a weak dollar, in fact, the dollar index is nearing highs not seen in 20 years.

If it is dollar weakness causing inflation, inflation would have been higher in 2008 than it is now. Of course, that’s not the case. We are experiencing high costs because of a lack of supply. This is true particularly of energy, which impacts nearly every area of the economy, and food, which is not only impacted by energy costs but also by market distortions caused by the war in Ukraine.

Despite the rhetoric, we are still not producing the amount of oil that we were pre-COVID.

To our surprise, Chairman Powell has made comments about the higher prices being driven by a lack of energy supply, supply chain issues with China, and the Ukraine war, all of which are outside of his control. However, instead of demanding better government responses to these challenges, the chairman has embarked on a crusade to do the only thing he can to combat inflation, which is to raise interest rates.

In other words, if he can’t do anything to stimulate more supply, he will bring demand in line with the limited supply by decreasing demand. With interest rates as his only tool, the only way he can kill demand is by forcing the economy into recession.

There is a calculated method to this madness. First, rising rates impact borrowing costs which include mortgage interest rates. The national average for a 30-year fixed rate mortgage is now sitting around 6.7% compared to 3.0% a year ago, raising the monthly principal payment for an existing home priced at the U.S. median of $410,000 by just over 53%.

As mortgage payments become less affordable, home prices should begin to stall and possibly drop. Housing makes up 32.9% of the Fed’s preferred inflation measure, the PCE (Personal Consumption Expenditures) Index, and 42.4% of the more widely followed Consumer Price Index.

A slowdown, or even reversal in home prices, will have a large impact on the data the Fed uses to gauge U.S. inflation.

Second, Powell and company also raised the estimate for 2023’s unemployment rate to 4.4% from June’s 3.9%.

This is based on the nonsensical measure of unemployment that they use. Even though the civilian labor force participation rate has climbed a bit, is still below the historically low pre-COVID levels.

Since the peak in January 2000, the national LFP rate has fallen gradually from 67 percent to 63 percent in January 2020. Both male and female LFP fell between 2000 and 2020, with female LFP falling 2.3 percentage points during that period and male LFP falling 5.8 percentage points. And then there was COVID-19.

The pandemic brought numerous shocks to the labor market, including a significant shock to LFP. After a low of 60 percent in April 2020, early in the lockdown period, the LFP rate has recovered slightly to 62.3 percent as of September.

Demographic shifts explain part of the longer-term decline over the past decades. The retirement of the baby boomer generation—which is expected to be fully retired by 2030—is responsible for roughly half of the pre-pandemic labor force decline. And the pandemic appears to have caused some baby boomers to retire earlier than planned, as roughly 1.75 million baby boomers retired in 2021 versus the typical 1 million per year.

But the decline in labor force participation isn’t just older Americans hanging up their work hats a few years early.

The labor force participation rate for America’s core workforce of individuals ages 25 through 54 has declined 2.2 percentage points since 2000. That translates into 2.7 million fewer workers, and 1 million of that loss occurred just over the past two years, during the pandemic.

This is a concern because, people working is what drives output and fuels innovation. It’s only through work that basic necessities such as food and housing are available and that innovations such as automobiles and smartphones that make our lives easier and more mobile are possible.

Work is also essential to support essential government services, such as national defense and a justice system.

We are already beginning to see employment worsen in the more credit-dependent tech sector where, according to an article by Crunchbase.com:

“…as of late-September, more than 42,000 workers in the U.S. tech sector have been laid off in mass job cuts so far in 2022…”

So, increasing the amount of people out of work will, over the long run, stall the economic recovery. The assumption the Fed is making is that a drop in home prices and more people on unemployment will weigh on economic output. The Fed lowered its 2022 economic growth forecast from 1.7% to 0.2% and their projection for 2023 from 1.7% to 1.2%.

Third, and probably most important, remember that the inflation rate is the percentage increase or decrease in prices over a specified period, most commonly year over year. Inflation surged to a new pandemic-era peak in June, with US consumer prices jumping by 9.1% year-over-year. The probability of prices moderating between now and next June are extremely high as the price of even energy and food commodities are beginning to approach 2021 levels:

So, the Fed doesn’t need prices to “come down” to declare victory, they only need the increases to be around 2% from the year prior. Therefore, beginning in March of 2023, we should see year over year inflation increases begin to approach that level. As was commonly heard in the 1920s, “the fix is in”.

Our take is that Powell is using “inflation” as an excuse to do what he has wanted to do since taking over the Fed, and what should have been done coming out of the 2008 housing crisis. That’s getting interest rates back up to where they were prior to the housing crisis which led the Fed to implement its zero-interest rate policy (“ZIRP”) and quantitative easing (“QE”) to save the banking system and prop up the stock market.

This will give the Fed more room to work in the next financial downturn (even if they cause it), without flirting with zero or even negative interest rates as we’ve seen elsewhere in the world.

Federal Funds Rate – 62 Year Historical Chart

Our main concern is how much damage is going to be done to the economy between now and then. The yield curve, which has predicted the last seven recessions, is inverted at this time and although it’s looking much better than it did in the past week, it is still signaling a recession with the 10-year rate below the 2-year rate.

As we saw in 2020, 2021 and again in 2022, our federal government is all too happy to pass massive stimulus bills before, during and even after recessions. So, if it stays true to form, we could see yet another massive spending bill if the Fed pushes us into a deep and prolonged recession with its policies. If so, a new boom-bust cycle would be the likely outcome.

In the meantime, volatility will remain elevated with every data point associated with housing, employment, and consumer prices impacting daily trading.

A Suisse Lehman Moment

There is panic growing around Credit Suisse as its share price has dropped this year by 55% after the bank suffered over $5 billion in losses on complex derivative deals with the family office hedge fund Archegos Capital Management. From ABC News: “Archegos went belly up in March of last year. Credit Suisse’s reputation took another hit from its involvement in the Greensill Capital scandal.”

According to the Financial Times, “The two issues that appear of most concern to investors, are the bank’s capital position, which reflects its ability to absorb losses, and its liquidity levels, which would be put to the test in periods of short-term stress. The bank insists that neither presents a risk.”

Looking back at history, those were the top two concerns about Lehman Brothers in September of 2008, and which led up to its ultimate collapse. Lehman’s failure kicked off a nasty sell-off and resulted in the infamous “bailout” of “too big to fail” banks.

“Credit Suisse is a global, systemically significant, “too-big-to-fail bank” that operates in the U.S. and is deeply interconnected throughout the global financial system,” warns Dennis Kelleher of watchdog group Better Markets.

“Its failure would have widespread and largely unknown repercussions from the inconvenient to the possibly catastrophic.”

We pray that the financial system has learned lessons from the 2008 financial crisis and that mistakes from then won’t be repeated now. But unfortunately, we won’t know until it’s too late and right now the bond market is not signaling a high degree of confidence.

The Collapse of EU Economic Growth

The European Union was formally established in 1993 and started out as a seemingly harmless organization stressing economic efficiency, trade, and a common currency. Even though the seven decision-making institutions located in Brussels were limited by the original treaties to powers expressly conferred to them by the member states (now numbering 27), over time they have managed to expand their power and influence (including on energy policy), often to the detriment of individual members.

Many economists who are outside of E.U. influence have considered it to be an economic basket case even though, collectively, it represents about $17 trillion in GDP and a close third to the U.S. and China in its contribution to the world economy.

Sanctions against Russia have exposed the most acute problems of Europe which is rapidly losing its economic power. In an article written in Oriental Review:

“In Britain 60% of enterprises are on the verge of closing due to higher electricity prices. This is reported by the analytical group Make UK, representing the interests of British industry. 13% of British factories have reduced working hours and 7% are temporarily closing down. Electricity bills have risen by more than 100% compared to last year.

In Germany, according to the Leibniz Institute for Economic Research, the number of firms and individuals that went bankrupt in August alone rose 26% compared to the same period last year. The figure was significantly higher than German analysts had forecast. According to experts, during the autumn the number of bankruptcies will only increase. This is connected with the increase of the cost of production processes, in particular with the rise in prices for energy.

Most countries in Europe are in a similar situation. But the authorities are sacrificing the quality of people’s lives in order to continue to exert pressure on Russia.”

During the last decade, Germany alone spent nearly $500 billion on wind and solar power according to Justin Huhn of Uranium Insider, while shutting down nuclear power plants in response to the 2011 Fukushima nuclear accident. Unfortunately, wind and solar are both intermittent generators of energy requiring ongoing generation of energy from coal and natural gas, which was primarily purchased from Russia.

Now in a report issued September 26th by the Organization for Economic Cooperation and Development (OECD):

“More countries could dip into recession if efforts to diversify natural gas sourcing fall short of what is needed to fuel businesses and heat homes through the winter, according to the report. A cold winter could further drain Europe’s natural gas storage facilities, which have reached between 80% and 90% capacity as of Monday.”

In her annual state of the European Union speech this month, European Commission President Ursula von der Leyen called for energy rationing, and actually used the now infamous phrase “flatten the curve” when speaking about avoiding peak energy demands.

If E.U. citizens, particularly in Germany, the largest single economy in the E.U., are forced to ration energy for an extended period of time, it is likely that a recession could be both prolonged and quite severe, which leads us to our final big concern.

China

It would be one thing for the U.S. to tilt into a recession while the rest of the world remained stable, however, as we noted above, much of the world is in far worse shape. This is not good for China as their economy is still heavily dependent on exporting goods and services to the rest of the world, particularly the U.S. and the E.U.

A significant drop in export activity due to a global recession will have a major impact on a Chinese economy still reeling from a real estate crisis that is yet unresolved.

Several banks have started to cut China’s full-year economic growth forecasts as recent July data pointed toward a significant slowdown. China’s 2022 economic growth outlook was lowered from 3.3% to 2.8% by brokerage firm Nomura, citing additional COVID-19 lockdowns and despite increasing government spending in an effort to stimulate domestic growth.

While it is hard to obtain verifiable data as to the true state of the Chinese economy, we do see daily headlines that indicate to us that things are not following the “Chinese Miracle” narrative.

Why does this keep us up at night? It is because China is being run by Chairman Xi Jinping who is seeking to become the third “President for Life” since the revolution led by Chairman Mao. He certainly wants nothing to get in the way of that, so if economic conditions worsen to the point that his leadership is threatened, he, like Putin, may resort to aggression to stimulate the economy and distract the populace, perhaps just long enough to achieve his consolidation of power. The obvious move would be to invade Taiwan.

With billions of unfunded spending now being directed to the war in Ukraine, the world can ill-afford another armed conflict in the South China Sea.

Conclusion

The future course of the market is quite murky at the moment. But, as we pointed out at the open, despite recent declines, if you started at the beginning of 2018 and simply held a passive ETF that tracks one of the major stock market indices, your portfolio would still show gains for the period.

Bear markets can be painful, but overall, markets produce positive returns a majority of the time. Again, according to Hartford, of the last 92 years of market history, bear markets have comprised only about 20.6 of those years. Put another way, stocks have been on the rise 78% of the time and are still the best tool for growing individual wealth. Unlike 2021, where the rising tide lifted all boats, it’s probably a stock-pickers’ market for the foreseeable future. Solid balance sheets, strong cash flows, and prudent governance are likely to separate the winning companies from losing companies in a high interest rate / low growth environment.

Read More

How One Investment Legend Manages the Trends

In 1999, Warren Buffett gave a presentation at Allen & Co.’s Sun Valley, Idaho bash for business leaders which started with:

“At Berkshire, we focus almost exclusively on the valuations of individual companies, looking only to a very limited extent at the valuation of the overall market. Even then, valuing the market has nothing to do with where it’s going to go next week or next month or next year, a line of thought we never get into. The fact is that markets behave in ways, sometimes for a very long stretch, that are not linked to value. Sooner or later, though, value counts.”

At the heart of this presentation was Buffett’s frustration that there were no bargains that he could either invest in or purchase outright because investors had bid up the prices of stocks so high that they far exceeded projected earnings.

Buffett predicted the market would not “come close” to the 12.9% next-20-year annual return expectation of professional money managers polled at that time. This presentation was met with derision by many of the attendees of the conference, some of whom were newly minted dotcom millionaires.

However, Buffett’s prediction proved accurate. In fact, not only was the 12.9% expectation missed, but the total return for Berkshire Hathaway for those next 20 years exceeded the S&P 500 by nearly 200%.

Because of his zealous determination to only buy stocks that he considers a bargain, Buffett often finds himself sitting on a large amount of cash just when the market is falling, and the bargains begin to appear. In fact, according to an article by ValueSpreadsheet.com, by the market correction of 2018, Buffett had $108 billion in cash and, while making no major acquisitions, he did purchase $43 billion in public securities, primarily Apple. By 2020, having grown his cash supply to $137 billion, Buffett made his biggest acquisition since 2016, purchasing Dominion Energy’s natural gas storage and transmission business for $10 billion.

Berkshire Hathaway Cash Position versus the S&P 500

Contrast this with the average investor who, because of the fear of missing out, tends to “put their money to work” in up trending markets and ends up selling those same securities on the way back down, either to protect their account balances or to raise cash.

Since the 1990’s, with the explosion of self-directed retirement plans such as the 401K along with the technological advances in online trading, the market has become increasingly more volatile with wild swings in both directions.

S&P 500 Weekly Trendlines 1995 – 2022

And while the overall trend is still up, your individual returns can be severely impacted by the timing of your investments. By resisting the “urge to splurge” and accumulating cash during the uptrends, you can create the potential for a substantial “shopping spree” when the market corrects from its excesses, as it most surely will.

Read More

Why Isn’t Gold Rising with Inflation?

A day does not go by now without at least one article about inflation hitting the headlines. The June Consumer Price Index soared to 9.1% year over year.

But for many people who bought classic inflation hedges like gold, or even those who bought modern, and should we say theoretical, inflation hedges like bitcoin, their investments have either gone nowhere or even down.

So, what is going on? After all, we hear nonstop that gold is the ultimate inflation hedge, has it suddenly failed, like so many other investment truisms?

The explanation lies in the art of economics and how the various definitions of economic terms have evolved over time.

As we explained in our Q2, 2021 Client Letter:

“Price increases are the consequence of inflation. They are not inflation itself.”

In classical economic terms, inflation occurs when the real purchasing power of a currency declines. This historically happens when a country increases the supply of its currency in a short period of time. We have seen this famously in countries like Argentina and Zimbabwe with stories of citizens carrying wheelbarrows full of money just to buy bread and milk.

Now, there is no question that the U.S. government has created enormous amount of money in response to the COVID pandemic.

However, for all that money printing to have an inflationary effect, it requires the velocity (or turnover) of that money to increase. Meaning that once the money gets printed, it needs to be spent so that it flows through the economy. For quite a while, including right now, that hasn’t been happening.

From the Federal Reserve Bank of St. Louis:

The velocity of money is the frequency at which one unit of currency is used to purchase domestically- produced goods and services within a given time period. In other words, it is the number of times one dollar is spent to buy goods and services per unit of time. If the velocity of money is increasing, then more transactions are occurring between individuals in an economy.

The frequency of currency exchange can be used to determine the velocity of a given component of the money supply, providing some insight into whether consumers and businesses are saving or spending their money.

Moreover, the US Dollar has actually increased in value even with the extraordinary increase of money in circulation. This includes its value relative to gold and any other commodity traded on the futures market.

So, we are seeing higher costs, primarily caused by increases in energy and labor, making their way through the economy in the absence of a decrease in the value of the US dollar. In an environment like this, classic inflation hedges like gold, or modern inflation hedges such as Bitcoin will not protect your portfolio from higher consumer prices.

Read More

Second Quarter 2022 Market Review

Will History Repeat?

Inflation is raging through the economy. The U.S. recently botched the withdrawal from an agonizingly long and unpopular war and was embarrassed by images from the final days of retreat. Gasoline prices are skyrocketing, causing people to adjust their budgets just to be able to get to work. The Russians have invaded a peaceful neighbor. Europe is economically weakened and gasping for energy. Our president is perceived as weak and ineffective by other foreign leaders. The world is threatened by a pandemic originating from an accident at a biological lab and Trudeau is the prime minister of Canada.

These are not headlines from today, these are events from the end of the 1970s.

The 1970s started with oil trading just over $1 per barrel. By 1980 Americans had been evacuated from the roof of the U.S. embassy in Vietnam in helicopters, Russia had invaded Afghanistan, there had been a failed rescue attempt of U.S. citizens being held hostage at the U.S. embassy in Iran, and the price of oil had risen to over $36 per barrel, sending shockwaves through the economy and leading to the infamous gas lines.

Human H1N1 influenza virus reappeared in 1977 in the Soviet Union and China. Virologists, using serologic and early genetic tests, soon began to suggest the cause of the reappearance was a laboratory escape of a 1949-50 virus, and as genomic techniques advanced, it became clear that this was true.

There is a long-standing argument about whether or not history repeats itself, but to us this does feel like a “Back to the Future” moment in time.

The stock market, as measured by the S&P 500, which in those days, nobody other than professional money managers paid attention to, finished the decade slightly higher than it started.

S&P 500 Price Chart 1970 – 1980

But in 1980, the market started to rebound. Ending the decade at all-time highs.

S&P 500 Price Chart 1980 – 1990

Again, at the turn of the century, we saw the crash of the dot com bubble, 9/11, U.S. entry into two unpopular wars, the housing market-driven financial crisis and, of course, SARS. We ended the decade with the famous “market of no returns.”

S&P 500 Price Chart 2000 – 2010

Only to see another rebound to new all-time highs well before the next decade would end

S&P 500 Price Chart 2010 – 2020

In each of these run-ups, we saw different catalysts driving money into the markets. During the 1980’s we had the tail end of the “Baby Boom” generation enter the job market, along with the largest federal tax cut since the 1960’s.

In the decade between 2010 and 2020, we saw the rise of technology, not only of the Silicon-Valley type, but also new energy extraction technology which, during the last half of the decade, lowered the price of oil below $80 per barrel and positively impacted prices and corporate profits.

The last of the “Baby Boomers” reached their peak earning years. 401(k) plans became the primary vehicle of the American corporate retirement system with assets totaling $6.25 Trillion according to the Investment Company Institute with another $10.95 Trillion held in individual IRAs.


The one thing that has been consistent through these boom-and-bust cycles is the Federal Reserve and its ability to dictate interest rates throughout the economy.

Federal Funds Rate vs. S&P 500

Looking at our current environment, the market, as measured by the S&P 500, finished the first half of the year with the worst 6-month performance since 1970 while the NASDAQ posted its worst opening 6-month performance ever.

The key driver behind this sell off was the rapid rise in the Federal Funds Rate– driven by accelerating inflation, which in turn was primarily driven by a doubling in energy costs coupled with continued supply chain disruptions both domestically and abroad.

S&P 500 Index vs Federal Funds Rate 1/2022 – 6/2022

Referring to the previous graph showing the historic Federal Funds rate versus the S&P 500, you will see several shaded columns which represent economic downturns, or recessions that have occurred since 1980. Each of these periods is preceded by a “spike” in interest rates. Recessions can cut into corporate earnings meaning that stock prices need to be “adjusted” downward to reflect those lower earnings. This is what Wall Street is looking at and, as financial writer Scott Garlis likes to say, “…when those institutional investors are uncertain, they tend to sell first and ask questions later.”

So, despite the noise and daily headlines, the Federal Reserve is still front and center when it comes to market performance, so that’s where we will begin.

The Federal Reserve

At their June meeting, the Fed raised short-term interest rates by three-quarters of a percentage point — something it hasn’t done since 1994 and maintained a hawkish tone regarding their commitment to “fight inflation.”

Their most recent Dot Plot projects continued increases to 3.4% by the year-end and rates rising further to 3.8% by the end of 2023.

Right after the announcement, the market seemed to stage a “relief rally” but gave it all back the very next day plus an additional 100 points.

In subsequent public events, Federal Reserve Chair Jerome Powell continued to reaffirm that the central bank’s main goal is bringing down inflation which is running at its fastest rate in over 40 years, suggesting that curbing inflation will take priority over fully preserving economic activity.

“Is there a risk we would go too far? Certainly there’s a risk,” Powell said at the European Central Bank’s annual economic policy roundtable conference in Portugal. “The bigger mistake to make — let’s put it that way — would be to fail to restore price stability.” Typically, when central bankers have raised interest rates throughout modern economic-manipulation history, they’ve done it to cool a strong economy and prevent inflation from getting too high.

Today, higher interest rate policies are being put into place when we already have high inflation, and when economic growth was already likely to slow compared to last year. This is what we saw in the 1970s.

So, if the Fed is raising rates to “beat inflation,” higher rates will not work as intended because supply of many critical commodities is being constrained (some deliberately) and demand is inelastic. Higher interest rates may destroy discretionary demand, but not demand for necessities that may keep getting more expensive like energy, food, or water. As investors, we must focus on data. Whether it is looking at deteriorating fundamentals of a company that we like, or macro-economic data, we have to collect as much information as we can and develop forward-looking opinions based on the information available. In the case of our current situation, low cost, reliable energy is necessary for a modern economy to thrive.

As of March 2022, the U.S. is still producing 1.0 million barrels of oil less per day than pre-pandemic.

We continue to believe, that unless it can figure out how to drill for oil, the Fed will fail in their mission to “tame inflation” and bring the economy in for a “soft landing.” Powell has even recently gone as far as to admit this, saying during his opening statement to the US House Committee on Financial Services June 23rd that the Fed cannot control the price of oil or most food articles.

What this means is, the Fed will raise interest rates to slow inflation growth for the items it can control, specifically: housing, labor, and business borrowing. The only way the Fed can succeed in defeating inflation is to raise rates high enough to kill off demand in the housing and labor markets. Higher rates will also increase costs for private businesses (many of them smaller businesses). In turn, this will depress profits which can lead to a reduction in capital spending. Reduced capital spending negatively impacts future growth. While none of us here at Summit are degreed economists, nevertheless, it sounds to us as though a recession may well be in the Fed’s plan.

So, the question we ask today is, ”How bad will things get before Powell blinks?” His predecessor is now serving in the administration as the Secretary of the Treasury and, while the Federal Reserve is supposed to be independent and above politics, we all know that it is a small club. The University of Michigan consumer sentiment was downwardly revised to a record low of 50.0 in June of 2022, from a preliminary reading of 50.2. So, it may not be long before we find out how committed he is. Many pundits are already hinting that the Fed could “pivot” away from higher rates in September ahead of the midterm elections.

The Economy

This letter is being written before the release of Q2 economic numbers, but we expect that when they do come out, they will show that the economy has technically entered into a recession, which is traditionally defined as two consecutive quarters of declining economic output as measured by GDP.

We won’t bore you again about why GDP is a terrible measure for economic health because the economists running the Federal Reserve don’t care what we think and, more importantly, the institutional investors and traders don’t care what we think. Markets move in anticipation as well as revelation of these numbers, no matter how much those numbers may be manipulated.

As noted above, The University of Michigan consumer sentiment was downwardly revised to a record low of 50.0 in June of 2022, from a preliminary reading of 50.2.

From the latest report:

“The current economic conditions subindex sank to an all-time low of 53.8 (vs. 63.3 in May), and the expectations gauge plunged to 47.5. About 79% of consumers expected bad times in the year ahead for business conditions, the highest since 2009. Inflation expectations for the year ahead stood at 5.4%, little changed from a preliminary reading or the preceding four months. Meanwhile, the 5-year inflation outlook rose slightly to 3.1% from 3% in the previous month but decreased from its mid-month reading of 3.3%.“

The Index of Consumer Expectations focuses on three areas: how consumers view prospects for their own financial situation, how they view prospects for the general economy over the near term, and their view of prospects for the economy over the long term.

These readings don’t bode well for the economy as when sentiment is low, people are more inclined to “hunker down” until they feel like conditions are improving. In this way, consumer sentiment can be self-fulfilling as fear of recession lowers confidence, which impacts consumer spending, which can lead to recession.

The Bureau of Economic Analysis’ Personal Consumption Expenditures (PCE), the U.S. Federal Reserve’s preferred inflation gauge, jumped by 6.3% year-over-year in its latest figure for May. This was in line with April’s number and lower than March’s 6.6%.

Excluding food and fuel, the reading showed an increase of 4.7% compared with the prior 4.9%. On a monthly basis, the core measure gained 0.3% versus the previous month as well.

The data could be a signal that while the total figure grew on an annual basis, price increases may be moderating. But while there are some positive indications in the report, other factors remain a concern.

In May, the Consumer Price Index for All Urban Consumers rose 1.0 percent, seasonally adjusted, and rose 8.6 percent over the last 12 months, not seasonally adjusted. This is a different measure of inflation from the PCE discussed above. The index for all items less food and energy increased 0.6 percent in May (SA), up 6.0 percent over the year (NSA).

It is interesting to note that the Bureau of Labor Statistics changed the computation of the CPI in the 1980s (and again in the 1990s). If the 1980s methodology were still being used, reported inflation would be much higher.

No matter which measure is used, it’s clear that the U.S. has problems with rising costs.

Labor

One thing that has baffled us is the disconnect between job openings, the unemployment rate, and labor force participation. Labor force participation remains stubbornly low.

Emergency unemployment benefits put in place for the Covid lockdowns expired nationwide in September 2021. At that time, more than 12 million people were receiving some form of unemployment aid. Most were supposed to be cut off entirely while the rest would see their benefits reduced by $300 per week. In theory, this should have driven people back into the workforce.

However, with the justification of an ongoing national emergency, the federal government, in August 2021, announced a 25% increase in funding for the Supplemental Nutrition Assistance Program (SNAP) and suspended work search requirements for able-bodied adults without dependents enrolled in the program. While these programs are certainly necessary for people who are not able to support themselves financially, it also discourages potential jobseekers from obtaining the kind of employment that allows them to develop important skills, build self-esteem, and provide for their families. When businesses are struggling to hire employees, higher wages and benefits can only do so much — especially when they are competing with government programs.

For example, Michigan residents on unemployment are only obligated to conduct one job-seeking activity per week to receive unemployment insurance (UI) benefits for up to 20 weeks. The state’s unemployment rate stands at 4.3%. Compare this to Utah, which requires a person to submit four job-seeking activities per week. Utah’s unemployment rate stands at 2.0 percent.

However, as noted above, instead of the Administration addressing the supply side of the equation by encouraging people to seek employment through fiscal policy, we have the Fed trying to kill the demand side using monetary policy. Sadly, this may already be starting to work as indicated by the 4-Week Moving average of Initial Jobless claims.

The other indicator that we continue to keep an eye on is the Job Openings and Labor Turnover Survey (JOLTS). As of April 2022, the number of job openings decreased 7% through a combination of hiring and hiring freezes. Figures for May 2022 will not come out until after this letter is published, but we continue to look at the combination of labor force participation, jobless claims, and job openings for clues as to the state of the economy.

Something that has recently appeared on our radar is the increasing use of personal credit. In both California and Wisconsin, we see people out shopping and eating in restaurants like they did before the pandemic, even in the face of rising prices. So, it makes us wonder if their personal incomes have risen to keep pace with those higher costs or if they are still stubbornly refusing to cut back in their spending habits in the hope that high prices really are “transitory” and will eventually come down or that their income will eventually catch-up.

Note that payment giant Visa’s most recent 8-K filing showed users are expanding their use of credit.

While revised first-quarter economic output numbers show disposable income has been shrinking over the past year.

These figures point to shrinking spending power for American households. As more people use credit to extend their paychecks, they’ll have to spend more on servicing those debt loads, and their disposable income will shrink further.

Expanding credit usage, higher interest rates, and shrinking disposable income could weigh on economic growth.

Rising interest rates and dwindling consumer buying power means Wall Street analysts may need to reduce their expectations for economic growth and corporate earnings in many sectors.

Geo-Political

It astounds us how fast the current news cycles move on to the next shiny object. Last quarter, the Russia – Ukraine war dominated the news. Now, you must deliberately search for news and information about it unless you have one of the 24/7 news channels going on in your home or office (which we do not advise).

The war continues to slog on, leaving death and destruction in its wake, while disrupting global energy resources and now threatening food scarcity. Vital grain exports have been halted and fertilizer supplies, a major Russian export, are at risk for farmers in the European Union, South America and Africa. Fertilizer prices for US farmers are also rising as a result. These war-driven disruptions drive up the cost of living and will eventually impact the economy.

What is not getting a lot of attention is what is happening in China beyond its Covid lockdown policies and seemingly weekly military operations threatening Taiwan.

However, for months now, our newswire feeds have continued to mention efforts by the Chinese government to support domestic economic growth and financial system stability. Because of a lack of transparency, it is difficult to know whether these problems are short-term blips caused by their continued zero-Covid policies which have shut down large swaths of their economy for weeks at a time, or if there are deeper economic fissures forming. We wrote extensively about China in our Q4 2021 Market Update, so we won’t rehash our thesis here. But we note these signs occurring on a somewhat regular basis lately and it is a reason to keep an eye on the situation.

Throwing BRICS at the West

One thing that we have not heard about in several years are the BRICS (Brazil, Russia, India, China and now, South Africa) and their emergence as an economic rival to the G7 (Canada, France, Germany, Italy, Japan, the United Kingdom and the United States). The original term, BRICs, came from a 2001 Goldman Sachs research report. The BRIC countries had ambitions to become for the emerging world what the G7 is for advanced nations. They held their first summit in 2012 but have faded from the headlines in recent years.

But in June they held a virtual Summit and presented an ambitious list of proposals for strengthening the group’s economic and political influence. An important attendee was Russian President Vladimir Putin who unveiled a plan for a new reserve currency based on a basket of member currencies. He also promoted the use of Russia’s financial messaging system as an alternative to the western-dominated SWIFT network that Russia was barred from in the wake of its invasion of Ukraine. China’s Vice Minister of Commerce, Wang Shouwen, suggested establishing a free-trade agreement among the five. Perhaps most significant was Chinese President Xi Jinping pushing for expansion of the group’s membership to include Iran and Argentina.

China and Russia would both like the BRICS to become the “anti-G7” to rally the emerging world in opposition to the ‘hegemonic’ West. However, India and South Africa appear to be playing both sides, perhaps to ensure that they’re ultimately on the “winning side,” as the world begins to divide over the Russia – Ukraine conflict.

While many economic commentators have been dismissive of these proposals and even the collective itself, these activities indicate that we are possibly on the verge of a geo-political shift which will impact the global economy, potentially for decades. Russia under Putin has now become a pariah to the West and we are not sure when Russia will get back into its good graces. Similarly, China has long been seeking greater global power and influence. Both countries are unhappy with the fact that the dollar is currently the world’s reserve currency and would love to see it replaced with another, if for no other reason than to avoid financial sanctions as each country pursues their own ambitions. A great read that touches on a lot of these issues is “The Changing World Order” by hedge fund manager Ray Dalio.

Looking Forward

These days we fondly reminisce about the fall of the Berlin Wall, the eventual end of the Cold War, and how we hoped that these events would usher in a new period of global peace and prosperity. But those hopes were quickly dashed by the Gulf War, the 1997 Asian financial crisis, the 1998 Russian financial crisis, 9/11, the dot com crash, the housing bubble, etc., and today, we have to accept that there is no escaping an endless rhythm of good and bad. As a result, we will see cycles of great investment opportunity like the 80’s, 90’s and the 2010’s, and cycles of great investment disappointment like the 70’s and the 2000’s.

Now, this does not mean that you can’t make money as an investor, or even a trader during decades like the 70s or 2000s. I can personally attest that my parents dutifully invested a portion of my dad’s paycheck into shares of his employer, the Ford Motor Company and they also took advantage of the employee stock ownership program which allowed them to reinvest their dividends. Looking at data going back to 1972, Ford increased their dividend from $.0219 per share, to $.0406 by 1980, almost doubling the payout. While that payout may seem meager, don’t forget that according to the Bureau of Labor Statistics, $100 in 1972 would be $699 today.

Of course, there were many companies that increased dividends in the 1970s and many are still around today, while others have been acquired or merged out of existence. Below is a list of some companies that not only raised their dividends annually during the 1970s but have continued to do so for the last four decades:

  • Dover
  • Genuine Parts Company
  • Emerson Electric
  • 3M
  • J&J
  • Coca-Cola
  • Colgate Palmolive
  • Stanley Black & Decker
  • Proctor & Gamble
  • Hormel Foods

While many of these names are familiar, none of them are exciting and few are regularly talked about in the financial media other than a brief earnings mention.

Using a back-testing program we are able to simulate what $10,000 invested equally in these ten stocks in 2000 produced by December 2021 versus an S&P 500 ETF (SPY), assuming you reinvested your dividends and before management fees.


While hindsight is 20-20, one still wonders why this type of investing isn’t generally promoted. Perhaps the answer has to do with the fact that this type of buy and hold strategy doesn’t produce much profit for Wall Street. Nor would you see those funny commercials from E*Trade and Ameritrade. Nobody would buy those books that explain how to trade for a living from your kitchen table. Imagine an investment newsletter that, every month for 20 years, showed you the same ten-stock portfolio and told you to stay the course.

Now, would this have been the best portfolio to own? The answer is probably not. Are there companies that not only raised dividends every year, but also raised them aggressively? Are there growth companies that are becoming dominant in their industries? Are there companies with an emerging technology that may disrupt an entire portion of the economy? Finally, are there once-great companies like GE making business decisions that are adversely impacting their business and should be sold?

These are the kinds of questions we try to answer every day and we make both portfolio and allocation adjustments as dictated by our research to keep portfolios in harmony with our clients’ long-term investment goals. With success, one day we may be able to live our lives independent of a paycheck or even social security benefits.

That’s the value we bring to this relationship, we evaluate the data and make investment decisions based on your individual financial situation so that you can focus on life’s other priorities. Propelling your investments forward is our highest priority, and we are grateful for the trust you put in us and our work.

In closing, short-term volatility can be painful, but probably not as potentially harmful as short-term thinking when it comes to portfolio management. Losses aren’t losses until they’re locked in by sales. We have over 100 years of history showing that the stock market climbs higher over time.
When the market is in turmoil, it’s best to focus on long-term goals rather than short-term fluctuations. Investors can take a step back and see that their equity portfolios have posted substantial returns over the last couple of years. They can focus on factors such as their dividend income stream which, if managed well, is less likely to be affected by market volatility.
Investors should be paying attention to equity valuations and their underlying fundamentals, rather than share price movements. If you’re a long-term investor, stocks getting cheaper is a good thing. It allows for you to accumulate more shares at better values.
By looking at these positive portfolio aspects through a broader lens, it’s easy to see that a correction or even bear market likely hasn’t destroyed long-term financial goals.

Read More

First Quarter 2022 Market Review

Investing During War Time

We’d like to start this update by stressing that we are deeply saddened by what’s occurring in the Russia/Ukraine conflict. The global elite truly believed that if rogue nations like China and Russia were brought into the 21st century global economy, they would eventually become “more like us,” Having been taught the fable of “The Scorpion and the Frog,” we feared they were wrong but hoped they would be right. We hope for a just and lasting resolution and pray for those innocent citizens in both countries who are being so severely impacted.

Why Does Russia Want Ukraine?

No one knows what lies in the heart of Vladimir Putin. But we do know that much of what happens in the world is driven by greed and the lust for power. In past letters, we have noted the friendly alliance between China, Russia and Iran. Despite the internal domestic issues it faces, China has ambitions for international dominance. To achieve regional or world dominance, they will need resources, especially energy and industrial materials.

Iran has oil reserves and Russia has a wealth of natural resources. Russia is a leading producer of coal, diamonds, aluminum, asbestos, gemstones, diamonds, lime, lead, gypsum, iron ore, bauxite, gallium, boron, mica, natural gas, potash, platinum, oil, rare earth metals, pig iron, peat, nitrogen, cadmium, arsenic, magnesium, molybdenum, phosphate, sulfur, titanium sponge, silicon, uranium, tellurium, vanadium, tungsten, cobalt, graphite, silver, vermiculite, selenium, rhenium, copper and gold.

In recent years the country has witnessed mounting challenges in the extraction of its natural resources. Some of the challenges include inadequate capital investment owing to sanctions on the country from major global powers including the United States and Europe due to its involvement in the earlier military incursions into Ukraine (Crimea) and Georgia, as well as shifting investment from industry into military equipment and technology. Additionally, it is difficult to access the country’s mineral resources located in remote areas of its vast territory. China, on the other hand, has plenty of labor and has demonstrated in their Belt & Road initiatives that they are more than willing to export that labor to various regions around the world as well as provide funding for resource development projects in exchange for access to those resources.

Ukraine also has a wide variety of natural resources, mainly energy, metal ores and non-metal ores. The country has approximately 5% of the world’s mineral resources and the world’s 7th largest and Europe’s 2nd largest coal reserves. It also has the largest uranium deposit in Europe and accounts for 1.8% of the world’s uranium deposits. The proven reserves contain an estimated 45,600 tons of uranium. Putting this together, an alliance of China, Russia, and Iran, with Russia in control of Ukrainian resources, has the potential to not only provide all the resources needed to achieve their domestic and global ambitions, but also enough to control the international markets for these critical resources and project a great amount of power and influence over the Eurasian continent.

The Biggest Prize of All?

Ukraine has 300 deposits of graphite, containing more than 1 billion tons or 20% of the world’s graphite. Only China has more graphite reserves (26% of the total world’s graphite reserves). While we think of wood pencils when hearing the word graphite, there are some interesting developments in technology that might make graphite one of the most important minerals in this century when it comes to technological advancements. Graphene, derived from graphite, may be source of technological breakthroughs in everything from microprocessors to energy storage. You can read more about the technology, but the point is that, if the afore-mentioned alliance can gain control of Ukraine, that would give it joint control of nearly 50% of the worlds known graphite reserves.

While the scenario described above is speculative, it makes more sense than the mainstream thinking that Putin, a rational KGB operative by all prior descriptions, is now risking his position and country in the emotional pursuit of regaining the past glory of the U.S.S.R. or imperial Russia by launching land wars across the continent.

The Markets

No one likes to see the markets go down in price. As both investors and pragmatists, however, we have been expecting a “healthy” pull back since the beginning of 2021. A year later all three major US indexes suffered their worst quarter since 2020.

Even a moderate 60/40 portfolio made up of the Vanguard Total Stock Market ETF (VTI) and the Vanguard Total Bond Market ETF (BND), ended the quarter down 5.58%. The reason for this has been the drop in value of the bond market as the threat of higher interest rates hurt not only growth stock prices, but also bond prices which are inversely correlated to interest rates. Bond prices have two drivers: duration risk and credit risk. Most bonds and bond funds have been penalized for duration year-to-date because the long rate (10-year Treasury rate) has risen with inflation.

Interestingly, the bottom appears to have formed in March, much like it did in 2020 and 2008.

The backdrop to each year was different and each of the 3 years seems to have its own reasons for having bottomed out at roughly the same point into the year. We are not aware of any common reason for the market’s timing, and therefore, nothing concrete that we can point to that would allow us to predict a March market bottom should we find ourselves in a similar situation in the future.

For perspective, even though the pullback was painful to feel in real time, it so far has not inflicted much damage to anyone who remained invested through the volatility as the 10-year chart below illustrates.

Oil or Interest Rates?

Watching the major financial news networks or reading daily market action reports, you might be led to believe that every daily (or even hourly) move up or down has some identifiable catalyst behind it.

These outlets are certainly hoping that you never go back and watch or read their previous reports from months, weeks, or even days ago as you would soon find that the “reason” for the market selling off today was the same “reason” for the market rising earlier.

Instead, there’s much to be gained by studying the great investors of our time like Warren Buffett, Peter Lynch, Howard Marks and Jeff Gundlach, among others, who let their actions and performance do their talking while quietly dispensing their wisdom with little fanfare.

We know it feels like we’ve been talking about the Federal Reserve raising rates for years. In that time, the Fed raised rates only once. Yet today we see the yield on the benchmark 10-Yr Treasury sitting near 2.8% versus 1.6% a year ago. This is the result of the announced change in Fed policy that now seems is being translated into action.

With the pandemic over, inflation is front and center and the Fed has increased its rate hike saber-rattling. The Fed raised its target Fed funds rate by 0.25% last month, its first interest rate hike since 2018. Their updated dot plot projections are calling for six more 0.25% rate hikes in 2022, but the latest comments from Chair Jerome Powell and several other Fed officials suggest the Fed may be even more aggressive with its rate hikes in the near term.

As a result of these comments, the bond market is now pricing in a more aggressive rate hike path than that laid out in the Fed dot plot. Raising rates is the Fed’s most powerful tool for addressing inflation, but is this an inflationary environment?

Nobody needs to be told that prices are rising, we see it every day. Gasoline prices in California have already exceeded $6.00 per gallon and $5.00 per gallon is the norm in many states. And it’s not just gasoline but also consumer staples, including beef, chicken, pork, milk, eggs and bread, are spiking in price. Higher prices are showing up in new and used car prices, rents and housing costs, clothing, entertainment and travel. In a word, it’s everywhere. That much is clear, what is not clear is the root cause of these higher prices.

In our Q1 2021 Client letter, we noted that in economic terminology, inflation is a decrease in the purchasing power of money. And, while it is reflected in a general increase in the price of goods and services, it is caused by a very deliberate action by the Central Bank where they “inflate” the supply of money in the economy by printing more.

The Fed has printed a boatload of dollars and has been doing so since the 2008 crisis. However, by their own measure, M2 (the velocity of money), those dollars have not made their way to the economy.

Additionally, the US dollar index has risen over the past two months as opposed to weakening.

Higher prices can come from two different directions: demand-pull and cost-push. The differences between them are key to understanding the best course of action.

In a robust, growing economy, usually associated with a rising middle class, the demand for certain goods and services may exceed the capacity for the market to supply them. This can be caused by excess wealth creation as those extra dollars pile up in consumers’ pockets and bank accounts, spurring demand. This can lead to demand-pull inflation. By the basic rule of supply and demand, as the available supply dwindles compared to demand, prices will increase, until the market can adjust its capacity to supply more, and/or prices rise to a level that caps demand.

Cost-push price increases start with the supply side as opposed to the demand side. They can arise from events like embargos, trade sanctions, natural disasters, or logistics bottlenecks. A good example, for those of us “experienced” enough to remember, is the Arab oil embargo of 1974, which sent oil prices from $3.00 per barrel to $12.00 per barrel in a year.

As we wrote in our Q2 2021 Letter, the current administration has made several moves to reduce the production, and therefore the supply, of oil in the US since coming into office. This government action would be considered a cost-push type factor. At that time, we noted that oil futures were indicating a dramatic rise in the price of oil going forward. In our Q3 2021 Letter we showed how oil and natural gas are used in a multitude of goods and services beyond the gas pump, thereby making the point that, as the cost of energy continued to climb, so would the prices of everything that requires energy for production or distribution.

As Michael Shellenberger writes in his book “Apocalypse Never,” a strong economy can only exist when there is access to a reliable, low-cost energy supply. In the absence of such a supply, economic activity will slow or contract until it reaches a steady state with supply. The government could end this problem today if it wanted to, but it prefers to do anything other than what would work. We do not expect this to change in the near term.

Now, cost-push and demand-pull affects are not mutually exclusive, in fact one may lead to the other as consumers, seeing higher prices due to cost-push factors and fearing even higher prices in the future, may choose to spend their money sooner rather than later (demand -pull), which then compounds the problem of rising costs from cost-push influences even further.

This is important because, as we stated at the beginning, the Federal Reserve, which is made up of a group of economists, mostly from a handful of elite schools, has made the decision to fight inflation, which it will do by raising interest rates. But rising interest rates will exacerbate rising prices as higher interest rates will increase the cost of doing business. And businesses, as they seek to preserve and grow profits, will seek to offset. We see this very clearly in the chart below where, during the 1970’s, raising rates had little impact on cost-push caused price increases (as measured by nominal GDP which doesn’t account for inflation) brought about by elevated energy prices.

It wasn’t until Paul Volcker raised interest rates to the point of collapsing the economy that the situation was reversed as unemployment sky-rocketed thereby reducing demand and finally taming prices.

Since the Federal Reserve is setting out to do the same thing it always does, there is no reason for us to expect a different result this time around and the risk of an economic downturn will increase with every rate hike. Should the Fed decide to go “full Volcker” on us, we would expect the economy to plunge into recession as it has before and for stock prices to follow suit.

What will be different this time is the government’s response to an economic downturn. We have now been conditioned for the “bail out everyone” approach unlike what we saw in the 70’s and early 80’s when unemployment hit 10% and people had to hustle to find work and keep the lights on.

Politicians being who they are, will not hesitate to enact more relief bills which will calm the masses and add a significant increase on our already unsustainable national debt.

Investment Positioning for Stagflation

If you’re in, or heading into retirement, this can be a very unnerving time. There is a strong possibility that the major losers in this environment will be those relying on insurance, annuities, pensions and fixed-rate bonds to pay their bills.

With more interest-rate hikes on the way, the bond market has a rough road ahead. Plus, bond yields still don’t look as attractive compared to the yield you can get from stocks.

Stocks are volatile right now compared to where they were in the last decade as measured by the Volatility Index or VIX.

Back then Wall Street was counting on the “Fed Put” which had been in place to prevent major drawdowns, but with inflation fears drowning out everything else, many believe that the strategy is no longer in play. This will have the opposite effect on the markets that the accommodative policy did.

Since 2012, just like in the late 1990’s, too many people focused on making quick gains from companies with only a great story but no profits, or even sales. This type of investing was promoted by Wall Street firms that were more than happy to hype weak companies to trusting investors. A myriad of newsletters promised overnight riches with a subscription to their “new secret strategy.” Trust us, if you get one of these solicitations in your inbox, we get 20 of them and it gets worse during extended bull markets.

Meanwhile, successful investors have become wealthy buying boring, well run, mature companies when the opportunity presents itself.

That may not be a sexy way to invest, but it’s a tried-and-true way to become wealthy in the stock market. Dividends have played a crucial role in generating positive returns. Since 1900, dividends have represented nearly 50% of the total return for the S&P 500 Index. Capital appreciation has made up the balance.

Owning dividend stocks is also a defensive tool.

In decades where major financial crises strike, like the 1930s and 2000s, dividends can keep a portfolio afloat.

Besides providing cashflow, companies that increase their dividends year after year often have strong businesses with wide moats. They can hold up well during times of economic stress.

While dividend-paying stocks provide more income than other stocks, they still come with risk. So as yields rise on safe bonds, we could see money shift away from dividend-payers and into bonds. However, it is important to remember that bonds are a fixed income investment, once you purchase one, your income will not increase during the life of the bond.

With dividend payers, you have the chance of dividend increases. A quick search reveals multiple stocks that have increased dividends for the past 25 years. Even more surprising was a list of stocks that have paid dividends over the past 100 years. Now some of these companies are in industries that may well go away in the future, but the point is, the approach of building wealth on a foundation of companies that reward their shareholders is a sound strategy. The study below of stocks in the S&P 500 shows that companies in the top 3 quintiles of dividend yield are far more likely to out-perform the index than those in the bottom 2 quintiles.

Now, this does not mean that we abandon growth stocks, but the days where we can buy any growth stock and watch it rise based on pure momentum are over, at least for now. Just like during the end of the dotcom craze, there are companies with growing sales and earnings, either well positioned in the next disruptive sectors or poised to be disruptors in established sectors, that will go through massive changes over the next decade such as the adoption to 5G technology in telecommunication.

The point is, growth is not dead, but it has become a stock-picker’s market as opposed to a momentum market and it will likely be a bumpy ride requiring patience and diligence.

Other investments that may do well in the near future include investments in hard assets such as oil, natural resources, and real estate.

Many of you will notice that your accounts already hold an allocation to many of these assets. For those of you who don’t mind dealing with K1’s at tax time, Master Limited Partnerships (MLP’s) could also do well with elevated energy prices.

While precious metals are always top of mind when discussing inflation hedges, neither gold nor silver yield any income and could be subject to a sell-off when interest rates rise, so we prefer to invest in precious metals through royalty companies that will provide a dividend while correlating with the price of gold over the short term.

The goal is to stay alert to changes in the market and be nimble. That’s what we try to do here at Summit.

Read More

Fourth Quarter 2021 Market Review

Dot Plots, Debt and Dollars

Let us start 2022 with wishes to you for a New Year that is filled with hope and happiness.

2021 provided a wild ride, whether it be in stocks, real estate, the economy, Covid, or quite frankly, anything else. It was all wild. Overall, markets finished the year the way they started, near record territory. However, the ride was anything but smooth as volatility raised its head with every new headline. We saw a series of sharp selloffs in the S&P 500 throughout the year, followed by strong rebounds. This pattern created problems for many short-term trading strategies as sales were triggered by the initial drops which caused them to miss the subsequent surges higher in the following days and weeks.

S&P 500 Daily Chart 2021

The tech-heavy NASDAQ Composite, was even more volatile and unlike the S&P, did not finish the year at a new high, although the performance was still quite strong.

NASDAQ Composite Index Daily Chart 2021

For the year, the best performing sectors were led by Energy, Real Estate and Technology. Energy leadership was not surprising given the rise in oil and natural gas prices. The real estate market has been on fire over the past year and a half or so, and clearly this sector has benefitted from it. Low supply and increased demand put a twist on the market but has enabled real estate companies to produce more revenue. Unlike other years, the technology sector did not come out on top, and ended up third behind energy and real estate as fears of rising interest rates triggered multiple selloffs throughout the year.

The worst performing sectors were Utilities, Consumer Staples, Industrials and perhaps counter-intuitively, Biotechnology.

SPDR S&P 500 Biotechnology ETF (XBI)

In the case of the first three sectors, the key factors to their performance are inflation and interest rate worries along with previous over-valuations relative to the other sectors, particularly energy and real estate.

Regarding Biotech, analyst Marc Lichtenfeld put it very succinctly in a recent post.

“There is no other way to put it. Biotech stunk in 2021.Other than a brief jump at the beginning of the year, the sector was rotten for the next 10 months, underperforming the S&P 500 by a stunning 41 percentage points.”

Biotech had a big year in 2020 as the entire world was focused on the sector and its work in COVID-19. However, markets often revert to the mean, swinging strongly in one direction, then back in the opposite direction soon after.

For example, the long-term average annual price appreciation of the broad market is only about 8%. But markets usually don’t rise 8% in a year, 9% the next, 7% the following year. They’ll jump 20% one year, drop 11% the following, rise 15% the next, etc.

As a long-term investment, biotech companies still possess potentially large catalysts, with opportunities for major breakthroughs in the treatment of cancer, Alzheimer’s and arthritis. Any news about clinical trial data, FDA approvals, or acquisitions can push a stock up 50% to 100% in one day. But in the short-term you can have a year like 2021 where, unless your name was Pfizer or Moderna, you watched the value of these holdings drop precipitously.

Looking forward to 2022, the headwinds are still the same although some of the uncertainty has lifted as we will review below.

All Eyes Still on the Fed

Many clients have questioned how the markets can still be going up when it seems that everything around us is falling apart. We admit that at one time in our investing lives, we asked the same questions, but over time, those questions have been answered. And while we may not like those answers, we must choose to either accept them or move on to a different line of work.

Wall Street, as with many big industries, is a cynical business. They cling bitterly to their rules, based on long held beliefs and will act accordingly in ways that often seem illogical.

In the case of the economy, interest rates, and the stock market, economic growth should in general be good news for the stock market, and it should also generally mean upward pressure on interest rates. A weak economy should be the opposite. However, those are long term factors, and as we have experienced since the 2008 – 2009 bear market, Wall Street also welcomes interest rate cuts and dislikes interest rate hikes.

We have commented, almost to the point of excess, that the Fed under Janet Yellen should have started raising interest rates back in 2013 after the S&P 500 recovered its previous price levels. With an annual increase in rates of less than 1% per year, we could have easily been back to around 4% by the end of 2019. But in a world where we save bankrupt businesses from bankruptcy, watch Federal Reserve Officials rotate jobs between the reserve bank, corporate banks, and the Treasury, and “everything is political”, the Fed punted. It used inflation, specifically the lack thereof, as an excuse to keep rates lower, longer than most economists would have imagined.

But now rising inflation has become a hot topic and has forced the Fed to start delivering on its intentions for higher interest rates. After months of whispering about an end the massive purchases of Treasury bonds and mortgage-backed securities it’s been making to shore up the economy during the pandemic, they started tapering in November 2021 by scaling back total purchases by $15 billion a month, from $120 billion to $105 billion. The Fed decided to double the pace at which it tapers on December 15th. Rather than $15 billion amount, the Fed will henceforth reduce purchases by $30 billion every month. At that pace it will no longer be purchasing new assets by early 2022.

While these are not direct hikes in interest rates, the actions reduce the demand for these securities which means that their prices should drop which increases the yields on them.

We see this reflected in the futures market which reflects pricing:

A term that we expect to get bandied about a lot this year is the “Dot-Plot”. The dot plot is a chart that records each Fed official’s forecast for the central bank’s key short-term interest rate.

On the Y-axis is the Fed Funds rate, and on the X-axis is the year for which the officials gave their forecast.

The dots reflect what each U.S. central banker thinks will be the appropriate midpoint of the fed funds rate at the end of each calendar year, should the economy evolve as they expect. Officials also provide a dot for three years into the future, as well as a dot for the longer run.

Each dot represents one Fed official – from Powell to Governor Lael Brainard, from New York Fed President John Williams to St. Louis Fed President James Bullard. Of course, it’s all kept anonymous, and no one knows which official is which dot.

With interest rate hikes officially on the table, the dot plot will become a topic of conversation as economists, analysist and pundits try to interpret the graphs and predict the Fed’s next move, probably before each meeting. If you are interested in learning more about the dot plot, you can find a good article here.

While the Fed originally spoke of three actual rate hikes of 0.25% in 2022 during their December meeting, recent statements by several members have hinted at now only seeking two. Sadly, we must still look at the situation not based on logic, but on the environment we live in today.

2022 is an election year and current polling is not being kind to the current administration. Given the reaction by the market the last time the Fed started to raise rates more aggressively, we don’t think it would be helpful to the current administration politically to have a broad sell-off occur before the mid-terms in November. Remember, the current Treasury Secretary used to sit in the same chair held by Jerome Powell.

We would be surprised to see any rate hikes before November, and at least one of us is predicting no hikes at all this year.

But what if we are wrong and we see two or three hikes in 2022? In researching for this letter, we came across a study by Bill Madden & Sandy Totten for Russell Investments which found that U.S. equities did well when rates rose slowly (i.e., less than 1% per year), but not so well if rates rose rapidly. So, if the Fed limits each rate hike to .25%, the markets should behave in 2022.

One caveat though, their study was done well before the emergence of algorithmic trading systems that now dominate daily market movements. Remember that these systems do not trade on fundamentals, most scan headlines and use artificial intelligence to quickly adjust their positions in anticipation of the expected market reaction. Unfortunately, their trade adjustments often become the expected market reaction. So, while the conclusions of the Russell Investment study could very well be still valid on an annualized basis, the daily, weekly, and even monthly volatility will more likely be exaggerated.

Economically things are improving, but we are still nowhere near a stable economy that could handle an aggressive Fed policy without causing more disruptions. Plus, as we have stated before, the Fed needs inflation in order to manage the massive debt we have accumulated. For further reading about this, we refer you to our Q2 2021 letter which you can find posted on the Suminvest.com website under the insights tab.

China

When it comes to bringing down the world economy, no other country besides the U.S. has the ability to disrupt as much as China.

Whether it is disrupting domestic manufacturing, predatory investment activities, or failure to contain an infectious virus, very few years have gone by where China has not made the news. By nearly all measures, China has become a global superpower in this century. It has the largest population in the world, it has the second largest economy after the United States, and the third largest supply of nuclear weapons after Russia and the U.S. This means that the actions of the Chinese government can have tremendous impacts on the global economy.

Unlike Russia, which became a superpower in 1949 when it detonated its first atomic bomb, China became a superpower through engagement with the West, particularly the United States and Western Europe. Our leadership truly, if not naively, believed that if we increased trade, promoted cultural exchange, and opened up our universities to Chinese students, that the government of China would eventually become more western style, probably more like the E.U. than the U.S., and the world would flourish in a new environment of peace and prosperity. Spurred on by the prospects of a new market with a billion customers, large multi-national companies climbed over themselves to invest in China, very often signing away protections they would demand from other countries.

However, many in the west are waking up to the fact that things have not quite worked out as we envisioned. China has grown rich by accessing western technology through one-sided trade and joint venture deals, adopting our manufacturing systems, and becoming exporter to the world. They took advantage of our desire to buy cheap stuff and lazy corporate leadership who found it easier to outsource production overseas than to lower costs through technology and innovation. Instead of becoming more like the West, China has recently appeared to be even more Communist, more ideological, and more threatening than any time in our lifetimes.

However, being a superpower does not guarantee economic success. Many of us still remember when the Soviet Union collapsed in 1991, not as a result of military actions, but due to the massive economic mess that centrally planned countries seem to inevitably create.

Because of their trading relationships with the West, China is in a much better position economically than the Soviet Union ever was. But they still face a host of problems including excessive debt, collapsing real estate markets, and a looming demographic problem caused by years of their one-child policy which created a gender imbalance in their population because of a cultural preference for boys.

In addition, the Chinese growth “miracle” primarily funded by western corporations like Nike, Apple, and many others, seems to be leveling off as countries like Malaysia, India, Vietnam and Indonesia are copying China’s strategies and thereby displacing it as the world’s low-cost manufacturer. As a result, China’s economic growth is hitting a wall.

Last quarter we introduced Evergrande as a potential catalyst for a China-induced financial pandemic. As of this writing, the situation continues to deteriorate. In late December Evergrande was said to have missed another deadline to pay back coupon payments on its bonds. As a result, Fitch Ratings downgraded China Evergrande and its subsidiaries to “restricted default,” meaning that the giant real estate developer has failed to meet its latest financial obligations.

In what could only be described as an act of desperation, the developer recently asked employees to lend it money (which it hasn’t paid back). The company has been hit with a salvo of lawsuits from creditors and its shares have plunged more than 80% year to date. Companies up and down the Evergrande supply chain are not getting paid.

We do not expect Evergrande to explode into a “Lehman moment” like we experienced in 2008. The government will do its best to contain the collapse through media manipulation, forced bank write-offs of the bad debt, bankruptcy of many Evergrande suppliers, and even some high-profile arrests of Evergrande executives. The table is already being set as on January 4th it was reported that trading in Evergrande’s shares was halted following a report that the Danzhou government asked the company to tear down 39 “illegal buildings.”

But as with anything so intertwined both throughout the Chinese economy as well as the global economy, eventually shockwaves will be felt at the multi-national level. Evergrande isn’t the only Chinese development company downgraded by Fitch. The ratings agency recently placed a “restricted default” label on Kaisa Group Holdings (HK: 1638), after it neglected to pay its bondholders $400 million.

Additionally, for many years as part of their fabled “Belt and Road” initiative, China’s lenders have scoured the developing world for new borrowers, in part to help the country gain strategic leverage in regions that felt neglected by the West. Several countries in Africa, Asia and Latin America are deeply in hock to Chinese banks and many of those loans could become toxic, too. A recent example of this was the Hambantota Port Development Project in Sri Lanka where, after struggling for years to make payments, the Sri Lankan government handed over both the port and 15000 acres of land around it to China for a period of 99 years.

This may have been a strategic move toward more global power and influence by the Chinese government. But, as we remind our clients all the time, cashflow is king and non-performing assets will eventually serve as anchors on a sinking ship. Each day we scan our news feeds for more clues as to what is really happening. We are seeing a lot of activity by the People’s Bank of China, which is part of the government, not “independent” like our Federal Reserve, through which they are frequently injecting and also withdrawing billions of dollars from their financial system in order to stabilize liquidity needs. Additionally, we are seeing some headlines on Chinese central bank policy remaining accommodative and reiterating its plan to take actions to stabilize the economy in 2022, which likely means more stimulus is on the way. All of which brings us to the next financial headwind.

Evergrande is just part of a much bigger problem. As we mentioned earlier, China has a huge debt problem. China’s total debt to gross domestic product (GDP) exceeds 322%, with a credit imbalance of over $52.6 trillion in banking assets:

For perspective, the U.S. Debt to GDP ratio is “only” in the high 120’s. As we have mentioned before, historically at ratios above 90%, additional debt produces negative returns. Meaning that each new dollar borrowed will produce less than a dollar of growth. We have experienced this here in the U.S. which is still one of the most capital efficient economies in the world, so imagine what must really be happening with the Chinese economy.

While some may look at the situation in China and breathe a sigh of relief that we might see the end of the “Chinese Miracle” (which was really not a miracle but an economic case study in growth from a massive third world economy to a modern day, low-cost export economy). It is important to understand the major geo-political consequences of a weakened super-power.

During the Sixth Plenary Session of the 19th Central Committee of the CCP on November 10, 2021, the CCP Central Committee passed a “historical resolution” elevating President Xi Jinging to the same stature as Mao Zedong and Deng Xiaoping and essentially making him “President for Life.”

Our reading of history tells us that dictatorships can be tolerable in the best of times and terrible when things go bad. We already have seen the end of Hong Kong’s democracy over the past two years, their resolve to reclaim Taiwan as part of the mainland and their claims to the entire South China Sea. This has all been part of a long-standing plan to be the lone power in the Western Pacific and South Asia.

So far, as their economic power has been rising, they have been able to engage in a “nudge, but don’t shove” approach designed to keep the West at ease regarding their ambitions. However, what happens when your economic power begins to stagnate, or even decline?

If that’s the case, and they realize it, then they may choose to become more aggressive in their pursuit of regional dominance. After all, nothing can rally a population during a period of economic malaise like some good old fashioned foreign intervention. With the perceived weakness and war-weariness of the United States after last August’s events in Afghanistan, they just might think that now is the best time to move.

Is a shooting war inevitable? Probably not, but desperate times often lead to desperate measures and President Xi has a lot on the line. This will be something that we will be tracking throughout the year.

Inflation

While this subject really belongs in the Fed discussion, we know that it has developed a life of its own lately so we will address it separately.

Based on the latest Personal Consumer Expenditures data, which is the Fed’s preferred measure of inflation, it looks like the rise in price increases may be starting to stabilize.

Note that we are not saying that prices are dropping, we are saying that the prices we are paying are not increasing as fast as before and that they may begin to rise at a smaller rate heading into 2022.

Unfortunately, this means that prices are still rising and the increases we have experienced are not going to recede. The key reason for this is our energy policy which has driven oil back up to the high $70’s with many experts whispering about breaking $100 by 2023.

As we discussed in our previous letter, oil and natural gas are the backbone of our economy, providing not only heat and transportation fuel, but also the raw materials for almost everything we touch, including the computer I am typing this letter on. Energy production has been hard hit, especially in the last 12 months causing prices to rise as economic activity continues to recover from the 2020 lockdowns.

So, it should be no surprise that much of the inflation we have seen is energy related.

As consumers we can expect to be hit with the double whammy of direct inflation by paying higher prices at the gas pump and to our local utilities and indirectly through price increases of nearly everything else we buy as producers pass along the increased prices of materials, components, and transportation to us. The only winners here are your state and local governments who will now collect a higher sales tax on the same basket of goods you bought last year.

As we pointed out before, these price increases are not being driven by a booming economy but by a toxic combination of distortions in the availability of goods, components, and raw materials from the uneven reopening of economies and industries as well as excessive stimulus spending where private businesses are being forced to compete with government assistance in trying to get people back to work.

Eventually this will have an impact on economic growth, although it will be hidden behind the headline numbers for quite a while as an increase in costs reflect positively in GDP.

As an example, if I used to pay my neighbor’s kid $10 to mow my lawn and now, I have to pay $15, that would look like economic growth even though the size of my lawn has not changed, nor has the amount of time it takes to mow, or the amount of gasoline needed for the lawn mower.

This is a classic example of “Stagflation”, and we fear that we are headed “back to the future” with a 1970’s style economy with high prices, slow real growth and even more government spending.

The good news is that we’ve seen this before and we know that the markets have survived in this type of environment.

While you may be inundated with emails for gold, crypto currencies, and one-stock retirement portfolios, please consider the following:

S&P 500: Dividend Growth Rate by Decade Versus Inflation

Decade Total Growth Annual Growth Inflation
1950s 60.5% 4.8% 2.0%
1960s 72.7% 5.6% 2.3%
1970s 78.8% 6.0% 7.1%
1980s 95.6% 6.9% 5.5%
1990s 49.1% 4.1% 3.0%
2000s 36.0% 3.1% 2.6%
2010s 93.6% 6.8% 1.7%

Source: Jody Chudley, “An Investor’s Best Defense Against Runaway Inflation”

What this table is telling us is that in six out of the last seven decades, the growth rate of dividends paid by S&P 500 companies vastly outpaced inflation. This means that irrespective of price gains or losses, the income generated from owning the S&P 500 has grown faster than the rate of inflation.

Even during the 1970s, when annual inflation averaged 7.1% for the entire decade, the 6% average annual growth in dividend income of S&P 500 companies very nearly kept pace.

At the risk of sounding like a broken record, a stock portfolio built around high-quality companies with growing sales and increasing earnings that reward their shareholders by paying a dividend that increases over time is a tremendous, time-tested hedge against inflation.

Dividend portfolios performed very well last year as investors sought streams of income in a zero-interest rate environment or defensive positions in a period of high inflation. While we do expect volatility to impact share prices over the short term, we continue to focus on the fundamentals of the company behind the stock symbol and hold those that have the greatest potential for long term success.

As always, it is a pleasure to serve a wonderful group of investment clients and we look forward to working with you as we navigate the challenging waters of 2022.

Read More

Third Quarter 2021 Market Review

September Swoon

After a seemingly endless run up in prices, the market finally started to pull back at the end of the 3rd Quarter:

S&P 500 Q3 – 2021 Price Chart

The green line on the chart is the 50-day moving average which is a common technical indicator used by traders to determine potential changes in price direction.

While this chart looks a little frightening with its depiction of a broken upward trend, it is always wise to zoom out and put things in the proper context.

S&P 500 YTD Price Chart

In addition to the green 50-day moving average, this chart also brings the red 200-day moving average into view. As you can see, while the index is trading below the 50-day line, it is nowhere near trading below the 200-day line.

Most importantly, it is a long way from the legendary “Death Cross” where the green 50-day line crosses below the red 200 day line.

Sticking with a technical perspective, historical data indicates that once a new bull market has been confirmed (which happened on August 18th of last year when the S&P 500 Index had recovered from its March 23rd, 2020 bear market low point, and achieved a new record price), the longest time period on record (going back to 1950) before the beginning of another bear market was 7.44 years, with an average beginning of 2.44 years.

We are just over one year since the point of the new bull market confirmation so we would be bucking history if a new bear market were to start so soon.

Additionally, history shows that there has usually been at least one 10%+ correction (and often several) between the end of one bear market and the start of another. On average, a little over one-year elapses from bear market end to a correction of 10%. The first such correction in the current bull market was completed just under one year ago on September 24th. Since then, we haven’t had a 5% correction in the S&P 500 until this September, making this one of the longest streaks ever without a correction.

Sticking with history (in this case the past 45 years), which we acknowledge is no guarantee of the future, we know that September has historically been the worst-performing month in the market, as we see in this chart from theancientbabylonians.com

In fact, looking at this chart, one could argue that September would be the best month for putting new money to work in the market. We have not done any analysis on how this would work as a strategy, but perhaps we will explore it in one of our future Market Insights posts.

To summarize, it’s not unusual to see at least one, if not multiple, 5 – 10% corrections during a Bull market and certainly less unusual to see them occur around the September timeframe.

Beyond technical or historical reasons for the pullback are the usual suspects that we’ve been discussing:

  • The Fed
  • The economy
  • Inflation
  • China / geopolitical

Reasons for the Pullback: The Fed

Let us say this right up front, we don’t think the Federal Reserve’s support for the economy is going away anytime soon. Though we do not have a direct line to Chairman Powell or any other of the voting Fed Governors, we can look around and know that, if the Fed were to take away the stimulus punch bowl, the party would come to a crashing halt. From Greenspan to Bernanke and from Yellen to Powell, the Central Bank continues to paint themselves into an economic corner. Escape from that corner will likely be messy.

None of the Fed governors want to go down in history as having brought down the US economy, so they will continue to kick the can down the road for as long as possible.

We hate sounding like a broken record, but we believe that the Fed not only wants, but needs inflation. It doesn’t take a Harvard economist to know that the U.S. is well beyond its ability to ever pay down the government debt with real economic growth. Therefore, the only course the Fed has is to drive inflation to reduce the real value of the government debt.

The trick is to thread the needle: allowing the reemergence of higher inflation without causing a panic by letting it rise too high, too fast. Higher interest rates depress economic growth and can ultimately bring down inflation, as we saw in the 1980’s, so it would be a direct hindrance to any attempt to increase the rate of inflation.

That does not mean that the Fed will not adjust based on economic conditions strengthening or weakening to maintain some semblance of credibility.

Since 2009, the Fed has been purchasing treasuries and mortgage-backed securities in a process known as “Quantitative Easing” or “QE” for short. By buying U.S. government debt and mortgage-backed securities, the Fed reduces the supply of these bonds in the market, causing other buyers to bid up the prices of the remaining supply, which then lowers their yield, thus keeping interest rates low.

Low government interest rates also impact other interest rates such as corporate bonds and mortgages which, in theory, entices individuals to borrow for mortgages or car loans and businesses to borrow for new equipment which ultimately could improve hiring. Low rates are also associated with higher asset prices (inflation) which increases the perceived wealth of households and encourages more spending. This is known as the “wealth effect.”

Currently, the Fed is buying $120 billion worth of Treasuries and mortgage-backed securities every month.

Those purchases were an emergency measure intended to keep borrowing costs low during the pandemic caused recession of last year. The chart below illustrates how quickly the Fed ramped up its purchases of Treasury securities and its purchases of mortgage-backed securities, as shown in green when the COVID-19 virus started hurting major parts of the economy.

These actions were intended to convey to the public that the Fed stood ready to backstop important parts of the financial system. It has resulted in an increase in the Fed’s debt holdings to nearly $8 trillion.

So, in a policy announcement made on Wednesday, September 23rd, the central bank said it would begin tapering its government bond and mortgage-backed securities purchasing program.

Investors have been waiting for the taper comment for quite some time as the economy began to open up. The worst-case scenario would have been the commencement of a tapering program immediately, signaling the withdrawal of stimulus. But since it made no such commitment, investors can feel confident the central bank will keep policy accommodative for now, which should continue to support the upward trend in U.S. stocks.

Chairman Powell stated that employment could meet the Fed’s progress test as soon as the next meeting. The implication is a taper announcement could happen at one of the two remaining 2021 policy meetings in either November or December.

Powell went on to say that the central bank could complete its asset purchases sometime around the middle of next year. He said there is broad support on the policy committee for the timing and pace of tapering. The statement indicates those purchases would be diminished by $12 billion per month if it were to begin next month and end next August. Wall Street’s worst-case scenario has been $30 billion per month.

Lastly, Powell said the timing and pace of the coming reduction in asset purchases will not be meant to signal when an interest-rate hike is coming. That will have a more difficult and stringent test. A rate hike will not happen until labor market conditions have reached maximum employment and inflation is on track to exceed 2% for some time.

The central bank believes the economy is headed back on the right path. The Fed believes its emergency measures have been a success.

They rescued the financial system from collapse and have helped boost economic output which is on its way to surpassing 2019 levels and therefore, the economy no longer needs emergency measures and hence the wind-down of stimulus measures.

We want to reiterate that tapering does not mean raising short-term rates.

It also does not mean the end of asset purchases by the Fed, but rather a reversion to pre-pandemic levels. Reduced bond buying could raise yields on 10-year Treasury bonds back up to the 2% range over time.

10 Year Treasury Rate
Source: Macrotrends.com

A move up from current levels could produce short-term stock market volatility as the “rates are rising” meme starts to permeate the collective consciousness. But 2% is a far cry from “high” interest rates. We expect that a rise back to 2% should be offset by continued economic and earnings growth, so we do not anticipate it causing a change in the overall market trend.

Reasons for the Pullback: Inflation

The Fed continues to assert that inflation is transitory. It expects that as temporary supply-chain constraints are worked out, inventories are replenished, and supply becomes more readily available, costs will adjust accordingly. Although in recent congressional testimony, Chairman Powell indicated that it may take “a little bit longer” for the adjustments to finally take place.

Last quarter, we talked about how inflation was hitting multi-decade highs in several categories.

Many of the price rises were caused by an imbalance of supply and demand instead of a real decline in the purchasing power of the U.S. dollar. As prices accelerated (like used cars, housing, and labor prices), interest rates started to soar. The benchmark interest rate hit 1.75% earlier this year.

Many investors started to fear that interest rates would rise alongside prices. But instead, as shown in the chart below, they actually turned lower with 10-year government bonds falling back to 1.35%. and U.S. 30-year mortgage rates hitting all-time lows early this year, below 3%. Today, mortgage rates are hovering around 3% which still makes it a great time to refinance if you haven’t yet.

So, we have a divergence between the reported rate of inflation and interest rates, which we know cannot last in the long term.

10 Year Treasury Rate Year to Date
Source: Macrotrends.com

The question is, which do we trust, interest rates or inflation, as an indicator of the future?

The Consumer Price Index (CPI) and Producer Price Index (PPI) track prices paid over a certain period. But they are backward looking in nature and tend to tell us “what was” as opposed to “what’s next.” Interest rates, on the other hand, represent the collective beliefs behind the real time investment of trillions of dollars. So, interest rates can serve as a “forecast” of inflation and the economy.

Interest rates had been falling despite record-setting inflation numbers. They’ve crept back up to around 1.5% today but are still below the peak of earlier this year.

The market appears to be telling us that these high inflation rates won’t last for long.

Are there risks? Yes! As we wrote last quarter, the administration made several moves to reduce the production of domestic oil and natural gas which has driven the price of oil above $75 per barrel (as measured by West Texas Intermediate) causing gasoline prices to increase around 42%! Natural gas (used in both the production of electricity as well as for home heating) has also seen its price increase above $6 per BTU. This will result in home heating bill sticker shock as we head into the winter season.

Source: Finviz.com

Source: Finviz.com

These moves by the administration appear to be a deliberate effort to raise energy prices to the point where alternative means of electric power generation become more competitive. The increased costs directly impact middle- and lower-income populations (a de facto regressive tax) and will produce a drag on economic growth as discretionary dollars are diverted to pay for higher gasoline, heating, and lighting bills.

Moreover, higher energy costs will hurt corporate profits outside of the oil industry and delay hiring and business expansion for both large and small firms. And lest we forget, byproducts from the refining process are used in a variety of applications including cosmetics, pharmaceuticals, plastics, clothing, rubber, and even the humble candle.

We might be looking at a version of the “stagflation” experienced in the 1970’s where higher prices coincide with a stagnating economy

This is something to keep an eye on as the economy continues to reopen. Major banks have already lowered their growth projections for 2022 so they seem to be reacting to the things we are seeing.

Reasons for the Pullback: China

Developments in China concern us much more than anything else at this moment. We’ve been reading articles from several trusted sources and when we try to connect the dots, we find a potential threat to global markets.

We’ll start with the headlines and then dig deeper, peeling away at the onion if you will.

Up until a couple months ago, hardly anyone had ever heard of the Chinese property company Evergrande. Now all eyes are on Evergrande, as the company appears to be on the verge of a financial collapse which could threaten to take the global financial system down with it.

Evergrande owns over 1,300 real estate developments throughout China worth more than $352.5 billion. According to Bloomberg, it generated $73.5 billion in revenue last year and is on track to generate just over $79 billion this year.

However, China Evergrande recently expanded into non-traditional business lines as sales growth in its core business slowed. Some of its new ventures include electric vehicles, bottled water, and insurance. As a result, its debt load swelled from $25.1 billion in 2014 to $110.6 billion today. And its total liabilities are estimated to be around $306.3 billion.

Last year, the Chinese government introduced regulatory limits on debt ratios. Evergrande is reportedly working to meet those requirements by the end of 2022 by selling assets and spinning off business units to pay down its debt. But twice in the last two weeks, the company announced it’s struggling to meet its goals and floated the possibility of defaulting on its debt.

The company revealed making late payments on commercial paper obligations back in June, according to Reuters. And with the recent statement about a lack of progress reducing debt, investors are worried about the potential fallout should the company default. It’s estimated that over 250 banks and non-financial institutions hold loans made to Evergrande.

Regulators are said to have approved a renegotiation of payment deadlines by Evergrande with its creditors. This suggests they’re worried about the company’s ability to meet its obligations. And if it fails to do so, it could have a domino effect on China’s debt and property markets. Those bond and loan investors could be facing write-downs unless the government bails them out.

However, the state-run media outlet Global Times, which is known for being the mouthpiece of the hardliners in Beijing, have warned Evergrande not to expect a government bailout. The tabloid said Evergrande shouldn’t assume it’s too big to fail.

Evergrande employs around 200,000 people and reportedly hires another 3.8 million annually for different projects. If Evergrande fails, it won’t be the only player in China’s financial system to do so. All the institutions involved will take a hit. They’ll all have less money available to lend because their balance sheets will deteriorate.

On October 5th, a second developer missed a bond payment. A firm called Fantasia Holdings did not repay $206 million in principal of a bond that matured on Monday. Additionally, it’s reported that Fantasia did not pay a separate debt of $108 million that was also due on Monday. Ratings agencies have downgraded Fantasia and a third Chinese developer, Sinic Holdings, over risks from their deteriorating cash flow situations.

According to Fitch Ratings, Sinic is likely to default on its $246 million offshore dollar-denominated bond due October 18. Furthermore, Sinic’s local subsidiaries reportedly have already failed to make $38.7 million in interest payments on two onshore yuan-denominated bonds that were due September 18.

Why is this important? The real estate sector in China accounts for as much as 15% of China’s gross domestic product (GDP).

While it seems like a domestic problem for China, it’s never that simple. As the world’s second-largest economy, China produces many of the goods consumed elsewhere and it also imports plenty of items. In 2019, exports totaled $2.57 trillion while imports totaled $1.58 trillion.

As financial analyst Jim Rickards points out, China has kept its growth engine humming all these years mostly through investment instead of through rising consumption by its citizens.

Investment is fine if it is directed at long-term growth projects that produce a positive expected return and help the broader economy grow as well. But that’s not what China has done.

About half of China’s investment in the past 15 years has been wasted on “ghost cities”, often referred to as Potemkin Cities after their famous Russian precursor, white elephant transportation facilities, and other prestige projects that look good superficially but that don’t produce enough revenue or efficiencies to pay for themselves. Much of this investment was financed with debt. If the project itself is not revenue producing, then the associated debt cannot be repaid and will go into default. This is what we are starting to see now.

If this situation slows demand from China for trade, it’s sure to impact the economic growth picture across the globe.

The situation will hurt domestic demand in China for all types of goods. With world stock markets dominated by algorithmic trading, its highly likely market volatility will increase (perhaps precipitously) if headlines start to indicate that the Chinese economic miracle was no miracle at all but rather mostly smoke and mirrors.

Looking Forward

It’s impossible to accurately predict the future. The world is changing rapidly. Some changes are quite remarkable while others are downright frightening. Using a variety of sources, we sift through volumes of information and opinions to identify major economic trends.

We then try to identify the investing themes that will allow us to succeed over the long term within the range of possibilities that we identify. It is always important to remember that while history doesn’t necessarily repeat, the past can provide clues to future developments.

While the names of the best companies to invest in have changed over the past 100 years, the characteristics of a company that can survive world wars, trade wars, inflation, and market crashes, have remained consistent over time.

By looking at our investments as businesses, instead of symbols flashing across the bottom of a television screen, we can identify strengths and weaknesses that can impact a company’s ability to navigate the economic waters and act accordingly. While it may not be as exciting as a trade that doubles in just a couple of months, we believe that a primary focus on well-run companies that continue to increase revenues and cash flow and reward investors with growing dividends is the best approach to building long term wealth.

Read More

Investing for Cash Flow

When asked for his advice, famed investor Warren Buffett, the “Oracle of Omaha,” suggests that buying index funds is the best option for most investors. There are several reasons for this. We’re guessing the biggest one is the average investor severely underperforms the broader market indices.

Most investors do not have the discipline it takes to stick with a strategy under the constant bombardment of financial news triggering extreme fear or extreme greed.

Since 1984, independent investment research firm Dalbar Inc. has published an annual QAIB: Quantitative Analysis of Investor Behavior report. If you’ve followed Dalbar’s research over the years, you’d be well aware that one consistent theme keeps cropping up.

The set of longer-term data analyzed in these QAIB reports clearly shows that people are more often than not their own worst enemies when it comes to investing.

Source: DALBAR 2020 QAIB Report for the period ending: 12/31/2019

Given this information, one can hardly blame Buffett for making a safe recommendation, especially when he does not know anyone’s personal financial needs or even why they’re making an investment at all.

For instance, if you are investing for retirement and expect your investments to provide for your living expenses once you quit working, simply investing in an index fund may not be the best strategy.

Using the S&P 500 Index ETF as a reference, we plugged the numbers into a Dividend Reinvestment Calculator using the following assumptions:

Starting Investment: $500,000 in a traditional IRA assuming ten years to retirement

Current Dividend Yield: 1.33%

Annual Dividend Growth Rate: 10%

Annual Share Price Growth: 10% (30 year average)

Looking at the Total Value column below, we can see that you certainly can build a nice nest egg by the time you retire based on the above assumptions. The second column below adds an average social security payment of $2500 per month to the total, showing that the investor could begin their first year of retirement with an income of about $74,000 before taxes. Remember that IRA withdrawals are taxed as regular income so if they were retiring today that would be 12% for married individuals filing jointly.

How does that compare with a cash-flow biased strategy?

For comparison, we took a published Compound income portfolio that we track with the following assumptions:

Starting Investment: $500,000 in a traditional IRA with ten years to retirement

Current Dividend Yield: 4.44%

Annual Dividend Growth Rate: 8.2%

To emphasize that this strategy is dependent on fundamentals and not share prices, we assumed the Annual Share Price Growth was zero.

The results below beg the question, who is better off?

Looking at the last column, on a price basis, investing in the index with average price increases will give you a larger portfolio. That is very good if you need to sell portions of it to pay your bills.

However, if we look at the second column, we see that the compound dividend portfolio will be providing around $77,000 in dividend income, which is more than the SPY investment plus social security combined. In fact, add in social security and though it’s substantially smaller than the index portfolio, this method provides nearly $100,000 per year in income.

Depending on your budget, some of the funds could continue to be reinvested to produce even larger cash flows in the future.

There’s an old saying in statistical analysis: “no one achieves average.” These are models based on a set of an assumptions. The S&P ETF won’t gain 10% per year but will likely lose 10% one year and gain 20% in another. Similarly, the individual stocks in the Compound

Dividend portfolio won’t stay at the same price over a ten-year period. In fact, the entire portfolio is up nearly 16% year to date. So, we won’t always be able to reinvest our dividends at bargain prices.

While the absolute results will likely be different for each strategy over the next ten years, the relative performance of one strategy versus the other will likely be close to the model projections.

As of June 2021, 70% of Buffetts’ $320 Billion portfolio is in five stocks (AAPL, BAC, AXP, KO and KHC), all of which pay dividends currently ranging from $0.84 per share to $1.74 per share. Whether the stock market is up or down, those five holdings alone will provide Warren’s company with approximately $3.1 Billion. That’s enough to pay the bills including Warren’s salary and benefits.

Is this the best way to invest?

You can argue both sides. Buffett’s stock, Berkshire Hathaway (BRK.A), has failed to outperform the markets for a while and he is regularly mocked by financial journalists for having “lost his touch” when it comes to the markets.

Still, we really doubt that he lost much sleep over paying his bills during the 2008-2009 bear market or the Covid Crash of 2020.

Read More

Second Quarter 2021 Market Review

The Recovery Continues

The second quarter continued essentially where the first quarter left off. There were few surprises that really made substantive impacts on the markets.

The S&P 500 climbed 8% in the second quarter, extending its five-quarter advance to an incredible 66% gain. For all the worries about tech stocks in the face of rising bond yields, the Nasdaq Composite surged 10% to take its five-quarter increase to 89%.

So far, leadership this year has come from pockets of the market that were laggards during the last decade’s rise of big tech. Using sector ETFs as a gauge, the financial sector, regional banks, value stocks and the energy sector are all up more than 20% so far this year while retail stocks have risen about 50% this year.

Small investors made the news with the rise of the meme trade. Shares of the heavily-shorted companies GameStop (GME) and AMC (AMC) have gained more than 1,000% and 2,000% this year, respectively.

Perhaps the biggest meme trade based on headlines, Bitcoin (BTC-USD) topped $60,000 before falling back to the $30,000+ range where it still sits today.

According to the Wall Street Journal, U.S. home prices surged at their fastest pace ever in April as buyers competing for a limited number of homes pushed the housing market to new records. The S&P CoreLogic Case-Shiller index rose 14.6% which is the fastest annual growth rate since the index began in 1987.

Treasury yields, which rose precipitously in the winter’s early months causing a correction in tech stocks, have dropped recently even while inflation readings hit multi-decade highs.

More recently, the White House and a group of bipartisan senators reached an agreement on an infrastructure bill, worth $1.2 trillion in spending over the next eight years.

In the last month, with the pullback of interest rates, the tech sector (XLK) and software stocks (IGV) once again outperformed the broader market.

The graph below gives a good visual of the winners and losers so far this year as of June 29th.

We would not be surprised if the market went through a correction during the second half, similar to last year when the S&P 500 Index fell 9.9% from its intraday high on September 2 to its intraday low on October 30 after a strong run up (+61.4%) from its pandemic low of late March 2020. From that point (10-30-2020), the S&P 500 has risen a very strong 32.8% so a little pullback would not be unusual.

What could cause such a pullback? There is a lot going on that can impact our investments, so here is the latest review of what is keeping us up at night.

The Economy

With the continued rise of social media combined with 24/7 news cycles and non-stop elections, we have entered what some people are calling a period of “Narrative Economics” where the prevailing narrative drives economic behavior. It doesn’t necessarily matter whether or not the narrative is true, only that the majority of participants believe it. While we think this phenomenon isn’t brand new, it seems to have gone from local to national and even international in character as technology now allows information to travel farther and wider than ever before.

As we noted in our Q1 letter, the economy was bound to recover sharply from the pandemic induced recession of 2020 which was the worst since 1946.

The economy grew at an annualized rate of 6.4% in the first quarter. Expectations are that growth accelerated to a 9% pace in the second. Demand for just about everything exploded this year. Used cars, rental cars, semiconductor chips, pilots, flight attendants, chlorine, shipping containers, and truck drivers are all in short supply and high demand. As you can see from the list, many of these items are interrelated and can cause severe short-term distortions in supply and demand pricing.

Some of these issues are already starting to abate as temporarily shuttered production facilities come back online causing supply chains to back up. But, just like a victim of a car crash doesn’t get up and start running marathons in a week, the great reopening will cycle through various fits and starts for much longer than it took to shut things down.

After a few lackluster months of hiring, the June jobs report showed non-farm payrolls grew by 850,000 last month, a signal that some of the hiring pressures within the labor market might be starting to ease.

Once again, the job gains were led by the service sector where the hospitality industry continued to be the prime beneficiary of the reopening as workers returned to jobs at bars, restaurants, hotels and the like. The industry notched a gain of 343,000 new hires amid easing restrictions across the country. That total included 194,000 in bars and restaurants, but still left the sector 2.2 million employees shy of where it was in February 2020 before the pandemic began. Despite the big increase in jobs, the sector’s unemployment rate jumped to 10.9%.

That shouldn’t be too surprising as leisure and hospitality were the hardest hit businesses at the height of the pandemic.

Now, more than 154 million of 332 million Americans (46%) are fully vaccinated. The country and economy feel like they are returning to normal, and these types of businesses are dealing with pent-up demand by hiring back workers that were let go during the pandemic.

This sector has seen some of the stiffest hiring competition, and wage increases have followed as a result. In June, average hourly earnings for this sector hit a new high of $18.23, a new record for the series and a 7.1% increase over the same month last year.

Other notable employment gains came in education (+269,000) professional and business services (+72,000), and retail (+67,000).

The other services industry added 56,000 jobs, including a gain of 29,000 in personal and laundry services, a subsector that has been seen as a proxy for the resumption of normal business activity. Social assistance added 32,000, while wholesale trade contributed 21,000 to the total and mining grew by 10,000.

Manufacturing edged up 15,000 for the month, though construction lost 7,000 positions despite a sizzling housing industry where new building has been held back by supply shortages and what had been soaring lumber prices before the recent plunge.

But underneath the headline data, which also showed a slight uptick in the unemployment rate as the number of people looking for work increased, we wanted to flag a few charts outlining some of the big trends set to drive the labor market in the months ahead.

During the month, the labor force participation rate among adults 25-54 rose to 81.7%, the highest since the pandemic began and matching the level seen in January 2018.

After the 2008-2009 financial crisis, the decline in participation among prime-age workers was a major sign that the economic recovery was underserving workers and growth at-large. The rise in this rate over the second half of the 2010s was one of the most encouraging economic trends underway this century until COVID-19 disrupted the economy.

A continued rebound in participation among those enjoying the fastest career and earnings growth will be a key gauge of the health of the post-pandemic economic recovery.

And finally, each month it is worth highlighting what remains the most discouraging labor market chart for the pandemic economy. As of June, total employment in the U.S. remained 5.7 million below February 2020 levels.

This is going to be an important statistic to watch going forward. The importance that policymakers see in this data will keep the gap between February 2020’s employment level, and any future month’s reading, near the top of conversations about the state of the labor market recovery.

Wall Street money managers and traders are trying to figure out when the Federal Reserve will begin tightening monetary policy once more.

Powell has told us employment will be the driving factor. And while it’s steadily improving, we are still far from maximum levels.

So, if we see new hires continue to steadily rise, it means the economy is inching back to pre-pandemic numbers. And that could lead to tightening monetary policy sooner than later. And while that would mean the economy is on strong footing, it could also remove a key pillar of support for the current market rally.

The prevailing narrative today is that we are recovering and will return to the pre-Covid economy soon.

The stock market is pricing in that more pleasant future. Any shift from that narrative could cause a reversal in the markets which, as we have discussed before, will now get amplified by the algo-traders rushing to beat everyone to the exit.

Treasury yields signal investors’ waning economic exuberance – WSJ. The recent drop in U.S. Treasury yields reveals some investors’ doubts about how strong the economy will be in the coming years, even as inflation pushes to its highest level in more than a decade.
The other risk, which we will discuss below, is that the recovery happens “too fast” which could impact interest rates and bring a halt to the rally.

The Fed

If you recall, the growth-heavy Nasdaq Composite Index almost fully corrected in Q1and only managed a small gain due to a sharp rise in interest rates. Long rates exploded higher throughout Q1, with the yield on 10-year US Treasury bonds rising 15bps (Jan), 34bps (Feb), and 34bps (March).

US 10 Year Treasury Rates through March 21

This sharp reaction by the NASDAQ 100 only serves to strengthen the narrative that Wall Street is addicted to low interest rates and the Fed is a prime driver of near-term stock prices.

The Fed’s primary goals are to promote maximum employment, stable prices, and manage long-term interest rates. The Fed also helped to create stability in the financial system at the height of the pandemic last year. An April 13th, 2020, post at CNBC.com details the almost $6 trillion in stimulus the Fed provided to the economy in addition to the $2 trillion from the Government’s first rescue package.

Whether we agree that stimulus at the onset of the coronavirus pandemic was a good idea or not, it did what it set out to do.

The Fed orchestrated the stability of the financial system and staved off economic collapse. Chairman Jerome Powell has even said the Fed’s worst-case scenarios never came close to playing out. But now that the crisis has been averted, the emergency policies will eventually need to be reversed.

If economic growth this year can reach 8% as some Wall Street economists have suggested, it will mean we are recovering to pre-pandemic levels.

That would be a signal it is time for the central bank to back away from easy-money policies. That would mean taking steps like diminishing bond purchases before it begins to actively raise interest rates. In fact, several Fed members have begun hinting that the time may be right to get started.

Fed’s Waller says 2022 rate hike possible, wants MBS taper first – Reuters. A “very optimistic” Federal Reserve Governor Christopher Waller on Tuesday said the U.S. central bank may need to start dialing down its massive asset purchase program as soon as this year to allow the option of raising interest rates by late next year.

Kaplan hopes Fed will begin bond taper soon – WSJ . Federal Reserve Bank of Dallas leader Robert Kaplan reiterated his view that it will soon be time for the U.S. central bank to slow the pace of its $120 billion a month in bond buying stimulus, a process he expects to go smoothly.

Based on the current data, the Fed could begin to reduce bond purchases by the end of this year with an eye to start slowly raising interest rates in late 2022 or early 2023.

While it may not be what Wall Street wants to hear, it is the practical course to take. Maintaining current easy money policies could have bad economic implications down the road with serious inflation and a declining dollar.

Declining stimulus, though, could have negative implications for the S&P 500 and NASDAQ Composite Index next year. So, they are weighing short term versus long term risks. Guess which usually wins.

Tax Policies

As of the first quarter, US Federal Tax receipts topped $2.2 Trillion for the first time, beating the previous high point from the fourth quarter of 2019 (see chart below). Yet, despite record setting tax receipts, the chorus of those calling for new taxes seems to be endless.

In a May interview in The Atlantic , former Fed Chairperson and now Treasury Secretary Janet Yellen claimed that an approximate $7 trillion in taxes are going uncollected by the federal government. It is being made clear that raising taxes will be a priority of the current administration.

As we pointed out last quarter:

“According to MMT, you do not need taxes to pay for government spending but instead:

1. To force citizens to accept government currency by forcing them to pay taxes in the same currency.
2. To reduce any economic imbalances by using the progressive tax code to address income inequality by taxing the rich and redistributing it to lower income individuals.
3. To fight inflation, instead of raising interest rates, the government would cool the economy down with a large tax hike.”

With government stimulus to date exceeding $6 trillion, a bipartisan $1.2 trillion infrastructure bill on the table and a promise to use budget reconciliation to push through additional spending, we can certainly argue that Washington D.C. has embraced MMT in spirit if not in name.

Some of these proposals are for actual tax increases like returning the top rate to 39.6% and the top corporate tax rate to 28%.

Many other proposals are categorized as “fixes” to the tax code to eliminate “loopholes” in the system. Apparently, denizens of Washington think the average voter can be made to believe “someone else” will foot the bill.

Again, these are just proposals, so we won’t get into them here.

The current list is posted at whitehouse.gov. Our focus is how any new tax impacts our investing strategies. Any tax that reduces net incomes or increases costs can certainly negatively impact domestic economic growth which, in turn, could negatively impact stock prices.

Any taxes which impact estate planning or real estate investments can result in short-term volatility as people and businesses scramble to adjust portfolio structures to avoid additional taxes. The proposed limits on 1031 exchanges, taxing capital gains as ordinary income, and elimination of the stepped-up basis for inherited assets are examples of this.

We will continue to watch developments and keep you informed as to any impacts on our strategies.

Geopolitics

In recent articles and interviews, Michael Pillsbury from the Hudson Institute and the author of “Hundred Year Marathon” sees a stronger alliance growing between China, Russia and Iran.

Pillsbury said that though a “global world order” was set up by the United States in 1945, the Russians and Chinese want to challenge that world order.

“This is a strange challenge coming from these two powers. And when they bring in Iran, I mean, Iran is the source of their oil and gas. It’s got a lot of money to buy weapons. They see it as the main way to tie down the Americans in the Middle East.”

Indeed, the recent election of a new President in Iran only strengthens this notion.

An article in Asian Times, published shortly after the first press conference of newly elected President Ebrahim Raisi, noted that Iran’s path ahead is unmistakable. That path is centered on the “Look East” strategy, which means closer cooperation with China and Russia. Iran will be a key node of Eurasian integration (or, according to the Russian vision, the Greater Eurasia Partnership).

“In terms of Big Power politics, Iran’s “Look East” policy was devised by Khamenei, who fully vetted the Iran-China comprehensive strategic partnership worth $400 billion, which is directly linked to the Belt and Road Initiative. He also supports Iran joining the Russia-led Eurasia Economic Union (EAEU).

China will be investing in Iranian banking, telecoms, ports, railways, public health, and information technology – not to mention striking bilateral deals in weapons development and intelligence sharing.

On the Russian front, the impetus will come from the development of the International North-South Transportation Corridor (INSTC), which directly competes with an east-to-west overland corridor encompassing Iran, Iraq, Syria and Lebanon.”

Are these developments just a natural outgrowth of developing nations looking to diversify through trade and economic expansion or are they seeking economic and military dominance? We don’t know. What matters here is how the US reacts to developments around the world and how it impacts us at home.

We have already seen a much bolder stance coming from China and recently Russia in face-to-face meetings with administration officials. And the restarted nuclear talks with Iran are either making good progress or falling apart depending on which news source you read.

In many ways, this feels very much like a reversal of the late 1980’s when the US was able to collapse the weakened USSR by forcing them to focus on geopolitics and military power instead of building a stronger economy.

Back then, the US did very little trade with Russia which, because of their closed economy, was eventually unable to fund their political and military ambitions.

However, China is a different story. It was long believed by our government that opening trade with China would result in a kinder, gentler, and more “democratic” Chinese government. Today, the US is still China’s largest trading partner making up 17.5% of China’s exports, including, as we learned during the lockdowns, goods and materials critical to many of our industries. So, thanks to us along with much of Western Europe, China is in a much stronger position for an economic battle.

Inflation

Here’s an interesting thought exercise for all of our clients who are homeowners. If you have owned your home for the last ten years and it is appraised for sale at a higher price than you purchased it, is it actually higher in value, or is it simply that a dollar won’t buy as much house as it did ten years ago?

After nearly a decade, a day does not go by now without at least one article about inflation hitting our screens.

Inflation eats at surging U.S. pay with Biden plans at stake – Bloomberg. Americans are enjoying outsized pay boosts this year from desperate employers, but the raises are failing to keep pace with surging prices for everyday goods.

There is no question that we have seen significant price increases over the last six months. Lumber had become a hot commodity, with home builders like Wisconsin’s Dave Belman posting pictures of what a difference a year can make.

Chalk it up to the law of supply and demand. Demand for lumber from single-family housing construction was outpacing existing lumber capacity and driving gains in lumber prices. Meanwhile, the supply of lumber was limited due to the shutdown of the economy. But as many states begin to resume economic activity, we are seeing the price of lumber recede from the most recent highs.


We are seeing similar behavior in other commodities as more production comes online and pipelines begin to fill up.

The big exception is in the energy sector where everything continues to climb:

But again, this price action can be explained by supply and demand. In the first six months of a new administration, daily U.S. oil production has fallen by 1.715 million barrels from a year ago. One of the first acts of the new administration was to cancel the Keystone XL Pipeline project, which would have brought crude oil down from the oil sands of Canada to the Gulf of Mexico. The administration also ended drilling licenses in the Arctic National Wildlife Reserve and stopped new drilling on federal lands, thereby making it harder to drill, transport, and produce oil.

As a result, energy futures, which are forward-looking, are reflecting a sentiment that the supply of oil will not be able to keep up with demand. Therefore, they indicate that oil will be even more expensive in the days to come.

Price increases are the consequence of inflation. They are not inflation itself.

Instead, price increases may represent a temporary imbalance between supply and demand as we pointed out above.

In classical economic terms, inflation occurs when the real purchasing power of a currency declines. Your home price, as noted above, has most likely risen in dollar terms. The utility of the home has not changed, it just takes more dollars to buy it. But we’re certainly happy with the price appreciation, as it makes us feel “richer” even though a quick search on Zillow would tell you that many other people are experiencing the same “gains.”

The purchasing power of a “consumer dollar” in an average US city.

The pandemic has led authorities to create an enormous amount of money.

However, for all that money printing to have an inflationary effect, it requires the velocity (or turnover) of that money to increase. Meaning that once the money gets printed, it needs to be spent so that it flows through the economy. For quite a while, including right now, that hasn’t been happening.

The pandemic and ongoing lockdowns struck fear over their health into the hearts of many Americans. They also created widespread financial fear in the hearts of many people who, instead of spending the stimulus money they received, either increased their emergency reserves or paid down debt. As a result, the money was neither spent nor lent. While we applaud increasing reserves and paying down debt, neither action does anything to “inflate” the economy as all that money creation was intended to.

Make no mistake, the Federal Reserve and the U.S. government want inflation.

Why? Because with the U.S debt-to-GDP level hovering near a record 130%, they need it.

There are only three ways to reduce government debt, raising taxes, reducing spending, or erasing it through inflation. While the administration appears anxious to raise taxes, they know that it’s impossible to raise taxes enough to pay off the debt without bringing the economy to a halt, much the way the lockdowns did. As for cutting spending, please don’t get us started.

Therefore, inflation is really their only viable option. Inflation reduces the value of cash; causing the value of the debt as a whole to decline. As inflation increases the Gross Domestic Product (GDP), the debt shrinks in value and becomes easier to pay. In 1946, the debt to GDP ratio was 108.6%. Inflation over the next decade reduced this ratio by about 40%.

Looking once again at the M3 chart above, we can see that since 9/11, the Fed has been trying to create inflation to stay ahead of the government’s deficit spending.

Unfortunately, as is the case when most economic theories are actualized, people are not behaving as the theories expected. Nonetheless, we do not expect the government to give up. Consequently, inflation will eventually raise its ugly head. When it does, we will be ready.

One thing to keep in mind, as Marc Lichtenfeld, author of “Get Rich with Dividends” and “You Don’t Have to Drive an Uber in Retirement” recently posted:

“… along with hard assets such as oil, natural resources, gold, silver and real estate, by investing in the right dividend stocks, we can keep up with inflation and prepare for retirement without the worry of losing it all to market volatility.

For starters, most dividend-payers are mature, stable companies that are often leaders in their field. And second, in many cases, their dividend payments handily beat the rate of inflation.” When we buy shares in stable, dividend-paying companies, not only are we investing in a stock that’s delivering steady share price appreciation…we’re also getting additional income in the form of regular dividend payments.

This not only helps us prepare for retirement but face the ever-present danger of inflation, as well.”

Therefore, when we consider periods of higher inflation, we are not really talking about making large, structural changes to our strategies, just ensuring that the mix is appropriate for the economic environment.

Are you an investor or a speculator?

We know that we can sound like a broken record on this topic, but we also know that many of you are constantly bombarded with news and emails about buying high-flying tech stocks, heavily shorted meme stocks like GameStop (GME) and AMC Entertainment (AMC), or crypto currencies to capture exceptional gains. The fear of missing out (FOMO) is a powerful emotion.

Good, stable companies that pay dividends at an increasing rate are boring and rarely make the news, which, as investors (not traders or speculators), is what we want.

Which brings us to a final point on returns. We are all human, and it is human nature to try to find something that measures success. We push our kids to get straight A’s thinking that is a measure of their intellectual growth. We track our handicap in golf and our bowling and batting averages to measure our ongoing improvement. Just like you, we feel good when we look at our investment statements and see more money in the account than the period before.

But our goal shouldn’t be to have beaten the market every time we look at our account statement.

Rather, we should be looking to build a portfolio of businesses that will stand the test of time due to the nature of the business and industry. And by test of time, we’re talking about years, not the next month or 3 months or even 12 months. On top of that, we should be attempting to become owners of those businesses when the price is attractive. That is how we believe a portfolio should be built and assessed.

Speculators, on the other hand, aren’t thinking about the long term or the value of the business all that much. Primarily, they are making decisions based on what they believe other speculators might be willing to pay for the security in the not-too-distant future.

We end up with two different sets of viewpoints operating in the market. The investors will take a pass on the speculative companies that are trading on narratives that can’t be effectively analyzed. For their part, the speculators avoid the “boring” companies (often with solid balance sheets and high profits) that lack an exciting hyper-growth story. The result is two very different market segments with very different valuations existing, side by side, in the same market.

In any given month, quarter, year, or even decade, these two groups are competing for supremacy. When the speculators are in the driver’s seat, the stock price of many companies that do not fit our criteria will raise the market to ridiculous levels. During those times we will likely underperform the averages.

Companies, too, can take advantage of a frothy market. As noted in a recent post by Bloomberg (Investors Will Buy Anything Now – Bloomberg ), since the end of March alone, nearly 100 unprofitable companies have sold more of their shares on the open market. Every share sold raises funds for the company but also dilutes the ownership stake of the existing shareholders.

Over the past 12 months, some 750 unprofitable firms have sold shares. They are diluting their current owners’ stakes while valuations are high, investors are flush with cash, and speculation is rampant.

If we need to buy shares in companies like these to beat or even just compete with the broad market, we will gladly accept our lower returns.

As we have mentioned in conversations, if you really have an itch for speculation, we strongly suggest that you open a small trading account with which you can apply some of the ideas you are bombarded with each day. We are always happy to discuss such strategies with you and provide educational resources to help you make it a successful pastime. However, we will also remind you that this is not investing, and that success can be fleeting.

In closing

Finally, for those of you actively logging into your Summit Client Portals you will see the enhancements that have been made in hope that the information is more transparent and informative. The portal also gives you access to your quarterly reports and client letters as soon as they are posted instead of waiting for the mail to arrive.

We have now launched a mobile version of the portal so that you can access it on your Apple or Android phone. We have had several clients begin using the app and, so far, the feedback has been positive. If you would like to have this ability, please contact us and we will get it set up for you.

We leave with you with our best wishes for a happy and pleasant summer.

Read More
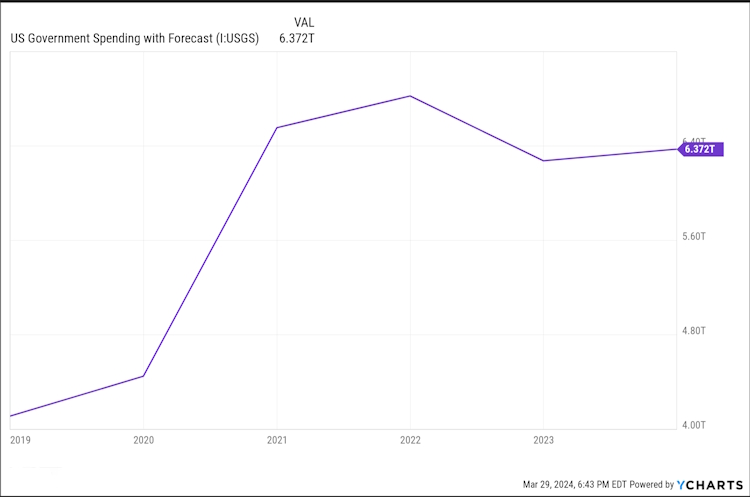
Getting Started Investing for Young Professionals

Or: A $0.75/hr Raise Is Worth More than You Think!

In addition to our traditional investment management services, Summit offers a computer guided or, as it’s sometimes known, Robo investment option at a correspondingly lower management fee. Many of the clients electing to utilize our Robo service are relatively young and many are just starting out on building wealth through investing.

If you’ve given any thought to investing, you’ve probably heard the following advice:

  • Start when you’re young so that you can take advantage of the power of compounding
  • Set up a regular contribution and automate it, if possible, to avoid the temptation of spending your investment dollars on something else “just this once”
  • Be sure to take advantage of your employer’s match of your retirement contributions, if they offer one, as it is “free money”

All of those things are true and important. You’ll get no argument from me on any of them.

But, one question that they don’t answer is: “How do I get started?”

Start Investing Pictured as Pennies Turning into DollarsHere is one great way to get started. The next time you have the happy experience of being called into your boss’s office to be told you’re getting a raise, do this. Forget about it. That’s right, you should go home, celebrate a little, and then forget about the raise, except to arrange to have the additional income invested on an ongoing basis. You are living on a budget with your current income already, just continue on and spend that extra income on your future self. Let’s put some flesh on those bones and see what could happen.

How To Turn an Extra $0.75 into a Whole Lot More

As an example, we’ll look at the case of a young (25 year old) professional, Carly, who’s currently employed and making $40,000 per year. Carly gets the news that she’s receiving a 4% raise for the coming year. That’s about $0.75/hour or $1,600 a year pre-tax, and probably about $1,200 after-tax.

While being able to spend an extra grand or so on clothes and going out would be nice, it won’t make a real difference in Carly’s lifestyle. So, let’s see what could happen if Carly were able to invest that amount and make an 8% annual return (to put that assumed return in context, the stock market has returned just over 10% on average annually since 1926).

Monthly investment: $100 (i.e. $1,200/year = $100/month)

Rate of Return: 8%

Years to Retirement: 42

Value at Retirement*: $414,896

*Source: https://www.investor.gov/financial-tools-calculators/calculators/compound-interest-calculator

Personally, I find that pretty compelling. Over $400,000 for future you by investing less than 4% of your current income. And here’s the best part, you can do the same with all or part of next year’s raise, too. And the next and the next and so on.

“Cheap” Daily Routines Are Surprisingly Expensive

Easy Ways to Save Represented by Country Grocery StoreHere’s another way to provide for your future self: make a budget cut and invest it. Continuing on with Carly, she is so enthused by the numbers above that she decides that she wants to invest even more. She knows that she is spending too much every day on little things, like getting breakfast on the way to work. Every morning on her way in she stops at a convenience store and buys herself coffee and maybe an energy bar.

That costs her about $3.75 each day on average including sales tax.

She knows that she can get free coffee at the office. Maybe not as tasty but it still has caffeine. What can she save if she cuts out the morning stop? She usually works 20 days a month, so 20 x $3.77 = $75. $75 per month is three quarters as much as her raise, so that means her future self could have an additional $311,172 (bringing the total to over $726,000) in her account at retirement just by drinking different coffee (and cutting a stop from her commute also saves gas money, which we aren’t accounting for right now).

That $3.75 daily routine is very expensive when considered over the long haul!

Coffee is just one example of a potential source of investment funding. Maybe you don’t have a coffee habit or you’re already smart enough to drink office coffee. Either way, many of us have areas in our life where we spend more than we realize or need to. Take a few minutes to go through your spending habits and find one you could trim or eliminate without changing your lifestyle too much.

As we just showed, the amount you save each day doesn’t really need to be very much.

$3.75 every weekday adds up to $311,000 over the course of your career. What could you change to save $3.75 per weekday (or $2.65 including weekends)?

Of course, there’s no guarantee that Carly will make 8%. Nonetheless, the point is that with a little bit of planning and self-control, you can take charge of your future and make it better than it would be otherwise.

Go to the link above to experiment with your own finances to learn what you could accomplish. Your future self will thank you.

Or, just start investing right now with our robo option!

Read More

First Quarter 2021 Market Review

Into the Unknown

The stock market as measured by the S&P 500 ended the first quarter in positive territory as the tumult and chaos in Washington that marked the fourth quarter of 2020 gave way to fear and loathing as investors tried to figure out what will lie ahead for 2021 and beyond.

S&P 500 Price Chart Q1 2021

One thing that stood out was that the Nasdaq 100, while still ending up for the quarter, substantially underperformed the S&P, something that we have not seen very often. In fact, the move down in mid-February / early-March was enough to qualify as a technical retracement for those of us who still dabble in technical analysis.

NASDAQ 100 Price Chart Q1 2021

Much of the pullback was attributed to the 10-year Treasury yield which rose about 30 basis points in March (which makes the price of the bonds fall), as investors “reset expectations for how much they were willing to pay for pricey tech shares as higher rates and inflation concerns dominate the landscape,” according to market pundits.


iShares 7-10 Year Treasury Bond ETF Price Chart Q1 2021

However, panning out back out to mid-year 2019, it looks like interest rates are merely approaching pre-COVID levels as vaccines continue to be rolled out and consequently markets sense a return to “normal” activity.

iShares 7-10 Year Treasury Bond ETF 6/30/20 – 3/31/21 Price Chart

It appears that the underperformance in both Treasuries and technology could be a bit of an overreaction and not the beginning of a large-scale downturn. If interest rates begin stabilizing as they approach the 2% levels, it could be enough to calm investor fears and keep the algo traders from whip-sawing the daily moves as we slowly creep towards a broader economic reopening.

Our main concern, as always, is less about what just happened than what will happen next. We have spent a lot of time reading and researching, looking at facts and collecting opinions. This has resulted in more sleepless nights than we have had in a very long time as we contemplate not only what lies ahead for us, but also our children and future generations.

So, buckle up as we try to unwrap all this in a way that is logical and understandable.

Conflicting Messages

Will the market continue to climb or are we at the beginning of a meltdown, economic boom or bust, inflation or disinflation?

We have read many articles from knowledgeable people that make good arguments for all of those scenarios. As investors, our job is to sift through all the information and arguments and position ourselves for the most likely scenario while having a plan B and plan C in place if we are either wrong or, like last year, something comes out of nowhere to completely change the environment.

One thing we always look for when researching such a diverse universe of opinions is whether they are concluded with a pitch. For instance, one writer that we have followed since the late 1990’s has been writing exclusively that the Bull market will end in 2021 and a meltdown will ensue. And while his arguments are valid, and warrant consideration, each piece ends with a pitch for a new service that will cost more money over and above the fee we are paying for his current content.

So, without a pitch at the end, we will try to take you down a logical path for what we think we should be doing with our money at this time.

Economic Boom or Bust?

The Federal Reserve voted in March to keep interest rates unchanged. They also gave an upbeat forecast of economic growth. In effect, they are saying that they are willing to let the economy run “hot” and risk higher inflation to capture the benefits of stronger growth.

The Paris-based Organization for Economic Cooperation and Development expects U.S. GDP to grow 6.5% in 2021—more than double its December forecast of 3.2%.

J.P. Morgan Global Research forecasts volatile but strong global growth as economies reopen. Heading into the new year, J.P. Morgan Global Research analysts believe recovery, reflation, and rotation against the backdrop of accommodative monetary and fiscal support will set the backdrop for key market and economic calls for 2021. “Global growth will be below trend in early 2021, but the strongest global recovery in a decade will play out by the end of 2021 if the vaccine prospects play out as expected,” said Joyce Chang, Chair of Global Research.

Goldman Sachs research expects the $1.9 trillion stimulus package should suffice for a small positive fiscal impulse to US growth in coming quarters.

However, the hard data is still painting a picture of low inflation, weak job creation, high savings and only modest GDP growth going forward, the opposite of what the everyone expects.

First, let’s look at GDP. In our opinion, this is one of the worst measures of economic health ever invented because of its dependence on spending as an indicator of real growth and, as a by-product, wealth creation, which should be the goal of participants in a free market economy.

As an example, both I and my neighbor across the street mow our own lawns (I find the walking to be therapeutic and I accomplish something while walking). Now, each time my neighbor and I cut our respective lawns; we add nothing to GDP.

However, if I convince my neighbor to cut my lawn for $10 and I in turn cut his for $10, which would be a better deal for me since my yard is quite hilly with a lot of trees to cut around, we will create $20 in GDP according to the economists. No wealth is created; we just exchanged two pieces of paper and yet, hurrah, GDP has grown!

Keep in mind that when we discuss growth, we are talking about the year-over-year change in the metric. GDP, whether good or bad, is a measure of output. So, when they predict record growth, they are talking about a change in output. So, the logical question is:

“Compared to what?”

For instance, if I tell you my 1-year-old Golden Retriever increased his weight 100% over the past year, that is a lot different than if he was already a fully grown 8-year-old dog. So, where we started from is just as important as how far we’ve gone. A puppy growing 100% is no big deal but a fully grown dog growing 100% is quite a big deal.

According to the Bureau of Economic Analysis, Real GDP for 2020 decreased 3.5 percent in 2020 (from the 2019 annual level to the 2020 annual level), compared with an increase of 2.2 percent in 2019.

So, if we establish 2019 GDP as a baseline, GDP growth of 6% only gets us to an average annual growth rate of approximately 2.3% or close to what we saw in 2019.

For reference, GDP Growth Rate in the United States averaged 3.17 percent from 1947 until 2020, and according to many economists, a rate of growth below 2% is not strong enough to absorb population growth.

Instead of GDP, we prefer to look at more pedestrian numbers to give us clues of real economic activity. And right now, those numbers do not look very promising.

Even with some recovery occurring from May to December, the December 2020 level of employment was still down by 8.9 million jobs compared to the pre-pandemic February 2020 level.

If we go to TracktheRecovery.org, which is a project of Harvard and Brown universities, the latest estimates (accessed on January 20) point to 29.7 percent of small businesses closing from January 2020 to the end of December 2020.

According to the SBA’s Office of Advocacy (based on Census Bureau data), there are (or were) 31.7 million small businesses in the United States. So, applying that percentage of closures to the universe of small businesses results in an estimated 9.4 million small businesses closed.

Now, that would be up from the depths hit in mid-April when 44 percent of small businesses were closed. Also, we do not know how many of these businesses are closed permanently.

But the bottom line still points to an estimated 9.4 million businesses being closed – some temporarily and some permanently.

And these are not just small restaurants and taverns, according to the website Crunchbase, 628 manufacturing companies ceased operations.

The labor force participation rate (LFPR) is the number of people seeking work or working, as a percentage of the total population. In February 2021, it was 61.4% according to the Bureau of Labor Statistics.

Next, we look at the Current Population Survey (CPS) from the Bureau of Census which is a household employment survey that includes both business hiring as well as self-employed, farmworkers, unpaid family workers, persons employed by private households and workers temporarily absent from work without pay.

Total employment peaked in December of 2019 at 158,735,000 people working. As of the latest available data, that number stands at just over 150 million. Those numbers pay no regard as to the possible change in wages from taking lower paying positions just to be able to pay the bills.

So, while we are getting closer, there are still fewer people employed today than in 2019.

Here is another graph which shows how the current job recovery has been distributed:

Taking all of this in consideration, the economy is in many ways, a lot worse off than it was after the Dotcom crash or Housing Bubble. The recovery to date has less resembled a V-shape and more of a <-shape, where people and industries that could adapt to work from home or were deemed essential, grew their wealth in 2020 while those in the other category lost dramatically.

Based on these numbers and other data we follow, we believe that real economic growth is slowing now and will worsen as the year progresses. That’s especially true as several states continue to suppress their economies with lockdown restrictions due to the COVID -19 virus and the new administration in Washington begins to implement policies of higher taxes and more regulations including stopping new oil and gas exploration that will result in job losses as well as higher energy prices.

Regarding taxes, only twice in history has an administration raised taxes following a financial crisis, the Roosevelt administration in 1933 and the Obama administration in 2009.

In both cases, this resulted in an extended economic depression which economist John Maynard Keynes defined as “a chronic condition of subnormal activity for a considerable period without any marked tendency towards recovery or towards complete collapse.”

Unlike recession, depression is not negative growth, but it is below-trend growth. As mentioned above, historical growth is 3.17% including 2010 to 2020, so sustained periods of sub 3% as we have experienced over the last 10 years is a depression exactly as Keynes defined it. Looking at the graph below, we think we will see a spike similar to 2010 in the annual change (bottom graph), thanks to reopening and massive government stimulus, followed by a revision to where things had been trending (top graph).

GDP Growth 2000 – 2020

And while the administration is promising additional spending a new, multi-trillion dollar package focusing on infrastructure, we note that a similar, albeit much smaller package was passed in 2010 also intended for “shovel-ready” infrastructure jobs. While it provided a short burst of “growth” in 2010 as shown above, the growth proved to be unsustainable similar to the make-work programs in the 1930’s.

What this means is, in the absence of real economic growth, the government will have to rely on monetary policy to continue to prop up the reported growth numbers. This would just be a continuation of what we have been experiencing this century as much of the growth in the U.S. since 2000 is due to a variety of artificial inputs from increasing federal expenditures:

Note that the above chart does not include the military spending due to various interventions in the Middle East but does include several “bailouts” over the last decade which are a function of increasing debts and deficits or extraordinary monetary interventions. The chart below puts those various events on a timeline with the corresponding growth in real GDP.

As you can see, the Fed didn’t even try to unwind some of their programs until 2018 – 2019.

Based on where we are today and the current political climate, it would not surprise us if an absence of a real recovery in job and wage growth results in calls for a program of universal basic income, probably given a name like “Social Security for All.” or something similar. Programs like that are now being tried in the cities of Oakland and Stockton, California and are slated to be tried in as many as 11 cities around the country in 2021. This would of course result in even more government spending.

Now many would argue that an intervention-based economy is unsustainable due to the natural limits of increasing debt. You can count us in that camp, though Washington has been slowly coming around to accepting the ideas put forth by proponents of something called Modern Monetary Theory. Consequently, we need to understand what that theory is.

Modern Monetary Theory

We could write a book on MMT, but someone already has, her name is Stephanie Kelton. She was an economic advisor to Bernie Sanders’ presidential campaigns in 2016 and 2020. She also served as the Chief Economist to the Democrat Minority staff of the Senate Budget Committee from 2014 till 2016. The title of her New York Times bestselling book is The Deficit Myth (2020). If you want a deep dive into MMT, this book will do the trick although be warned that it is written by a proponent for using it as a basis for fiscal and monetary policy.

We will provide just an overview of the theory to give you context for everything that you are seeing and hearing coming out of Washington DC.

To start with the term “Modern” makes the theory sound like something shiny and new, however, according to an article by economist James Rickards, MMT has its roots in an economic theory called Chartalism that was advocated and expanded in the late 19th and early 20th century by an economist named Georg Friedrich Knapp. Chartalism relies heavily on European financial systems from the 19th century. So, there is nothing particularly modern about the concept.

According to MMT, money has value only because it is issued by the state and the state will only accept their money in the payment of taxes. Citizens “need” the state-issued money because they must pay their taxes. So, money is whatever the state says it is and has value because the state says it does.

Because the state controls the money, it can issue as much as it wants. So, when it comes to budgets, the state can run up an unlimited budget deficit by issuing more debt which will then be paid off by issuing more currency in a kind of “lather, rinse, repeat” cycle.

In this system, there is no limit to the size of the deficits, the size of the national debt or even interest rate costs because the state can always issue more money to cover the debt and interest. The only restriction on the state is that the debt must be in the same currency as the state is issuing. In the US system, the Treasury department spends the money and collects taxes while the Federal Reserve issues more money as needed to cover any differences between spending and tax collections.

For those who believe that the government can stimulate and sustain the economy, MMT is the perfect model because they are no longer constrained by spending limits and can spend as much as they need until the right amount of economic activity is achieved. Theoretically, since every dollar the government spends ends up in someone’s pocket, those dollars will eventually make their way into the economy and spur growth. So MMT establishes government as the source of money and, by extension, the true source of individual income growth and wealth accumulation.

Now, if your head isn’t spinning yet, you may be asking why the government would need to collect taxes if they can just issue more money to pay for the spending. According to MMT, you do not need taxes to pay for government spending. Instead, taxes serve three purposes:

1. To force citizens to accept government currency by forcing them to pay taxes in the same currency.
2. To reduce any economic imbalances by using the progressive tax code to address income inequality by taxing the rich and redistributing it to lower income individuals, and;
3. To fight inflation, instead of raising interest rates, the government would cool the economy down with a large tax hike.

You now have the “Reader’s Digest” version of the book (we know, we’re showing our age with that reference). MMT proponents think that there should be no limit on what the government can do for us once it is unencumbered by the notion of a balanced budget.

As you can imagine, there are plenty of arguments against MMT. A quick internet search will provide more posts than you will have time to read. Our job is not to convince you one way or the other, but to understand what MMT is, understand the implications of it on our financial lives and to try to navigate the investment markets to mitigate as much of the perceived risk as possible.

The first thing that jumped out at us when researching MMT for this letter, is that, like many theories, it is best suited for a closed-system where outside influences are easily controlled. In the case of an economy, that would mean that all factors affecting the economy are contained within that economy. In other words, all sources of production and service are happening under state control. However, if we didn’t know it before 2020, the pandemic made us realize how many essential products are manufactured outside of the US border. Personal Protective Equipment was suddenly in short supply here after China shut down their economy.

In fact, the top ten items we import from China include vehicles, iron and steel, plastics, clothing, furniture, toys, sporting equipment, power generation equipment and electrical equipment. This is from just one country; we import from all over the world. Under normal economic conditions, this should not be an issue. However, under MMT, we are introducing a risk that we have not had to face in most of our lifetimes: Inflation.

Inflation

When we refer to inflation, we are referring to changes in the purchasing power of a specific currency. Unless you chip off an ounce or two, a brick of gold does not increase or decrease in value. What does change is the amount of gold that your currency can buy at any point in time. We have seen sky high inflation in Greece and Argentina because foreign suppliers lost confidence in their currencies and demanded more of the local currencies in return for imported goods and services.

One of the conclusions that we have had to accept this past decade is that despite tremendous amounts of intervention and deficit spending, overall inflation as measured by the CPI has remained tame because of the strength of the US dollar throughout this time period. Money flows where it is treated best and despite our personal opinions of the economy, it was still much better here than the rest of the world. You could say that the US economy was the star player on a really bad team, to use a sports analogy.

Still today, investors all over the world consider the U.S. dollar to be a safe haven for their savings and, as long as this continues, the Federal Reserve can print as many dollars and backstop as many banks as they wish. Likewise, Congress can push through huge spending bills without any serious pushback from the bond market. The crisis comes when the world loses confidence in the U.S. dollar as a store of value.

That crisis still lies in the future. And it starts when there are not enough investors to satisfy the Treasury’s demand for borrowing dollars because a new safe haven has emerged. At that point, the cost of imported goods will rise, and we could see inflation wreak havoc on the economy in ways that we have not seen since the 1970’s.

Where might this competing safe haven be? Our obvious choice right now is China where Foreign direct investment into China surged 31.5 percent year-on-year to CNY 176.76 billion, or 34.2 percent to USD 26.07 billion in January-February 2021, China’s commerce ministry said on Friday. Foreign investment in the service industry soared 48.7 percent to CNY 141.74 billion during that period and accounted for 80.2 percent of the total FDI. Among the main sources of investment, FDI into China increased from the ASEAN countries (28.1 percent), the EU (31.5 percent), while FDI from the countries along the Belt and Road rose by 26.2 percent.

China Foreign Direct Investment March 2020 – February 2021

Another, more theoretical threat is the establishment of Special Drawing Rights (SDR) which is an international type of monetary reserve currency created by the International Monetary Fund (IMF). An SDR is essentially an artificial currency instrument used by the IMF and is built from a basket of important national currencies. The IMF uses SDRs for internal accounting purposes. SDRs are allocated by the IMF to its member countries and are backed by the full faith and credit of the member countries’ governments. The makeup of the SDR is re-evaluated every five years.1

The SDR was formed with a vision of becoming a major element of international reserves, with gold and reserve currencies forming a minor incremental component of such reserves. While this vision has never been realized, there are some economists who warn that the IMF has never lost sight of that vision and is ready to offer it as the new global reserve currency should the opportunity present itself.

At this point, we will keep our eyes on China as they are certainly lobbying to be the leading economic superpower in the 21st century and making their currency the new international reserve.

When does the world lose confidence in our economy and we see a run on the dollar? We do not know the answer. But we think that by staying vigilant and preparing for it now, we can put ourselves in the best position to weather the storm. When it happens, it will likely happen fast, and there won’t be much time to get out of the way.

So, with an environment of higher taxes, lower wages, more regulation and the specter of higher inflation returning, what does that mean for our investment strategies?

The Market

First, some good news. Even in the depths of the great depression, stock markets performed better than many people would believe. Below is a chart of the Dow Jones Industrial Average under FDR.

In fact, it is said that Keynes made a lot of money investing in stocks during this period. According to an article in Morningstar :

“He got rich from buying low and holding on during the 1920s through the early 1940s.”

Keep in mind that this was before the massive monetary interventions that we are experiencing today.

Additionally, analyst Marc Lichtenfeld, author of “Get Rich with Dividends” pointed out recently that:

“…owning the S&P 500 has been more than a hedge against inflation – it has created wealth.”

To his point, here is a 100-year chart of the Dow Jones Industrial Average adjusted for inflation:

Dow Jones – DJIA – 100 Year Historical Chart

The grey columns represent recessions. As you can see, the larger and boring industrials have increased investors wealth even after we account for inflation. However, it also points out why we prioritize distribution income over price returns. You would not want to be forced to sell your investments to pay your bills at the beginning of those downtrends. Instead, downtrends should be celebrated during pre-retirement as opportunities to buy great companies at a discount price and once in retirement should not be something that keeps you awake at night as long as the business fundamentals of your holdings remain intact.

Therefore, when looking at our investment strategies, we are reminded of a topically appropriate quote:

“When you’re fighting off the alligators, it’s important to remember that the mission was to drain the swamp.”

Despite all the distractions, including emails claiming to make a fortune on “just three stocks” (guess who’s really making the fortune there…), we need to remember the specific purpose we assign to each portion of our investment pool and stay the course with appropriate assets.

Overall, our goal is for our investments to provide cash flow to replace our paychecks when we no longer wish to collect one. As part of this, preserving our purchasing power over the long term is a priority.

While future inflation is a risk, we are still in a 10-year trend of deflation and, as we stated above, we do not know when that trend will reverse.

United States Inflation Rate 25 Year Chart ending February 2021

We know that slow growth is deflationary so while we may see some temporary spikes in inflation, we must ride the trend until is clearly reverses. The point is that now is not the time to “dump stocks and buy gold.”

Nor is it time to panic on rising interest rates. As we noted near the beginning of this letter, interest rates are only now approaching the pre-pandemic levels of 2019. We are a long way from the 1980’s.

We also still have trillions of freshly printed dollars moving around the economy looking for a place to go. This means that our “There Is No Alternative” (TINA) theme is still in play and should at least keep the major indices propped up even with periodic bouts of volatility that we should be all used to by now.

If we then apply solid fundamental analysis and include a portion of our allocation to other cash-flow generating assets that will perform well in both low growth and inflationary conditions, as well reasonable allocations to promising growth opportunities and even appropriate fixed income strategies, we should be putting ourselves in a position to achieve our long-term goals despite the short-term spikes in price volatility.

As the environment shifts, we too will shift. While we will continue to seek long term growth in distribution income, the components providing that growth will change over time as some businesses fade and others rise to take their place. We will also take advantage of growth opportunities as they present themselves while trying to avoid chasing returns that may be fleeting.

Read More

What is Financial Independence?

Typically, when I sit down with younger prospective clients I ask them for a series of goals based on 5-10-15-20 and 25 year time frames. One of those milestones is usually linked to the goal of becoming Financially Independent. When I ask them what it means to be financially independent, they usually respond with a lot of arm waving and something to the effect of being wealthy enough that they don’t have to work anymore.

When I ask how much wealth they think they need to not have to work, I will usually get a number between $2 and $5 million. That’s when I start telling them about people who have that much wealth and yet are not financially independent.

Financial Independence Represented by HomeBeing very sensitive about client information, I create a composite investor based on people I know or have known in the past. One of those people was wealthy by most people’s standards. She owned two businesses and had nearly a million dollars in investment property. She also couldn’t get a mortgage because she could not show enough income to prove to the bank that she was good for the loan repayment. Part of her problem was self-inflicted; a strategy to minimize income taxes resulted in many years of filing, really reporting, a very low income.

The other part of her problem was the result of her investment strategy.

Her investment property was speculative, meaning that she bought the property cheap in an area that was projected to grow substantially in the near future. The 2008 housing bubble delayed the near future by several years and the growth in developments in the area is just now starting to take off. Sometime in the future, she should be able to sell the properties to developers and receive a big payday, but for now she faces a choice.

She has to do one of the following:

Make drastic changes to her compensation

Sell some property to raise enough cash to purchase the home outright

Lower the mortgage value through a down payment so she can qualify

Give up on purchasing a new home altogether

No matter how she proceeds, these choices were not something she had planned on having to make as she grew her wealth. Financial independence is not based on wealth alone. Individual wealth needs to be structured such that your passive income will exceed your living expenses far into the future.

If you have a $2 or $3 million stock portfolio and you have to sell stocks every year to pay your living expenses, you are dependent on the market to be high enough that your annual sale doesn’t take too big a bite out of the holdings. You are not financially independent.

In my opinion, there are four distinct and often mutually exclusive purposes of an investment; they are to:

Grow Wealth

Store Wealth

Derive Income from Wealth

Protect Wealth

Too many people do not grasp this concept and as a result get out of balance with respect to the allocation of these four purposes. This can lead to disaster later in life when circumstances like a housing bubble or stock market crash magnify the imbalance and force choices that are essentially picking the lesser evil.

If your goal is to someday achieve financial independence, then it would be wise to sit down with your advisor to review and understand how your investments are allocated by purpose and whether or not that allocation is moving you closer to your goal.

Read More

How do you store wealth?

We define an investment as the allocation of capital to a specific purpose. The four key purposes of investments in building sustainable wealth are:

Protecting Wealth

Growing Wealth

Deriving Income from Wealth

Storing Wealth

In building a plan for achieving financial independence through the accumulation of wealth, it is important that these four purposes are kept proportional to your long term needs.

Of the four purposes, the idea of storing wealth is probably the most confusing for people.

Notice first of all that we are talking about how you store wealth as opposed to where. But first, as one of my partners always reminds me, perhaps we should answer the question of “why” you would store wealth before going any further.

Most people will accumulate wealth over their lifetimes by way of employment, investing, inheritance, etc. Some people will confuse this with “savings.” However, “Savings” is simply putting aside the net gains from your past production.

If you want to ever be financially independent, you need to produce more than you consume. When you set aside the excess, that is savings.

Saving creates capital with which you can invest.

However, what if you have nothing to immediately invest in? Or, let’s say that the something that you want to invest in requires a lot more capital than you currently have. In these cases, you will want to store what you have in a way that will insure that it will still have value or purchasing power in the future.

The most common store of value is money or cash.

Whether you put it in a savings account in the bank, stuff it in your mattress or bury it out in the yard, it will still be money after some number of years. In a period of inflation, however, the purchasing power of money itself will decline, undermining its function as a store of wealth. So, depending on your time frame and your immediate need, you may seek to store your wealth in other assets that at least will not lose, or would preferably increase in, value with inflation.

It might also make sense to store your wealth in something that could provide some utility while being used as a store of wealth. Your primary home is a prime example of such an investment for storing wealth. While many advisors will tout home ownership as a great wealth-building investment, the United States House Price Index MoM Change, which tracks the average prices of single-family houses with mortgages guaranteed by Fannie Mae and Freddie Mac in the United States, provides a more sedate view of home price appreciation since 1991.

US House Price Index 1991 to 2020

So while you could be lucky enough to buy at the beginning of a run-up in housing prices, it is better to think conservatively and consider your home as a store of wealth that also provides some immediate utility for you and your family along with potential protection against inflation. Should an opportunity arise to make an investment to either grow or derive income from your wealth, you can easily take out a home equity loan or sell your home outright as a way to convert it back to cash.

Other examples of storing wealth include investment in precious metals, jewelry, artwork and land. Some of these assets provide you with some level of utility while others do not. But in all of these examples, you are simply choosing to store your wealth in an asset other than cash.

Read More

Fourth Quarter 2020 Market Review

Back to the New Normal

Happy New Year!

Here is hoping that 2021 will be good to you and all of your loved ones.

Before we get into any great details, let’s get a few housekeeping items out of the way.

Thank you for responding to our mailing regarding the delivery of your quarterly reports. By opting out of the mailed, paper copies you not only help us control costs, but you also enable us to create enhanced features for our quarterly letter such as embedding links to articles that we may reference in our writing. So, while we will still write about key points of interest, we can add a link to some of the background material for those of you who enjoy keeping up with the latest news and research that we find.

Secondly, we are finishing up work on a substantial upgrade to the client portals. These improvements will include both more comprehensive reporting as well as more interactive features that will allow you to dig deeper into the details of the accounts you are tracking including any held-away accounts such as 401Ks. As we roll it out, we will be available to help guide you through any questions you may have to ensure that your experience is the best we have to offer. Additionally, for anyone who wants to stay with the current configuration, we can accommodate those requests.

Now to the markets.

Q4 ended about the way we expected with the major indices all touching record territory. The S&P 500 returned 18.4% for the year and 12.1% in the fourth quarter alone. It was a bumpy ride, with volatility driven primarily by the pandemic and the election, taking the S&P 500 below its 50 Day Moving average (Blue Line) in the month of October.

SP 500 Daily Chart Q4 2020

S&P 500 Daily Chart Q4 2020

If this looks a little familiar, we saw a similar market reaction in Q4 of 2016.

SP 500 Daily Chart Q4 2016

S&P 500 Daily Q4 2016

We believe that it was Mark Twain who said, “History doesn’t repeat itself, but it often rhymes.” The market that we work in today is far different than that of our parents or grandparents. Thirty years ago, Etrade was just getting off the ground with the idea of online stock trading and cable stations like the Financial News Network and CNBC were struggling for viewership. By 2000, over 140 online brokerage firms existed and the number of individual investors trading online exploded. Fast forward to 2020 and we now have mobile apps, led by Robinhood, which allow individuals to trade from their mobile phones. Additionally, as we have mentioned before, the big money institutions, investment banks, pension funds, mutual funds and hedge funds, have steadily incorporated algorithmic trading systems leveraging the speed and computational power of computers to try to front run the human traders to gain quick profits.

These technological advancements have led to an increase in market distortions which lead to an increase in short term market volatility. We do not expect this volatility to end so it is essential that we continue to focus on strategies that lead to the achievement of our long-term investment objectives. At the same time, we are trying to insulate our portfolios as much as possible from short-term market fluctuations that can lead to sleepless nights.

The major market indices finished the year strongly and were all positive for the year, despite the COVID-Crash in March. However, the positive results were largely due to the performance of a relative handful of stocks.

As we wrote in our last Quarterly Letter and in an insight post, the FAANGM (Facebook, Apple, Amazon, Netflix, Google and Microsoft), along with Tesla and vaccine-oriented biotechnology stocks like Moderna have driven the indices higher, particularly the Nasdaq 100 and the S&P 500. Many stocks have lagged far behind them. To further this point, we look at the market sectors, which were quite clearly split between winners and losers.

Select Sector SPDRs are targeted exchange-traded funds (ETFs) that divide the S&P 500 into 11 sector index funds. These sectors are communication services, consumer discretionary, consumer staples, energy, financials, health care, industrials, materials, real estate, technology and utilities. Taken together, the 11 Select Sector SPDRs comprise the S&P 500 as a whole.

Following the lows of late March, all 11 S&P 500 sectors recovered. For some, the bounce-back was much stronger than for others. Income oriented sectors (energy, utilities, real estate) mostly underperformed for the year, while technology was on top for the second straight year. The tech-heavy NASDAQ Composite gained a whopping 43.6% in 2020.

The sectors which outperformed the index were technology, consumer discretionary, communication services and materials. Surprisingly, health care was not on this list as some would expect, possibly due to the decline in highly profitable, elective procedures due to capacity demands (real or anticipated) from COVID-19 cases. Other sectors which underperformed were industrials, consumer staples, utilities, financials, real estate (driven by office and retail REITs) and energy.

Using sector ETF 2020 returns, the S&P 500’s dependence on just four of the eleven sectors becomes quite clear.

SP 500 Market Sector Growth 2020

But the performance story of 2020 is more than just sectors, as important as those were. To a lesser degree, it was also a story of size, with the market’s largest companies outpacing its smallest, as can be seen below.

SP 500 Market Cap Returns 2020

The good news is many of the non-FAANGM stocks pay dividends. In fact, Dividend payments to investors in the S&P 500 rose to a new record in 2020, up 0.7% to $58.28 per share from the previous record set in 2019, according to research from S&P Global. This marked the eleventh consecutive annual dividend increase for the S&P 500 index.

2020 Dividend Growth

The growth in dividends was due to a strong first quarter and a strong fourth quarter. While the dividend cuts received a lot of publicity, particularly in the big-name firms such as Disney, at the end of the day we ended up with record dividend incomes.

In 2020, there were 423 companies on the S&P 500 that paid a dividend:

287 companies raised dividends

11 companies initiated dividends

27 companies cut dividends

42 companies suspended dividends

At the end of the year, there were over 61 companies that not only pay dividends but have increased them annually for at least 25 years. These are referred to as the S&P Dividend Aristocrats. We point this out in the context of an economy that is being ravaged by pandemic lockdowns to help you understand our philosophy when it comes to investing.

As you all know, one of our favorite stories is set in 2008 when Coca-Cola’s stock price was crashing from its 2007 highs. The company raised its dividend over 12% rewarding investors who bought the “business” with an increase in cash flow. As we see in the chart below, the price eventually recovered and set new highs.

Coca Cola Monthly Stock Chart

KO Monthly Stock Chart

In case you were wondering, Coke was one of the companies that increased their dividend in 2020.

We saw above that the market favored large cap stocks in 2020. Another way to see this is by looking at the performance of the S&P 500 which is market capitalization weighted (meaning the largest companies affect the index the most) compared to an equal weighted S&P 500 (meaning every company exerts the same influence).

In the chart below, we see that the equal weight index began out-performing the market cap weighted index in the fourth quarter, which we see as an indication that money is starting to be deployed more broadly across areas of the market outside of large caps and technology. It is our belief that this broadening bodes well for longer term price recovery in those areas of the market.

SP 500 Equal Weight Index Returns

Read more about how the S&P 500 Equal Weight Index is constructed.

Looking Forward

We believe that the purpose of investing is to build and manage wealth which we define as having the ability to pay our living expenses without the need of an employer’s paycheck.

This viewpoint is why we constantly remind you that our focus is on cash flow versus rates of return. We have little control over rate of return, no one does. Cash flow is generally more reliable and certainly more manageable. In pursuing this, we spend our time and effort finding those investments that we believe will provide the relatively safest and most reliable cash flow in the existing economic environment. These strategies are actively managed and we spend most of our time screening our portfolios, adding those businesses that offer the best long term opportunities while culling any that show signs of faltering.

We do pursue capital gains through various trading strategies and in doing so, we tend to be trend-followers versus market-prognosticators but still always pursuing the strongest businesses or fundamentally sound funds that will benefit from the trend.

We believe that 2021 will see a return of market / economy dichotomy that baffles financial pundits while enriching those who see and act on the big picture. The housing bubble of 2008 left the economy in shambles, home values in many cases dipped below mortgage balances. Labor Force Participation, which we think is a better indicator of real employment, was starting a precipitous slide toward 1970’s levels.

US Labor Force Participation Rates 1975 to 2016

Gross Private Sector GDP (the private sector economy) severely declined.

Gross Private Sector GDP 1950 to 2020

We kept waiting for the “Mother of all Bear Markets” to wipe out the nation’s wealth so that we could buy great companies for pennies on the dollar. Instead, we saw a combination of quantitative easing (QE) programs, I, II, III, and IV, ZIRP and the threat of NIRP flood the markets with unprecedented amounts of cash. This tsunami of cash led to one of the longest bull markets in history.

SP 500 Monthly Chart 2008 to 2018

S&P 500 Monthly Chart 2008 – 2018

In fact, the correction that ended the bull run in 2018 was in part blamed on the Federal Reserve’s attempt to “normalize” interest rates in line with the strength of the US economy.

Fast forward to January 4, 2021 and the economy is in far worse shape than it was in 2008 and as I write this from my office in California, the Governor has, for the third time, changed the conditions for reopening the economy which leads us to believe that we will be locked down well into the summer. Yet the markets are sitting near new highs and with nearly $7 trillion in stimulus floating around combined with our TINA (There Is No Alternative) view of the markets, we expect to see stocks go much higher for much longer than any rational economist could imagine.

This is why we chose our title; it was during the last market / economic dichotomy we were told that this was the “new normal.” Whether it is the old “new normal” or a new one doesn’t matter. What matters is that we pay attention to what is happening and act accordingly in order to take what the markets are willing to give us.

Will the ride be a smooth one? We doubt it, there are always speed bumps along the way and they need to be monitored with the utmost vigilance. Delays in vaccine distribution or adverse reactions to the vaccines, a sudden and sustained rise in inflation and a resulting rise in interest rates, or changes in policy stemming from a new administration could imperil the short-term market performance. In the long run, these “speed bumps” should provide buying opportunities for long term investors trying to build wealth.

As always, we will be with you all the way, staying vigilant on anything that poses a threat to your objectives and looking for the best combination of strategies that will fit the changing environment.

Read More

Donor Advised Funds or Private Foundations for Charitable Giving?

This time of year is known in some circles as “the season of giving” where people are not only buying gifts for friends and loved ones, but also making end of year charitable contributions in support of their favorite causes.

Over time, people whose charitable urges become philanthropic find that it makes sense to create a vehicle for their philanthropy in hopes that the giving can continue in perpetuity as part of their legacy.

Two popular legal structures for philanthropic giving are Donor Advised Funds (DAF) and Private Foundations. While both entities are perfectly fine for charitable giving, there are some differences between the two entities that could make a difference depending on your situation.

What is a Donor Advised Fund?

At its most generic level, a donor-advised fund (DAF) is a charitable giving vehicle administered by a public charity created to manage charitable donations on behalf of organizations, families, or individuals. Donations can be made by individuals, families, companies, public charities, estates, trusts and even private foundations. Contributions to a DAF offer immediate tax benefits.

What is a Private Foundation?

A private foundation is an independent legal entity set up for solely charitable purposes. The funding for a private foundation typically comes from a single individual, a family, or a corporation, which receives a tax deduction for donations.

Private foundations are classified as tax-exempt, 501(c)(3) organizations by the IRS. However, while a public charity gets its funding from the general public, a private foundation usually has one source of funding, typically an individual, family, or corporation.

If the two structures sound the same, it is because in many ways, they are.

But the differences can be very important depending on the donor’s situation as well as which organizations you choose to work with:

Starting up a DAF is very simple as most providers have on-line sign-up. To set up a private foundation is more involved and may require legal and accounting help which could run into thousands of dollars. Ongoing costs also differ, with charges from the DAF sponsor generally 1% of assets or less while a private foundation will need to pay for ongoing legal and accounting services.

A private foundation is a legal entity which is under complete control of the founder, while a DAF is under the control of the board of the public charity administering the fund. This can be mitigated by choosing an unaffiliated public charity founded exclusively for the purpose of sponsoring DAFs that allow for a much broader offering of causes to support.

Private foundations can own nearly any type of asset while DAFs are typically limited to cash, marketable securities, life insurance policies, and real estate (unencumbered by a mortgage). We ran into this issue a couple years ago with a client who wanted to donate a collection of very valuable musical instruments. To use a DAF, the instruments would have had to be auctioned off first with the cash proceeds going to the DAF.

Apart from the type of acceptable assets, the tax deductibility of contributions is also subject to different rules.

For a DAF, deductibility of cash gifts can be deductible up to 60% of AGI with the contribution of publicly traded securities deductible up to 30%. A private foundation has deductibility limits of 30% and 20%, respectively. For non-liquid appreciated assets, a DAF has an upper limit on deductibility of 30% of AGI versus 20% for a private foundation.

Depending on the sponsoring public charity, DAF’s can be funded with virtually nothing. Establishing a private foundation will usually require funding of around $250,000.

Members of a private foundation can be reimbursed for expenses incurred while carrying out foundation activities, this would be beneficial for donors who are actively engaging in the charitable practices. With a DAF, there is no such expense benefit for the donor.

While a DAF is generally limited to making grants to U.S. charitable organizations or government agencies such as state universities, public school systems and park systems, private foundations have an almost unlimited amount of donation choices including individuals and families that might be facing financial hardship, direct loans and loan guarantees, scholarship, and award programs and even their own charitable programs.

Private Foundations can hire staff and family members to work for them. Hiring and compensating staff is under the control of the sponsoring charity for DAFs.

Private foundations can negotiate special terms and conditions for their grants to make sure their funds are used in accordance with their wishes. DAF donors have no control beyond which charities the money goes to although some charities will give you choices of where the money will go and what it will generally be used for.

A private foundation is required to make an annual distribution equal to roughly 5% of its prior year’s average net investment assets. Distributions that count toward this requirement include grants to charities, certain related expenses, and, except for investment expenses, necessary and reasonable administrative costs (including Foundation Source’s annual fee). By comparison, there is no mandatory annual distribution requirements from DAFs, so donors can delay making grants from the fund and allow the assets to grow over time through an appropriate investment strategy.

Contributions, once received by the DAF become the property of the DAF, so while you can stop making contributions if your priorities have changed, you do not have the ability to move the money to another organization or entity, private foundations can eventually be converted into a DAF if the donor desires.

Lastly, all information regarding the activities of a DAF is combined into the reporting of the sponsoring public charity. There is no requirement for a tax return. A private foundation must file an annual form 990-PF which is publicly available and which discloses detailed financial information.

In Summary

A donor advised fund is a charitable investment account that can provide a simple, flexible, and efficient way to manage your charitable giving. Donors can start with a more modest investment, make grants on a more flexible timetable, and build a charitable legacy over time.

Private foundations are more expensive to create but provide the founder with 100% control over grant and investment choices, allow for a wider variety of funding choices, provide opportunities for expense reimbursement and staffing compensation associated with the foundation and greater flexibility for the future.

DAFs are growing in popularity and are a great option for many people, but high net worth families, especially those with substantial philanthropic ambitions would be wise to at least consider a private foundation before making a final decision.

Read More

The Piggy Bank Portfolio

By the time your child reaches age eight, there is a chance that they may have started to accumulate some savings and might even have a savings account at a local bank or credit union.

Child Investor Watch DisneyWith the standard bank savings account paying only 0.01% (yes, 1 one hundredth of a percent!) and charging fees for accounts with less than certain minimums, the only positive lesson your child can glean from having one is that at least their “savings” are safe (except for the corrosive effect of inflation).

A different option to try instead is to open a custodial account with a discount broker and use those savings to buy stock in companies that your child likes.

The goal here is not to double their money in one year or turn one hundred dollars into a million, but to teach them the concept of business ownership and how they can participate in the success of a business. In many cases, you may not be buying them at the most “opportune time” based on different market fundamentals or measures. Those things don’t matter here, you are “investing” in an education that they are highly unlikely to get at any school they attend (including most colleges).

You may be surprised to find out that your child is a better stock picker than most money managers.

They know what products and services they like and dislike and quite often those trends are popular not only with kids but with investors in general.

As an example, let’s say your child plays with Transformers or Barbie, wears clothes bought from Target while eating Cheerios for breakfast, an occasional Happy Meal at night while watching shows streamed on Netflix.

Transformers and Barbie are made by Hasbro (HAS), Cheerios are made by General Mills (GIS), the Happy meal is from McDonalds (MCD), and both Target (TGT) and Netflix (NFLX) are listed on the New York Stock Exchange and the Nasdaq respectively.

If just five years ago you had created a portfolio with one share of each of those five stocks, according to Yahoo Finance, on 10/30/15, your portfolio would have been:

Five-Year Results 10/30/2020:

Not bad for a kid!

Of course, you don’t have to buy all five stocks to make this work. When I was growing up, my grandfather bought me one share of one company, the one he worked for, and I was thrilled to be one of “his bosses!”

This is a great opportunity for your child to “get paid to learn”. I would suggest looking at the broker statements with your child every 3 months to see how their companies are doing. Checking them more often than that can create a level of impatience as many stocks don’t move very much week to week or even month to month.

I also want to direct your attention to the Dividends Received column. Too often we tend to focus on the stock price, which is what people on television will talk about.

One of the benefits of owning a successful business is sharing in the profits.

Many public companies, like four of the five above, let you share in the profits by paying dividends to the owners and make no mistake, your child is now one of those owners. In my experience doing this with kids, I have found nothing gets them more excited than to see money showing up in their accounts.

Have fun with this and let the stocks they pick mean something to them.

Do they have a relative that works for a company that issues stock?

Do they have a favorite food, movie, or toy?

What would they would make if they owned a company?

Again, the idea is not to pick stocks that double your money overnight but to identify businesses they’d like to own and to teach them how they can become owners and how their ownership can be rewarded.

Read More

Playing to Learn

How to Use Family Game Night as a Financial Teaching Moment

Our youngest daughter loves to play board games. She started off with the classic games like Chutes & Ladders and Candyland and soon moved up to games like Sorry, Stratego, checkers, Clue and even more strategic games like Othello, dominoes, and backgammon.

Her favorite game by far is Monopoly.

Monopoly Board as Tool for Teaching Children Financial ResponsibilityShe started with Monopoly Junior Party, which is still her favorite, but will play classic Monopoly if it means Mom and her big sister (who does not like board games) will join in.

When first we started playing Monopoly Junior Party together, I explained to my daughters that the parties we were buying were just like the different birthday party events that they attended with their friends and classmates. Each one of those places we visited, with bowling alleys, bouncy houses, and roller skating (not one of their favorites), were businesses that charged money so parents could have their parties for their kids without having to buy all of the necessary stuff themselves.

At first, I could see my youngest thinking about which parties she most wanted to own.

She wanted the parties that she personally liked the best. But as time went on, she started realizing which parties could charge the most. Whether it was by luck, skill, or a little bit of both, she started winning every time we played.

One day, while playing classic Monopoly with her big sister and Mom, an “Aha!” moment occurred. Big Sis landed on Park Place, owned by Little Sis and of course had to pay rent to the landlord. After counting out the $400 she owed, Big Sis angrily threw the money down and exclaimed,

“Look at that, she (Little Sis) doesn’t even have to pass Go anymore to win this game!”

At which point I reflexively stopped the game and congratulated her on finally realizing that is why we invest!

Whatever financial independence means to you; few will argue that it means you are going to have to live in a world without a regular paycheck from your employer. Your investments, whether you like it or not, will play an important part in providing your replacement income.

In Monopoly, “Go” represents a regular paycheck.

Investing for Children Represented by Monopoly PropertiesAnyone who has played the game knows that feeling of desperation when you’re hoping to reach “Go” without landing on an expensive property just to avoid going bust.

We have all seen those players that own so many rent-paying properties that they could stay in Jail the rest of the game and still win.

While there are many games that simulate financial reality such as The Game of Life and Robert Kiyosaki’s Cash Flow, I find the simplicity of Monopoly ensures that the important lessons don’t get lost in the myriad of rules and decisions that don’t really add any value to the game experience and can, quite frankly, turn off younger players.

One of my early mentors used to say that every interaction is a potential teaching moment, but too often that opportunity is lost. If you want to share some fun teaching moments with your kids or grandkids, unplug the wi-fi, pull out Monopoly, and let them learn the essentials of cash flow investing.

Read More

The Dividend Magnet Effect

Obligatory Disclaimer: This article is for illustration purposes only and in no way should it be considered as a recommendation for a particular stock, ETF or Mutual Fund. All investing involves the risk of loss.

Visa (V) is an example of a “terrible” dividend paying stock.

The current dividend yield, as quoted on Yahoo Finance, is just 0.61% (as of 10/20/2020). That means that $10,000 invested in Visa will generate a meager $61 of annual income for your account.

But does that make Visa a bad investment? A deeper dive into the data provides a little more insight into the true value of the stock.

Visa started paying a dividend of $.0263 per share in the 3rd quarter of 2008. In October of 2009, they increased the dividend by 19% to $.0313. In October of 2010, they raised the dividend another 19% to $.0375. In October 2010, the increase was 46%. In fact, since 2008, the average annual increase in dividends paid out to shareholders is 20.95%; certainly a very solid performance.

Why then, with nearly 21% average annual increases, is the yield still paltry and less than 1%?

The answer is that the price of the stock has risen faster than the rate of dividend increases, keeping the yield, which is calculated as the dividend divided by the share price, relatively low.


Visa Weekly Price Chart Versus Dividend Yield

While some will argue that the stock is being driven up by growth investors, its 5-year average rate of sales growth is only 12% and its 5-year average rate of earnings per share growth at 18% is very good. In comparison, though, according to the Stock Screener at Finviz.com, there are 491 companies sporting 5-year sales growth above 25% and 754 companies with 5-year EPS growth above 25% despite the COVID19 pandemic. The attractions of “growth” alone do not adequately explain the stock’s performance.

So, if the stock price is rising even faster than the dividend despite less than exceptional sales and earnings growth, what explains the stock’s strong price performance?

It may be that the price is being driven by something called the dividend magnet affect. In essence, the stock’s price return is simply following (more or less) the dividend payments like a bar of iron follows a magnet. In the case of Visa, the stock’s price return has averaged more than 28% annually over the same 5-year period.

We always hear about dividend investors and growth investors, however, there exists a hybrid category of dividend growth investors.

These investors seek out companies that are consistently growing their dividend payments. They are willing to pay up for future dividend growth, pulling the share price up in line with dividend growth.

This strategy of investing in dividend growers is not without risk. The company could have a year where the dividend is not increased at all or the increase is disappointing relative to expectations. In these cases, it would not be surprising to see the stock sell off. And, it goes almost without saying, that a dividend cut, or complete omission of the dividend, would be devastating. So, additional analysis regarding dividend safety needs to be done before one can buy shares with a reasonable level of conviction.

At Summit, we include a multi-dimensional analysis of dividend safety of all stocks under consideration for our dividend-based strategies before they are added to a portfolio. Even the most sophisticated analysis, though, will not be right every time, and there is always a risk of a dividend reduction. But employing a sound and thorough analysis, we believe it is possible to push the odds of success in our favor.

Read More
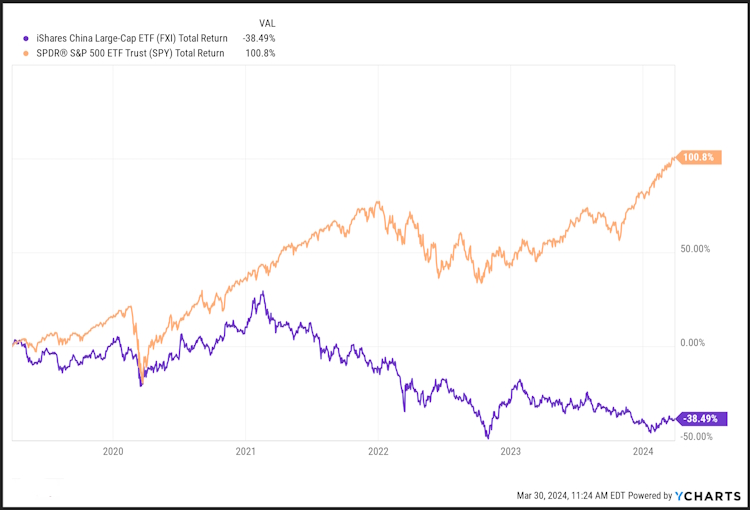
Hey Mom, I Just Bought Disney!

Through a combination of good timing and good fortune, our oldest daughter had visited Disney World in Orlando three times by the time she was six. Each trip had a different purpose and circumstance, but in her eyes, it was always magic.

About four months after her sixth birthday, she informed us that her savings bank (see Three Piggy Banks) was full and she could not put any more money in it. When we counted out the money in the bank it added up to just slightly over $106.

As we were discussing what we should do with the money, I brought up the idea of using her money to make more money through something we called investing.

I explained that when we invest, we are either starting a business or we are buying all or some part of a company. We discussed the idea of investing in her own car-washing business and what that would take to run, we then discussed investing in a bracelet-making business, a popcorn business and, of course, slime.

After looking at the time and effort it would take to invest in a new business, my now frustrated daughter/client asked me who would want to sell her their business. Jumping at the opening, I asked her if she would like to “own” the Walt Disney Company as she had enough money to buy one share (provided Dad covered the broker’s commission).

After taking some time to convince her that it wasn’t a joke, I went on to explain that while she could not own the whole company, Disney made it possible for even a 6 year old to be a part owner and receive benefits of owning a business even though she didn’t work for them.

So, about a week later, after opening her account and transferring the money, I brought home a trade confirmation showing that she was the owner of one share of Disney. She was so excited, as soon as my wife walked in the door, our daughter ran up and yelled “Hey Mom, I just bought Disney!” She wanted to take the trade confirmation to school for Show and Tell and, of course, started asking when we could once again visit Disney World so they could make more money.

While all of this was fun, the real magic came after the next quarter when I brought her statement home which showed a deposit of cash in her account. I explained that Disney had earned a profit and was sharing it with the owners of the business in the form of a dividend, I then showed her how that dividend had been used to buy more stock and that the payment would grow and grow until she decided that she wanted to use the money for something else.

While being an owner of Mickey’s company was cool, the realization that she could earn money without having to pick up her toys or clean her room was beyond joyous.

For the next several months, she began to look at the world through the eyes of an investor. She would ask who made my iPad, if Netflix sold stock, and if McDonald’s would be a good company to own. One day while shopping, she asked if Wal-Mart paid a dividend, because there sure were a lot of people in the store buying stuff.

Financially, the investment in Disney has been good, but not spectacular. Since she bought it initially, it is up only 21% on a price basis which is nothing compared to her later investments in Apple (up 260%), McDonald’s (up 117%) and Netflix (up 586%). But it was Disney that first got her attention so that she was eager to learn about this world of investing and the benefits of buying good businesses.

Whenever I get the chance, I love to speak at roundtable discussions about teaching kids about personal finance. When asked by a parent or Grandparent what they should invest in for the kids I will tell them that if they want the money to grow fast, invest in a basket of growth and income stocks from the S&P 500 and NASDAQ 100. But, if they want to inspire the kids to take an interest and learn about investing, start with Disney.

Read More
Third Quarter 2020 Market Review

Asset Allocation, Meet TINA

After erasing early losses and, in the case of the Nasdaq Index, hitting new record highs, the market, as measured by the S&P 500 Index, ended September in the red.

Talking heads will point to various issues including shutdowns, no additional stimulus, COVID19 spikes, and the election. The explanation could simply be that a small number of stocks that drive the returns of the S&P 500 and the NASDAQ indices just went too far, too fast and were victims of the long-honored tradition of profit-taking.

S&P 500 July-September 2020

Ever since the pandemic driven market melt-down earlier this year, we have been experiencing a price recovery in growth and income investments that is curiously uneven. To illustrate this, look at two popular ETFs and their performance so far in 2020. Below we see the chart for the SPDR S&P 500 ETF (SPY with a 1.8% dividend yield) versus the SPDR S&P Dividend ETF (SDY yielding 3.5%).

The SPDR S&P 500 ETF Trust seeks to provide investment results that, before expenses, correspond generally to the price and yield performance of the S&P 500®Index which holds large-cap companies across eleven sectors.

The SPDR S&P Dividend ETF seeks to provide investment results that correspond generally to the total return performance of the S&P High Yield Dividend Aristocrats Index which screens for companies that have consistently increased their dividend for at least 20 consecutive years, and weights the stocks by yield. Stocks included in the Index have both capital growth and dividend income characteristics, as opposed to stocks that are pure yield.

SPDR S&P 500 ETF vs SPDR S&P Dividend ETF

We addressed this earlier in the Market Insights post, “The Market is Up, Why Isn’t my Account?

In that article we wrote:

“As an example, the Dow Jones US Select Dividend Index (DJDVP) represents the stock performance of the US’s leading dividend-paying stocks and sports a current dividend yield of 5.15 % versus 1.86% for the SPX. The DJDVP is still down over 21% year to date.”

We use the term “curiously” when looking at these results because, at a time when 10-Year Treasuries are yielding less than 1%, we are now living in the age of TINA. Have you heard of TINA?

No, not Tina Turner…

On Wall Street, there are hundreds of acronyms that traders use every day:

  • DFTF stands for “Don’t Fight the Fed”
  • SIM stands for “Sell in May”
  • BTD is code for “Buy the Dip”

And P&D refers to the “Pump and Dump” practice of hyping a stock in the media before selling it in the market.

These days, there’s a new acronym, TINA, and it stands for “There Is No Alternative!”

Today’s market leaves investors with fewer options for protecting and growing their wealth. And it all ties back to the Fed’s aggressive zero interest rate policy.

TINA refers to the current phenomenon of investors allocating most of their capital to the stock market because of the lack of yield in the bond market. And this trend will continue for as long as the Fed keeps manipulating the bond market.

In the face of historically low interest rates, we would expect to see money flowing into financially strong, dividend-paying companies and Real Estate Investment Trusts. To date however, the money continues to flow into the tech stocks as indicated by the performance of the FAANG stocks as well as the Tech-heavy NASDAQ 100.

NASDAQ 100 Stock Index

It is frustrating to see a dividend-heavy account still down on a price basis. But, as long as we are vigilant and remain confident that the dividends paid by these investments will continue, we’ll be happy reinvesting at a higher yield. At some point, history suggests that investor demand for yield to replace that formerly provided by maturing bonds is likely to drive prices for the best run dividend paying companies higher.

Fourth Quarter Expectations

Just as we alluded to in the second quarter letter, we believe that short term volatility will be driven by two factors:

The virus

The election

The Virus

In our opinion, both subjects above could now be filed under the heading “Politics”. Depending on where you live and how much news you consume, the pandemic is either over, or just getting ready to get worse.

In our Q2 letter we wrote about the two key metrics for the virus: the infection rate, and the fatality rate. We said:

“The first thing most experts want to know about a virus is the infection rate (R0). This number tells them how many people in a population are likely to get infected.

“A simple internet search will show you that of the several thousand viruses circling the planet this very moment, most have an R0 of less than one which means that they are not very infectious. Regardless of what anyone tries to tell you, at this point in time the R0 for the Coronavirus is still unknown. There is simply not enough data to make a reliable determination.

“The other most important piece of information is the fatality rate of the virus. This number conveys the likelihood of someone who has been infected succumbing to the virus.

“Even dismissing other variables such as age, gender, pre-existing conditions, access to medical care, genetics and anything still to be determined as contributing factors, we do not have a clue what the real fatality rate might be.”

Remember we also wrote about a rule of thumb that the more infectious a disease is, the less deadly it usually is. That seems to be consistent with the data we have access to on the Covid19 virus.

While there is certainly much more data than before, we still do not know very much about the virus and the picture is becoming increasingly muddled. There continues to be ongoing debate over the testing methods, the reporting of cases, hospitalizations, deaths, etc. and very recently a Harvard epidemiologist published a paper regarding the sensitivity of the tests being used in mass-testing situations like college athletes who are being subjected to frequent, even daily testing.

“In three sets of testing data that include cycle thresholds, compiled by officials in Massachusetts, New York and Nevada, up to 90% of people testing positive carried barely any virus, a review by The New York Times found.”

Think about that for a moment! Many states, including California, have begun primarily using new case numbers as their benchmark for opening and closing their economies.

And then there’s Sweden which never locked down the way we did but, instead, invested resources to protect the most vulnerable citizens as more and more data became available.

While we certainly want to know more about this disease to protect and maintain our health and that of our loved ones, as investors the issue is the impact of the virus on the economy. We have all seen the meme going around about being in the sixth month of the two-week shutdown to “flatten the curve”. However, when it comes to the impact on the economy, this is no joke.

While employment has recovered substantially since the April spike, we see that unemployment is still stubbornly above February 2020.

US Unemployment Rate through August 2020

This is primarily due to public policy driven by data, as mentioned earlier, that the politicians are accessing where some states are fully reopened, some are still mostly closed, and most are sitting somewhere in between.

When highly populated states such as California, which until recently didn’t even allow haircuts for anyone other than elected officials, are severely restricting business activity, we risk prolonged and even permanent economic damage to the country.

Are these actions of state officials political in nature? It’s a hard argument to make when the two largest states, California and Texas, are controlled by different parties. We do find it remarkable how the goal of government actions has evolved from flattening the curve, to slowing the spread, to containment, to suppression, and now seems to be to stop the virus completely. It’s impossible to know if these changes can be chalked up to human nature and ignorance rather than an intentional desire to do harm for political advantage.

Regardless, just like the hyper-regulatory environment, lock downs and shutdowns throw a wet blanket on economic activity and growth. Economic activity is the driver of growth and prosperity which leads to higher valuations in the businesses that are effectively participating. Government stimulus spending can give a temporary boost to prices but in the long run that stimulus usually benefits a connected few businesses or industry sectors.

The only way to get back to the economic health and growth we have seen in the last four years will be to remove impediments of both state and Federal government overreach. Sadly, it’s probable near-term uncertainty will continue until progress is made in treatment and/or vaccines. Therefore, the short-term recovery will still depend largely on monetary policy (the Fed) and ongoing fiscal stimulus (the Federal government).

As stated earlier, we continue to work hard to identify those sectors that are least impacted by the current environment and then identify the strongest companies within those sectors for investment. Regarding REITs, we try to own those that will be able to collect a high percentage of rent due (for example, 90+%) rather a significantly reduced percentage (say 60%). While this may result in portfolio changes, we have found that many of the sectors and companies that performed well pre-pandemic are those that continue to deliver today.

The Election

We almost hate to write about this. In personal conversations I have told the story about my first election in 1964.

Walking to school, one of my classmates asked who my parents were voting for. When I revealed my ignorance, he explained that it was election day and that our parents were supposed to vote for president. Pretty much none of us in our little group had a clue and we quickly moved on to subjects that were more important to first graders.

Later that day, I asked my mother about it. She acknowledged that there was an election that day, that she and my father did vote, and that it wasn’t anybody’s business who they voted for. Voting was a private, personal choice and it was in everybody’s interest to keep it that way. Oh, how we long for those days! Many people are now so emotionally involved on the subject of politics that it is impossible to have a rational conversation on the topic.

We won’t go much further into politics as, just like the virus, we want to focus on what we can control, which is the construction of our portfolios. In our opinion (always subject to change), a Trump victory would continue to favor the financial, defense, construction, manufacturing, healthcare, pharmaceutical and traditional energy sectors. A Biden victory would favor alternative energy, education, financials, infrastructure, healthcare, and service industries. It would also favor large, multi-national corporations that could absorb the proposed corporate tax hikes as well as use an anticipated increase in regulations as “moats” around their businesses to protect pricing power.

Interestingly, Trump’s signature tax reform in 2017 lowered the corporate tax rate from 35% to 21% which was great for traditional corporations. But it made special tax shelters like REITs less attractive by comparison. REITs are not required to pay federal taxes so long as they distribute at least 90% of their profits as dividends.

Joe Biden’s tax plan would raise corporate taxes back to 28% and would more aggressively tax foreign income. It also is specifically designed to force large, profitable tech companies to pay more. All of this bodes poorly for the stock market. But it may not be such a bad thing for REITs. Their special tax status might once again be appreciated.

In either administration, we see a continuation of growth in the technology sector with a Biden administration favoring the large established companies such as Google, Amazon, Facebook and Apple while a Trump administration would continue to try to make it easier for smaller companies to compete.

So regardless of the outcome, which might make Bush vs. Gore look like a playground spat, we will be ready to make adjustments as needed to try to achieve the best possible long-term investment outcomes.

In conclusion, we expect short term volatility to continue as the pandemic and election news drive the trading algorithms into buy or sell mode with each new headline. But it is the long-term that we concern ourselves with.

Twenty years from now, neither of the Presidential candidates will be in office but a well-thought out investment strategy should continue to provide a reliable stream of income even if the world around us seems increasingly unreliable.

As always, we welcome your calls and questions and look forward to helping you through the next four years whatever challenges they may bring.

Read More

Know Your Numbers

This conversation actually happened in my office.

Visitor: “I need five million dollars to retire.”

Me: “When do you want to retire?”

Visitor: “In five years.”

I did some quick number crunching. Based on his age and an average life expectancy, he wanted to spend about $130,000 per year in retirement even though he was only spending a third of that amount now. When I asked why his expenses would triple in retirement, he had no real answer. It became obvious there was no reasoning behind it. The $5 million retirement fund simply sounded good to him.

He also indicated he had been spooked by the 2008-2009 market crash and had a very low tolerance for risk.

I explained to him that with only five years to work with, we would need a 26% annual rate of return to grow his account from its current size to $5 million. To put it into perspective, that’s more than double the historical return of the S&P 500. In order to make a go at that kind of return, we’d have to take on a lot of risk, far more than he was willing to accept.

When I told him this, his response was that it’s my job to figure out how to get him the amount he wanted without too much risk and that’s what I get paid to do. I don’t know who his current advisor is, but I wish them luck.

What is truly sad about this story is that exchanges like the above are often the extent of financial planning for many people.

The Retirement Environment Has Changed

I completely agree with the idea that retirement should not be based solely on age. I also believe it should not be based solely on a single number. Focusing on investment assets, like my visitor above, largely stems from a recent, although brief, point in time when 10-year Treasury yields were high enough to fund a “low risk” retirement.

From the mid 1960’s up until about 2008, you could convert a $1,000,000 stock portfolio into 10 Year Treasury bonds and collect at least $50,000 per year before taxes. It was easy to calculate the amount you needed to accumulate for retirement.

In September, 2020, however, the current 10-year treasury yield is 0.68%. Good luck trying to live on the $6,800 a million-dollar investment will generate annually. And even if you were to commit to 30-year Treasury bonds instead of 10-year bonds, you would still only generate about $14,000 a year per million dollars invested.

How Much Do You Really Need?

The focus needs to shift back to the lifestyle you want once you no longer have employer-provided income and benefits. The first step is to figure out how much money you will need yearly in retirement to support the lifestyle you desire.

You can (and should) figure this out immediately.

The difference between your annual spending amount and your retirement income (if any) is your retirement cash flow requirement. This is the amount your investments will have to provide to bridge the gap between your income and your expenses.

A Simple Process

The best way to get started is with your current spending levels. Many people envision a very different lifestyle in retirement. It turns out that retirement is not that different from your working life. You will absolutely continue to need food, clothing, and shelter. You will most likely eat out as often, go to movies, take vacations, and celebrate holidays as you do now.

And since you have a reasonable understanding of what these things cost today, your current expenditures will provide a good baseline for an estimate of what your living costs will be in the future. At this point, you should account for as much of your necessary, unavoidable monthly spending as possible (e.g. loan payments, fees, utilities, taxes, etc.) in order to see what your spending level is today.

Once you’ve done this, the next step is to start eliminating any line items you know will not be needed in retirement. One word of caution from personal experience: my parents originally thought that they would be able to get by with just one car but soon realized that wasn’t possible. You will probably find that some items cannot be eliminated but can be reduced. As a side project, this is also a good time to reflect on everything you are spending money on and ask yourself what you really need. Anything you can cut out today makes it easier to live an enjoyable life tomorrow.

Now Consider Your Retirement Lifestyle

Now that you have a list of things you will need to spend money on in retirement, it is time to add in those items that you want to spend on. For many, it is spending a few months in a warm climate, taking an extra vacation every year, or joining a country club. Some want a “fun car” for warm summer days or a remodeled house if living out retirement in the same home is part of the plan.

Whatever it is you would like to have or do while retired, add it in with a best estimate, even if it means getting quotes from local contractors. Better to get the numbers correct now than guess low and be low and unable to afford it in retirement.

Adjust for Retirement Income

After you have completed all the steps above, you now have a retirement budget based on your desired quality of life in today’s dollars. From these costs, subtract any known or expected sources of income that you are confident you will receive in retirement. These sources include Social Security benefits, pension and annuity payments, income from real estate rentals, even side or part time jobs. Just make sure that you can reasonably expect this income to continue well into retirement.

For example, let’s say that your current lifestyle expenses add up to $60,000 per year. You expect to receive $24,000 annually from Social Security and your spouse should receive another $12,000 per year. In addition, you have an annuity that will pay you $2,760 per year for the rest of your life.

Subtracting the income sources above from your anticipated annual expenses leaves $21,240. This is your net retirement cash flow requirement and represents the amount of money your investments will have to generate per year to provide for the lifestyle you desire.

Having determined your net retirement cash flow requirement, we can now focus on your accumulated savings and investment positioning to determine whether changes are needed to reach your retirement plans.

Determine Your Financial Independence Number

Continuing with our example, suppose you have a $250,000 portfolio of dividend-paying stocks yielding 4% in your IRA. The portfolio would provide $10,000 in distributions this year, just under 50% of the cash flow needed as calculated above. We can quickly approximate that a doubling of the amount in your investment portfolio or your investment return is necessary if you wish to retire this year, without having to deplete your principal through the sale of assets. Therefore, the size of the retirement nest egg you need, or your financial independence number, would be approximately $500,000 based on the current investment portfolio positioning.

Knowing your financial independence number, we can then look at different options available to close the gap between your Retirement Cash Flow Requirements and your financial freedom number. From here, we’ll put a plan together (with room for adjustments to spending, investments or retirement contributions) in harmony with your current situation and desired future.

Track Your Progress

Of course, none of this means anything without follow through. Just like with your overall health, your financial health needs annual check-ups. In any given year, you might change jobs, homes, or receive an unexpected windfall. All of these events would impact key numbers relating to your retirement and need to be accounted for.

At Summit, we call this your Annual Financial Snapshot. Just like many families have portraits taken every year to memorialize their changes through the years, we produce a snapshot of your current financial situation to keep up with your changing circumstances every year. The goal is to make sure that your finances are always in focus.

Additionally, we provide our clients with a “Projected Cash Flow” report every quarter to give clients a better understanding of the cash flow being produced by their current investment portfolio.

A survey by the Employee Benefit Research Institute showed that in 2020, only 44% of people said they had thought about how much money they will need to retire comfortably. More than half of respondents had not thought about it.

There is no reason for not knowing your financial health, any more than your physical health. With this simple process, you can restore order to your long-term plan and actively manage your path to a brighter retirement.

Read More

Civil Commotion and Your Insurance

Guest Article by Marco Briceno from The Starr Group, a Summit Pinnacle Provider

With the current state of civil unrest in the United States, you may be wondering if you have coverage in the event of a claim caused by either Civil Commotion or Riot. As is the case with most insurance questions, there are a few moving parts you and our clients should understand.

Learn what you need to know if you Own, Rent, or Invest in real estate by reading the full article on LinkedIn.

Read More

The Market Is Up. Why Isn’t My Account?

If you are confused about what is happening in the U.S. stock market right now, you are not alone.

After suffering a significant drop in March and April, the S&P 500 index (SPX), a very commonly-used benchmark for many funds and advisors, and what many people consider to be “The Market” has recovered from the crisis and pierced the 2020 highs established in February.

However, for many individual investors, the result is not the same for their personal accounts.

In many accounts, the answer is as simple as asset allocation.

Since the SPX is a stock index, only a 100% stock portfolio would even have a chance of matching the performance of the index.

In fact, a popular asset allocation model using Vanguard Mutual Funds that we track internally lags behind the SPX. This asset allocation model begins each calendar year with a 60% allocation to stocks split between US and foreign with the remaining 40% split between Bonds, Treasuries, REITs and Precious Metals. Hopefully, few people invested in such an allocation would expect SPX-like performance.

Even if you do have an account that is 100% invested in stocks, it may still lag for several reasons.

Remember that the S&P 500 is considered a large-cap stock index. According to S&P Dow Jones Indices, the index’s manager, a company must have an adjusted market cap of $8.2 billion to be included in the index. Additionally, the stock must trade (change hands from a seller to a buyer) at a minimum volume of 250,000 shares in each of the six months leading up to the latest evaluation date.

If your portfolio is allocated between a number of large, middle and small cap stocks, as many are, your performance will likely be different than the index and, depending on which stocks you own, it could vary greatly.

Another thing to consider is that the index has a cap-weighted construction. This means its components are weighted according to the total market value of their outstanding shares instead of being equally weighted as many stock portfolios tend to be, at least at initiation. Those components with a higher market cap carry a higher weighting percentage in the index. Conversely, the components with smaller market caps have lower weightings in the index. Therefore, the performance of the index will be heavily influenced by the performance of the higher-weighted components.

Taking a glance of the index this morning on the Marketscreener.com website, we see that the top ten stocks by weight make up over 45% of the index weight.

Top Ten S&P 500 Components by Market Weight

Looking at the performance of those top 10, you see that seven out of those ten stocks are positive year-to-date.
The top 5 stocks on the list belong to the group of stocks known as FAANGM (Facebook, Amazon, Apple, Netflix, Google (aka Alphabet), and Microsoft).

FAANGM’s share of S&P 500 market cap alone is 37.23% as of today.

In other words, because the S&P 500 is a market-cap weighted index, the performance of these six stocks drives approximately one-third of the movement in the index. If the FAANGM stocks move higher, the S&P 500 is most likely moving higher. If the FAANGM stocks move lower, the S&P 500 is most likely moving lower.

So again, if your portfolio is weighted similarly with these six stocks, congratulations. If it isn’t, then do not be surprised that it is not keeping up with the index.

To that point, the S&P 500 Equal Weight Index (SPW) is down 7.6% as of July 31 versus a positive 1.25% for the cap-weighted index (SPX). Examining the full roster of stocks in the S&P 500, we see that 300 of them are down for the year, so this would make sense.

The final and most important point is your chosen strategy, or the purpose for your investment selections.

At Summit, this is an important conversation with our clients as purpose drives expectations. If you are investing primarily as a source of income, then your stock allocation is more likely to contain a healthy portion of dividend-paying stocks. Only two of the above mentioned FAANGM stocks pay dividends. Any income derived from the other four would have to come in the form of capital gains.

Therefore, you would have many other stocks in your portfolio that do not necessarily match the performance of either the market cap weighted or the equal weighted indices. The performance of those investments, while serving the purpose they are intended for, could be disappointing on a Total Return basis when comparing to what you think is “the market.”

As an example, the Dow Jones US Select Dividend Index (DJDVP) represents the stock performance of the US’s leading dividend-paying stocks and sports a current dividend yield of 5.15 % versus 1.86% for the SPX. The DJDVP is still down over 21% year to date. So, you must ask yourself, are you happy that many of these stocks are still reasonably priced by historic measures, or are you keeping awake at night because the market is leaving you behind?

The point is, to be a successful, long-term investor, you have to construct a portfolio that aligns with your particular needs and objectives and then employ the proper benchmarks in order to accurately gauge whether or not the portfolio is actually performing as designed.

At Summit, we use risk tolerance based allocations to gauge account performance as we have found that volatility is something that impacts client emotional reactions to performance in the short-term while the particular purpose of the portfolio, be it growth, income or safety, impacts their satisfaction in the long term.

So if you want to keep up with “the market,” invest in an index-linked fund or ETF that will do so. If you want to invest in a way that aligns with your personal goals and objectives, then ignore the market and choose a benchmark that will provide a better measure of performance.

https://www.marketscreener.com/S-P-500-4985/components/

https://investorplace.com/2020/04/faangm-stocks-are-driving-the-sp-500-higher/

Read More
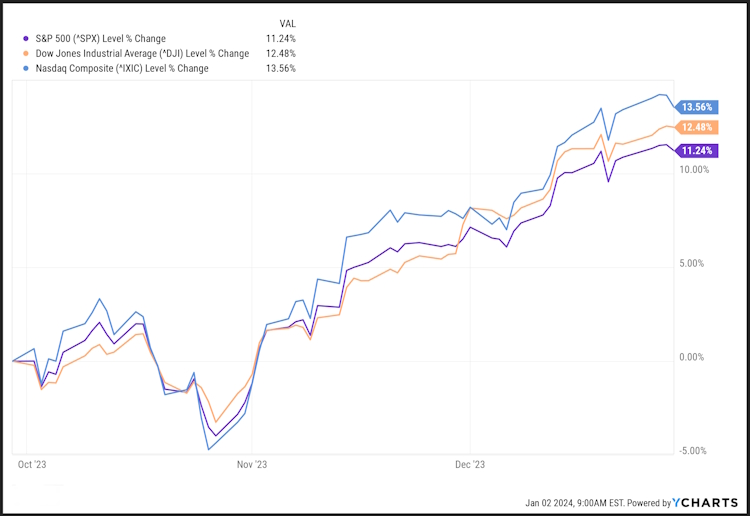
Three Piggy Banks

Here is a simple activity to start teaching your child the different ways of managing their cash flow and the consequences. This idea builds on an article I read before I even knew I was going to be a parent. It was written by someone writing under the name of Michael Masterson in one of the first email newsletters I ever subscribed to called “Early to Rise.”

Consider starting them on a weekly allowance.

By age five, your child is likely performing basic activities like brushing their teeth, dressing themselves and picking up their toys. We started our daughter with an allowance of $.25 per week. The allowance was not directly tied to activity but instead tied toward behavior. We created a Chore Board with 5 activities that we wanted her to take on:

  • Pick up your toys
  • Feed the dogs
  • Put your clothes in the hamper every night
  • Put your dishes on the kitchen counter
  • Brush your teeth

Make sure they understand the specifics of each of these tasks like not giving the dogs seconds or thirds even if it’s fun. Explain that they will get their allowance every week as long as they are helping out.

Try to give the allowance in increments of five (5 pennies, nickels, dimes, dollars, etc.). We recommend this for a couple of reasons:

  • Five nickels in your hand feels like a lot when you have little hands.
  • We want them to spend the money in a visual manner, meaning we want her to see a lot of money leave her hand whenever she buys something.
  • We want to teach them the idea of allocation. It’s easier to divide four quarters than a single dollar bill; or five, one-dollar bills versus a five-dollar bill.

Then get two or three piggy banks of approximately equal size. The article I read recommended two banks, but my wife and I both share a strong belief in supporting charitable causes, so we made it three. Label the banks as follows:

  • Savings (Glue the “withdraw” opening of this one shut)
  • Spending
  • (optional) Giving

Just a quick note, we have seen, and in fact our oldest daughter at one time received, a bank like this one pictured here, from a well-intentioned friend, However, as you’ll hopefully note below, this style of one-for-all bank doesn’t provide as much of a physical impact for the child as having the three separate ones.

Hopefully, the saving and spending banks are self-evident, savings is for the future when they will have large purchases or if they ever want (or need) to live off of what they have saved versus having to work (more on this later).

Spending is for anything they want, any time they want it, but only if they have enough to buy it without taking anything from the other two banks.

As for the giving bank, at the end of each year the kids count out the money in the bank and give it to us. Then my wife and I make a donation in our daughters’ names to whatever charity they choose. If the charity is local, we usually take them to the location and let them present the check in person. Often this has led to a tour in the case of a homeless shelter or food bank. This has had a profound impact on our oldest daughter who has become a bell-ringer for the Salvation Army during the holiday season to help fight homelessness.

When you give them their allowance, tell them that they can put as much as they want in each of the banks but that something has to go into each one (you’ll probably have to do this more than once).

After they have been able to build up some savings in the three banks, it is time to put the spending bank to use.

When they ask you to buy them something, you can explain that they can now use their spending bank to buy it for themselves (assuming the proposed purchase meets your approval). Write down the cost of the item they want to buy and explain that when you get home you can see if there is enough money available in the spending bank to purchase the item.

In my experience, the child will be shocked when they see how little money is left over after you count out enough to make their purchase. Quite often, they will decide that they really don’t want to buy the item as much as they originally thought and leave the money in the bank.

At some point however, they will make a purchase or two and they will begin to notice how the savings bank gets heavier and heavier while the spending bank never gets very heavy.

This is also a great time to introduce the concept of work to them. Make extra earnings available when they do specific jobs like pulling weeds, washing cars, dusting, etc. Try to give them as many opportunities as possible that are age appropriate. Then, when there is a special item they want to purchase, help them figure out how they can earn enough money to buy it.

You will find that over time, your child will become much more thoughtful about their savings and their purchases. They will also be very proud when they are able to buy things with the money they earned. Don’t be surprised when they tell the cashier that they are buying it with their own money.

When their savings bank gets full, “crack” it open together and count it out. Then take your child to your local bank or credit union and let them deposit it in their own custodial account. Have a place to let them keep their deposit slips and bank statements.

Talk to them about what they can do with their savings: their first car, paying for college, or even their own home someday.

Encourage them to use their imagination to consider whatever excites them. Setting a goal is a good idea and it won’t be long before they are giving you progress reports on how close they are to reaching it!

Read More
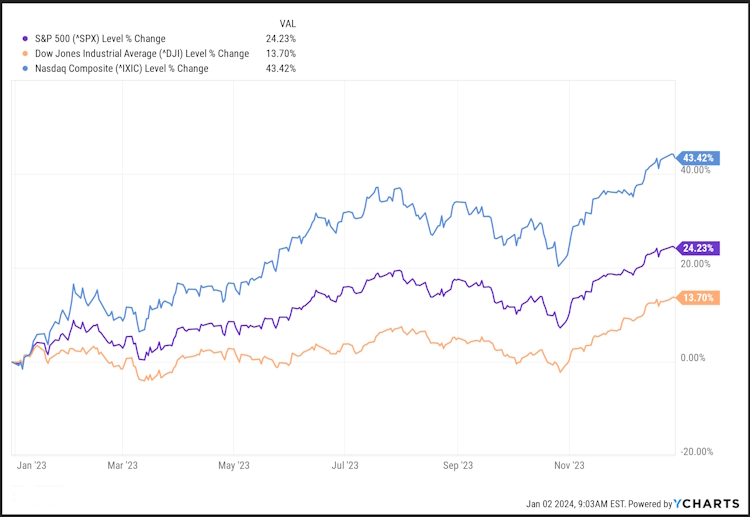
Teaching a Child about Cash Flow

By age four, your child will probably understand concepts like food, money, appliances, and time. Almost every family has at least one relative who sends money to your child for birthdays or holidays. Assuming that the money was in lieu of a gift, you will want to take your child to the store and let them exchange the money for something they want (toy, pet, clothes, whatever is deemed appropriate). If the money is intended for savings, then take your child to the bank and have them deposit it with you or, if they already have a savings bank at home, have them place it in there.

What is important is that the child “sees” the flow of money to them and from them.

The flow away from them can be in exchange for something tangible or to grow their savings. A bank book or statement showing an increasing balance helps to turn the latter into something visually understandable. They need to recognize that money can be exchanged for something they value and that an exchange can be immediate or delayed to enable the purchase of something even “bigger” in the future.

Kids are very visual and tactile, so, if keeping a bank at home, let them see the pile get bigger and run their hands through the miscellaneous coins every now and then.

Take note of your child’s “wants” when you’re at the store. Our daughter had an obsession with Beanie Babies and would want to take me over to the rack of them at our local grocery store every time I went in with her. Knowing she would answer, “Yes!” I would ask her if there was a special one she wanted. When she picked it out, I would say, okay, this will cost $5.00, so let’s go home and get your money so you can buy it.

Now I know what you’re thinking, what a waste of time and gas to go all the way home and all the way back just for a Beanie Baby.

Well, maybe.

When we got home, I would help her dump all her savings on the floor, and then together we would count out the five dollars for the toy and put it in a separate pile.

When she saw how big the buying pile was and how small the “what’s left” pile had become, she decided that she didn’t really want the toy as much as we thought and put it all back.

If you don’t want to take the chance that you will end up going home and driving right back to the store, you can always “lend” your child the money to buy the toy with the understanding you will be paid back as soon as you get home. I tried this once and it did not end well. Not only was there another stuffed animal to pick up every day, but there was also a very sad little girl who, upon seeing how empty her bank had become, quickly decided that she didn’t want the toy anymore.

But, of course, that’s the point of this exercise!

You want to create an awareness of the value of money and to start forcing value decisions between money and the things money can buy.

Some children will happily give up everything they have to get another toy or piece of candy while others will just close the vault and figuratively seal it shut! Most will fall somewhere in between.

Once a child starts to understand the consequences of making a purchase, you know you are on the right track.

Do not become a human credit card by making advances against future gifts!

When they are out of money, make sure that they are fully aware that they must wait for the next gift to show up before they can make another purchase.

At this young age, they will not be able to understand the growing IOU that is being created if you give them loans. Keep it simple and highly visible.

Read More
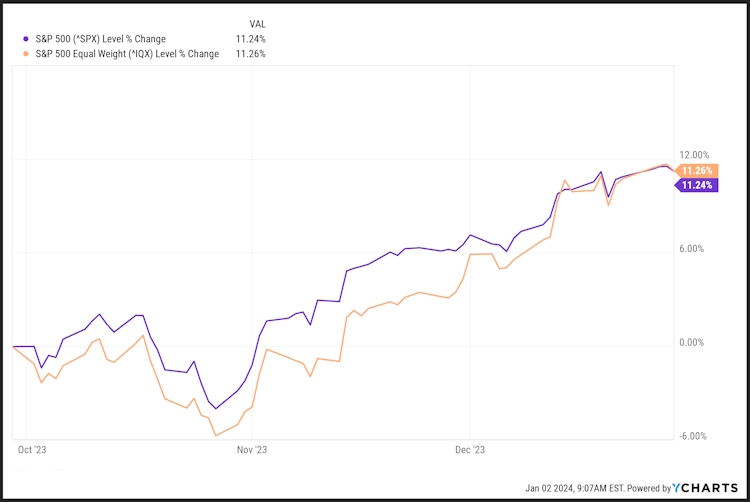
What is Cash Flow Return on Investment?

When looking for good businesses to buy (even if we are only buying a small portion), we focus primarily on easy-to-understand fundamentals such as demonstrated consistent sales and earnings growth, along with favorable long-term economics and an attractive price.

While the first two criteria are easily measured, determining the last two can be highly subjective and downright frustrating.

This article will focus on one approach to identifying an attractive price.

Warren Buffett often refers to the idea of a business having a “moat” that will protect its “castle.” Another way of saying this is that we want to see some sort of long-term competitive advantage that will allow it to continue to earn high returns on its capital. In the following excerpt from his 2007 Shareholder’s Letter, Buffett expanded on this idea:

A truly great business must have an enduring “moat” that protects excellent returns on invested capital. The dynamics of capitalism guarantee that competitors will repeatedly assault any business “castle” that is earning high returns. Therefore, a formidable barrier such as a company’s being the low-cost producer (GEICO, Costco) or possessing a powerful world-wide brand (Coca-Cola, Gillette, American Express) is essential for sustained success. Business history is filled with “Roman Candles,” companies whose moats proved illusory and were soon crossed.

Porter Stansberry, a highly successful investment writer, has often referred to this as being “Capital Efficient:”

To beat the stock market over time, a company must be extremely capital-efficient (In other words, it must be able to grow without huge, ongoing capital expenditures.) And it must have a unique brand and product – a “moat” to protect it from competition.

Some of the names that Porter includes in this category are Apple, Disney and Hershey.

The final piece of the puzzle is then buying those good businesses at a favorable price. There are many ways to determine what price is favorable. In researching for this article, I looked at several valuation models used by prominent value investors. Harris Associates, which manages the Oakmark Funds, says that its goal is to pay two-thirds or less of the intrinsic value of the business.

Buffett is a little less precise, simply stating that he wants to buy at a discount to intrinsic value but is coy about what a sufficient discount may be. Most likely, it varies depending on the individual business.

In both cases however, these investors are focused on determining the intrinsic value of a business and then comparing that value on a per share basis with the current market price of the stock.

So, what exactly is intrinsic value? Buffett defines it like this:

Well, intrinsic value is the number that if you were all-knowing about the future and could predict all the cash that a business would give you between now and judgment day, discounted at the proper discount rate, that number is what the intrinsic value of a business is.

Now, when you look at a bond, such as a United States government bond, we can easily determine its intrinsic value because we know how much we are going to get back. It says it right on the bond. It says when you get the interest payments. It says when you get the principal. This makes it very easy to calculate the value of a bond at any point in time. It can change tomorrow if interest rates change, but the cash flows are printed on the bond and they do not change.

However, unlike bonds, cash flows aren’t printed on a stock certificate. So, we are required to find a way to look at these businesses in the way that we would look at a bond and say this is what we think it’s going to pay out in the future.

This is where Cash Flow Return on Investment (CFROI) can help us.

Outlined in the 1999 book by Bartley Madden, “CFROI Valuation: A Total System Approach to Valuing the Firm,” CFROI is a valuation metric that is based on the idea that, over the long-term, the stock market determines stock prices based on the net present value based on a company’s discounted expected cash-flows and not on its accounting earnings per share (EPS), or other measures of corporate performance.

For any company, CFROI is essentially the internal rate of return (IRR).

CFROI is compared to a hurdle rate of return, usually the cost of borrowing (interest rate required to issue a new bond) for the business.

To determine whether the business is increasing or decreasing in value, the CFROI must exceed the hurdle rate to satisfy an investor’s expected return.

Typically, when companies undertake specific business initiatives such as an acquisition or an expansion into a new business line, they prepare a “business case” that factors in the forecast amounts and timing of all cash outflows and inflows over the estimated project life. An internal rate of return can then be calculated, which is simply compared to the firm’s hurdle rate (their return on cash investments) to decide whether to proceed with the project.

As an example, let us assume that a mushroom farmer in southeastern Michigan wants to start selling at a major market on the west side of the state and needs a new vehicle to transport his product to the market.

The initial outflow of cash is the purchase price of $50,000. Once the truck starts making deliveries to the new market, the new sales will result in $10,000 of operating cash flow each year. After five years, we can sell the truck for $20,000 as it has reached the end of its useful life.

Example – Purchasing a New Delivery Truck

Purchase Price: -$50,000

Year 1 Cash Flow: +$10,000

Year 2 Cash Flow: +$10,000

Year 3 Cash flow: +$10,000

Year 4 Cash Flow: +$10,000

Year 5 Cash Flow: +$10,000, +$20,000

Based on these numbers, we can calculate that the return on investment for the new truck is just slightly more than 10%

We can expand on this premise, applying it not merely to a specific project like the example above, but to an entire company. Like the IRR calculation of any single business initiative, the CFROI metric is a proxy for the company’s total economic return.

To do this, the methodology corrects subjectivity by converting income statement and balance sheet information into a CFROI return, a measure that more closely approximates a company’s underlying economics. The resulting returns are objectively based and can be viewed to assess the firm’s historical ability to create or destroy wealth over time.

To calculate CFROI, the financial information for a company is modified in order to make sure different methods of managing costs and assets are being accounted for. In this example, perhaps instead of purchasing the truck, the farmer struck a deal to lease the truck.

In this case, the truck would not be carried on the businesses balance sheet as if it were purchased and would, therefore, possibly distort the ROI calculation. In addition, other, non-cash entries on the balance sheet such as depreciation and goodwill are added or subtracted to create a metric called “gross investment” while net income is modified to reflect cash flows.

Consensus Earnings Expectations

GROSS CASH FLOW X GROSS INVESTMENT = RETURN ON GROSS INVESTMENT

The above information will then be used to calculate a company’s IRR (CFROI), from which then a “warranted value” for the stock can be determined.

This provides a consistent, holistic approach that can be used to compare operating performance across a portfolio, a market or a global universe of companies.

Doing this for every business is time consuming and requires lots of computing power, so you can imagine that a smaller firm like ours would be overwhelmed with such a task, and you would be correct.

We use a subscription service to obtain this information from a database of CFROI’s for over 18,000 companies worldwide. Historical records of up to 20 years are maintained for U.S. companies and up to 10 years for non-U.S. companies. As a “bonus” many REITs and Master Limited Partnerships are evaluated as well.

One last word about this concept. Just because we have found a great company and were able to buy it at a great price doesn’t mean that we should expect immediate success. In fact, very often we find these bargains amid a broader decline like in February and March and sometimes the sell-off continues after we have bought the stock. As value investor Howard Marks points out in his excellent book The Most Important Thing, “Being too far ahead of your time is indistinguishable from being wrong.”

In the short-term, even the best investors are going to look wrong from time to time. If we’re not okay with that, then we should only invest in Treasury Bonds. But over the longer term, we believe that finding a good business, that’s attractively priced and that the market is starting to reward, provides us with a good opportunity to achieve our investment goals.

Read More
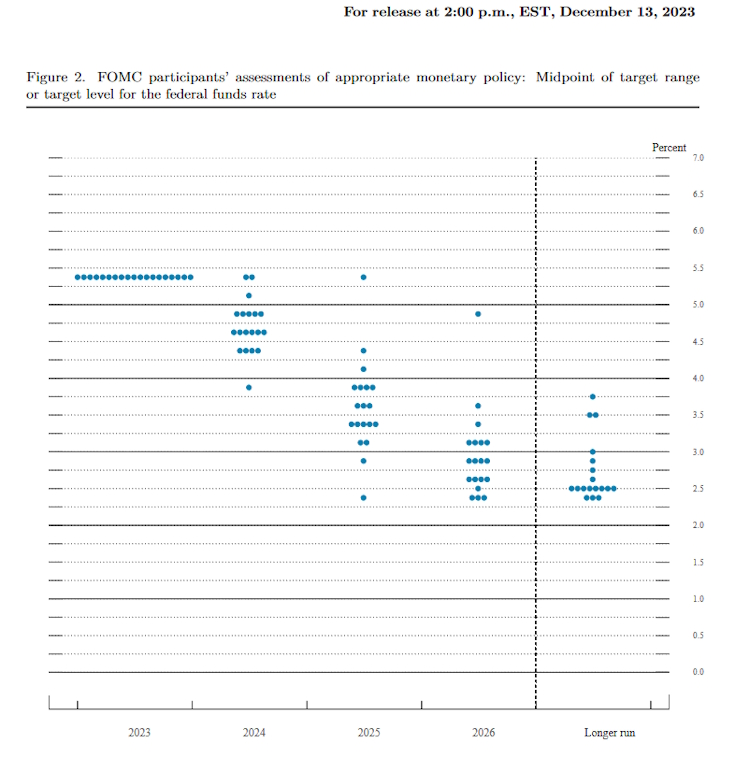
Second Quarter 2020 Market Review

Sell-Off, Rebound, then…?

Only two quarters in and 2020 is already one for the record books. In our lifetimes it was only on October 19th, 1987, when the Dow Industrials dropped 23% in a single session, that there’s been a faster market decline than that witnessed in the first quarter of this year. Then, in a further incredible example of market volatility, we experienced the greatest 50-day gain ever recorded. From Marketwatch.com:

The Dow Jones Industrial Average booked its best quarter since 1987, while the S&P 500 posted its best performance since 1998 and the Nasdaq Composite since 1999, as the economy began to reopen after the coronavirus lockdown.

The markets rose so far and so fast that our plan to spread new money into the market over a fixed period, quickly became inapplicable as the valuations of many individual stocks recovered or soared to new highs.

We fully expected to see a series of head fakes like those of past Bear markets.

S&P 500 Weekly Chart – Tech-Bubble Crash

Instead, we saw what can only be called a full rebound as the Nasdaq has gone positive for the year and the S&P 500 got within 29 index points of breakeven year-to-date before slipping back slightly.
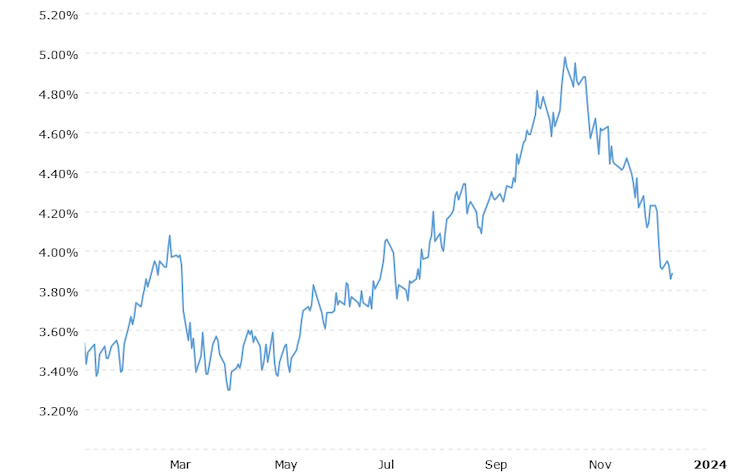
S&P 500 Daily Chart as of June 30, 2020

The rebound has not been equally distributed across all sectors and strategies, however. While money poured into the big tech names such as Apple, Amazon and Google, along with any retailer that either sold on-line or was allowed to stay open, many dividend-paying stocks in the energy, banking, and REIT sectors are still sitting at levels that are, in many cases, far below their original purchase prices.
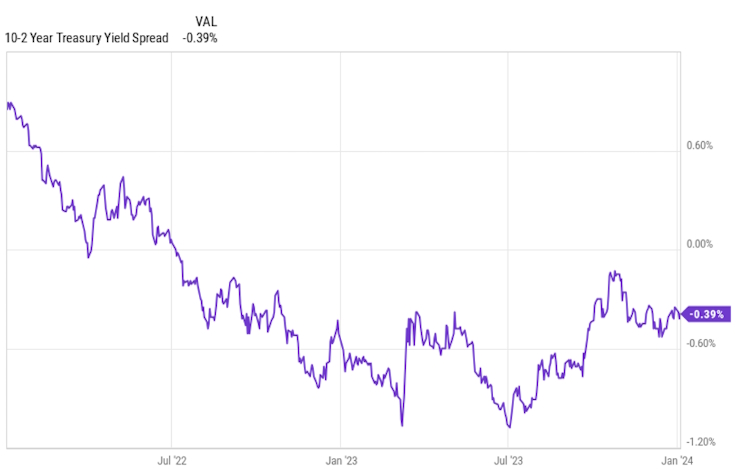
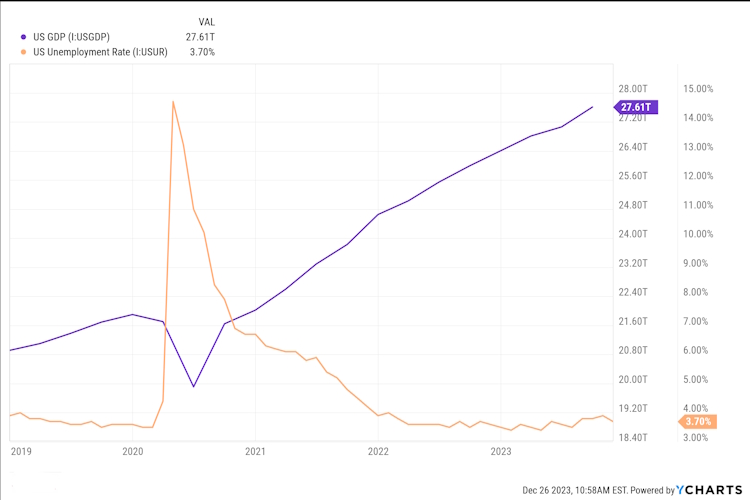
While this can be frustrating when looking at your account balance, remember that if the purpose of these investments was to produce income, and if we are still in the accumulation phase of the strategy, then we want to be reinvesting our dividends at lower prices in order to gain a greater return on our investment dollars.

If a financially sound bank, energy company or real estate investment trust is trading at a low price simply because it is out of favor with the market momentarily, we are okay with that.

The important thing is to keep an eye on each company’s business fundamentals and to be ready to move if we see those fundamentals deteriorating. We spend a lot of time and effort doing just that.

From this point until the end of the year it appears that there are only three things that will really matter to us…

The Virus

One of our colleagues holds an Associates in Science degree in Biology and a Bachelor’s degree in Bio-Chemical engineering. The Life Sciences have been a life-long passion of his.

He was formally trained to work with bacteria as well as viruses and did extensive work with two viruses, Hepatitis C and Human Immunodeficiency virus (HIV). While not holding himself out as an expert, he certainly has had more hands-on training and experience in virology than the average journalist writing for a mainstream news outlet.

Based on his training and experience, he has been sadly disappointed at the ongoing campaign to spread fear amongst the American public. That is a view shared by all of us. Whether deliberate or out of ignorance, it is morally wrong.

We aren’t going to offer a whole lecture series but will instead illustrate the items we focus on.

The first thing most experts want to know about a virus is the infection rate (R0). This number tells them how many people in a population are likely to get infected.

A simple internet search will show you that of the several thousand viruses circling the planet this very moment, most have an R0 of less than one which means that they are not very infectious. Regardless of what anyone tries to tell you, at this point in time the R0 for the Coronavirus is still unknown. There is simply not enough data to make a reliable determination.

The other most important piece of information is the fatality rate of the virus. This number conveys the likelihood of someone who has been infected succumbing to the virus.

Even dismissing other variables such as age, gender, pre-existing conditions, access to medical care, genetics and anything still to be determined as contributing factors, we do not have a clue what the real fatality rate might be.

As an example, when the Swine Flu first burst on the scene, it looked like it had a low R0 and a high fatality rate of 10% (By comparison, seasonal flus generally kill far fewer than 1% of those infected worldwide and less than 0.1% in the U.S). Based on those preliminary numbers, the World Health Organization declared Swine Flu a pandemic.

However, as it turned out, R0 for the pandemic was much higher and the fatality rate was much, much lower at 0.02%.

As a rule of thumb, a higher infection rate generally corresponds to a lower fatality rate. This makes intuitive sense because something deadly, such as Ebola, will kill those infected rapidly before they can spread the virus to others.

Note that R0 and fatality rate can only be calculated after the pandemic is over. While an epidemic is ongoing, as it is with the current coronavirus outbreak, calculating these numbers is, at the very least, naïve. They can be very misleading and lead to poor policy decisions if they are incorporated into any type of model used for making projections. This is precisely what has occurred with this pandemic and is the main reason that all the models have failed so miserably.

We saw this failure clearly in New York. During the Governor’s daily briefing on March 25th, a projection was made indicating that by April 1st, seven days later, New York would see coronavirus hospitalizations reach 60,000 patients. The actual number on April 1st, was closer to 12,000, off by 80% in just seven days.

In what are thought to be the early days of the virus, the World Health Organization was quoting fatality rates between 2% and 3.4% for confirmed cases. Based on those numbers, it was not unreasonable to make rather extreme safeguard recommendations/demands such as wearing masks in closed areas and maintaining greater physical distance from others.

However, as more and more data came in, we learned that the vast majority of COVID-19 deaths were attributed to the four states that sent infected seniors back to their nursing homes. The responsible course would have been to adjust policy based on the data, shifting resources to better secure nursing homes, retirement communities, and the more vulnerable members of the population, while opening up other, more resilient parts of the economy with appropriate precautions in place. In truth, we should probably treat flu seasons this way.

Instead, in the face of improving data, Governors in many states doubled down on their original stay at home orders; bars remained closed, as well as barbershops, schools, offices, airlines, restaurants, beaches, parks and a host of other locations (including churches). Instead of “bending the curve” (slowing the rate of infections, not the total number) to manage hospital and ER capacity, the purpose of these lockdowns suddenly changed to avoidance of the virus. This change in goal brought down upon us a financial calamity never seen before in history: a deep, intentional, self-inflicted recession.

The labor force participation rate, a much better measure of unemployment than the unemployment rate, had finally, after years of decline, been slowly starting to tick up prior to the lockdowns. But with the latest data from the end of May, it now sits at depression era lows.

As we write today, the “surge” in newly diagnosed cases are now mounting faster than you can say ‘coronavirus’.

While there are supposed new outbreaks in 4 states, we are learning that there are a growing number of cases in another 20 states. Importantly, the CDC is reporting that most of the newest reported infections are tied to the lower-risk, 20-30 year-old demographic versus the 70-90 year-old demographic.

This phenomenon Is being explained away as the result of ‘summer fun’ as the good weather is drawing out crowds to bars, beaches, sports, etc. In this case the crowds are now the younger set, tired of being told to stay put and tired of not being able to engage in the normal activities of youth.

In response to the rising case numbers, several states are once again shutting down some establishments, ignoring demographics, regional differences, and the fact that daily testing, a major contributor of raw case numbers, has nearly doubled since April.

The mainstream media is currently fixated on the rising case numbers while ignoring the increased testing. And, predictably, there is virtually no mention of the dramatic, and continuing, drop in hospitalizations and deaths from the virus.

To be clear, we are not downplaying this virus as if it is a scrape on the arm. COVID-19 is a horrible illness. We have friends, colleagues, and neighbors who have been infected. Several of them were miserable for days with fever and headaches but none of them were hospitalized and the data continues to show that it is an illness that has little, if any, real risk to young, healthy people.

There was no reason to perform a nationwide lockdown. There was no reason to whip everyone into a frenzy of fear.

The seasonal flu hospitalized between 410,000-740,000 people and killed between 24,000-62,000 people this season alone. No one in the media talked about this. No one urged an economic lockdown. No one claimed that it was a pandemic that would be worse than the Spanish flu of 1918-1919.

Where does this all lead us? Just like so many things about the virus, we don’t know.

We believe that by September, the improving data will be hard to ignore. However, by that time, a great amount of damage will have been inflicted on the economy and some of it will be irreparable. Will there be lessons learned?

Certainly, as we have seen with the Swine Flu, SARS and MERS before it, this is not going to be the last time we face a new virus of unknown lethality and infectiousness. In fact, just hitting the wires over the last 24 hours is a report out that states:

Researchers in China have discovered a new type of swine flu that is capable of triggering a pandemic, according to a study in the US science journal PNAS, although experts said there is no imminent threat.

– Guardian UK, US edition, also CBSNews.com

We wish that we were making this up, or that it was from The Onion, but alas, we have confirmed the story on several major news sites. What becomes of this and what impact it has on us is yet unknown.

But one thing that we have learned so far this century, when it comes to Fed intervention, the economy is not the market and visa-versa. Which leads us into our next subject.

The Fed

As you may or may not know, in June, the Fed announced it would begin buying bonds from individual corporations.

Prior to this, the Fed had already begun buying assets in:

  • The Treasury markets (US sovereign debt)
  • The municipal bond markets (debt issued by states and cities)
  • The corporate bond markets by index (debt issued by corporations)
  • The commercial paper markets (short-term corporate debt market)
  • And the asset-backed security markets (everything from student loans to certificates of deposit and more).

Looking at the most recent history of this kind of intervention, we know that after the crash of Lehman Brothers in 2008, the Fed printed around $4 trillion through various forms of quantitative easing. Over the next ten years, the S&P 500 climbed nearly 300% despite anemic economic and job growth, both here and abroad, and “non-existent” inflation as measured by the experts in our government.

The current round of Fed intervention goes well beyond anything we have seen from the 2008 crisis or prior periods.

The Fed is now involved in virtually every asset class with the exception of stocks. At this point, it would not surprise us to hear that the Fed will soon be buying stocks as well.

By intervening in the markets to this extreme degree, the Fed is publicly announcing its purchasing plans in advance. Equity investors see that the Fed is supporting the corporate bond markets and, as a consequence, they are willing to continue to buy stocks (at least for now).

As we stated last quarter, we used to be outraged by the Fed’s actions. The Fed’s reaction to the financial crisis of 2008 led several leading economists and investment writers to warn that the Fed’s actions were insanity and that they would only lead to greater problems down the road. Purchase of gold and silver in anticipation of a Weimer Republic-like collapse of the US dollar seemed prudent.

Fast forward twelve years and today we are still outraged by the Fed’s actions but we have learned that, regardless of how egregious their machinations may appear, it still does not pay to “fight the Fed.”

Fed actions are outside of our control. The Fed is going to do what it wants whether we like it or not. Which means that as investors we have a choice: we can be angry about this and continue to “fight the Fed” or we can seek those stocks and other investments that may perform best under these conditions.

We are still concerned about the long-term viability of the Fed’s strategy, but for now, we don’t want to fight the Fed by betting against them. Frankly, if investors do get a little more wary, it will likely produce short-term downward volatility that creates opportunities for both our dividend reinvestments as well as deployment of new capital.

We must be prepared for a seemingly inevitable wave of inflation growing out of Fed policy, but history tells us that stocks in general, and particularly the right stocks, are one of the best investments in an inflationary environment.

The Election

The accusations, the distortions, the promises, social media-shaming, endless campaign ads, endless requests for donations to run those ads, recounts, recount recounts, Russian interference, Chinese Interference, pass interference, shouting, rallies, riots, protests…. oh, how we would love to tell someone just to wake us up when it’s all over. But nowadays, it seems like it is never over as one campaign starts just as soon as the last election ends.

How we long for those days when nothing much happened until after the conventions and everyone could enjoy their summer. Of course, back then we didn’t have all the modern conveniences of 24 -hour cable news, Twitter, Facebook, Instagram, or smart-phones. People still thought that the job of the President was to run the Executive Branch of the government, not the country. But alas, we reluctantly are forced to accept that those days are long behind us, probably never to return.

Our job is to help our clients achieve their financial goals regardless of who is in office. We will pay attention to the elections and more importantly, to whatever policy issues that might impact our investments and manage accordingly.

We do not like making predictions about anything here, be it the weather, where the market will go tomorrow, and most certainly not an election outcome. Having said that, given everything that we have seen in the last four years, this may well be the most hotly contested election in our lifetimes. It would not surprise us if the final outcome was not determined until way after election day. Think of Bush / Gore on steroids.

Daily Chart of the S&P 500 During the Presidential 2000 Election Battle

The Bottom Line

There has been some good headline news for the market over the last month since reopening began (be prepared for a long litany of economic figures).

The ISM Manufacturing Index came in at 49.5 for May, just a whisker below the neutral line of 50 but up big from the depths of despair only two months ago. Then for June it came in at 52.6 (the expectation was 49.2); anything above 50 indicates economic expansion.

The Services PMI is also doing better than it was two months ago, and new home sales came in at +16.6% vs. the expected +2.7%. The latest employment report showed 2.5 million jobs gained vs. expectations for a loss of7.7 million jobs. The retail sales report jumped 17.7% (reportedly, the biggest monthly gain ever); and the Housing Market Index which surged 56.8% (also reportedly, the biggest monthly gain ever).

The consumer spending report showed a sharp 8.2% increase vs. last month’s upwardly revised -12.6%. Additionally, mortgage applications rose 8.0% last week with the Purchase Index up 4.0% and refi’s up 10.0%. Mortgage demand is now at an 11-year high. Housing starts rose as well to 0.974 million units (annualized), which was up 4.3% from last month’s upwardly revised 0.934 million. And housing permits jumped 14.4%, pointing to another gain in housing starts next month.

In the last reporting period for June, weekly jobless claims declined for the 12th week in a row. The Philadelphia Fed Business Outlook Survey climbed to 27.5 vs. last month’s -43.1 and the Leading Indicators report increased by 2.8%, up from last month’s -6.1% and expectations for a 1.7% gain.

Durable goods orders came in better than expected with new orders up 15.8% month on month versus estimates for 10.0%. Excluding transportation equipment, durable goods orders were up 4.0% versus estimates for 1.9%. And core capital goods were up 2.3% versus an estimated 0.6%.

Lastly, corporate profits beat expectations with a smaller decline of -9.1% year over year compared to the -11.1% expected.

So, whether it proves to be V-shaped, W-shaped or X, Y, Z, it does appear that an economic recovery is underway. And we’re seeing great pent-up economic demand being unleashed virtually everywhere.

That’s why, according to Zack’s Investment Research, top analysts are now calling for unprecedented GDP growth in Q3, more record growth in Q4, and the largest full year GDP growth in 2021 in 38 years.

So far, nearly $10 trillion in fiscal and monetary stimulus has been pumped into the economy, not to mention near zero interest rates for the foreseeable future.

So, although rising COVID-19 infection rates in the U.S. and China are certainly a concern, we still feel that most indicators are pointing towards a solid floor under the market that will slow any potential profit-taking or bearishness.

The pace of the recovery after the crisis may not be quite as fast as everyone would have hoped, but our strategy right now is to stay the course, remaining fully invested in our quality dividend paying portfolios while managing our stops in our trading strategies and hold some cash for opportunities that the expected volatility may bring.

As always, it is a great pleasure working with such a wonderful and engaged group of clients. We enjoy the phone conversations and email exchanges with you, so please do not hesitate to call or email with any questions, concerns, or ideas you have and we will do our best to provide the answers and guidance you seek. We hope you have a safe and pleasant summer!

Read More

Why We’re Still not “All-In”

Everybody is asking if it is safe to get back in the market or, at very least, to add new money to the market.

The real answer, of course is that it depends on both your individual situation, and the purpose of the money you are investing. If you are a trader, then the answer is based on your particular strategy. If you are a long-term investor, then the answer should be based on the fundamental qualities of the holdings in your portfolio. If you are reinvesting your dividends, then you are possibly even sad that the market reversed so sharply before you could accumulate more shares.

Still it makes for interesting Zoom conversations as we muddle through the shut down and stay at home orders, we find ourselves in.

The truth is that no one, despite all the proclamations to the contrary can perfectly time the market and we would be wary of anyone claiming they can. What we can do is look at history and derive some possibilities based on what has been observed under similar conditions.

We prefer to look at more recent histories since the crowds trading those markets are likely made up of many of the people trading this current market.

One note before we get started, we use the concept of retracements when analyzing market moves, this differs from gains and losses in one very specific way. A retracement is a countertrend move that follows the path of (retraces) a portion of the previous trend.

For example, if we buy a stock at $50 per share and the stock price rises to $100, we have a 100% gain of $50 per share. If the stock then falls to a price of $75 per share, it has fallen 25% [($100 – $75) / $100}, however it has retraced 50% [$25 / ($100 – $50)]. See the difference?

Dot Com Bubble Bear Market

In April of 2001, the S&P retraced 72% from the most recent high reached after the pullback associated with the Long-Term Capital Partners collapse.

By late May, the market bounced back, with a retracement of the downward trend of approximately 40%, looking like it was signaling an “all-clear”, but it wasn’t…

The market reversed course and fell past the previous low to the 964 level by September 2001.

By December of 2001, the market had once again bounced more than 60% off the lows and, after testing the 1100 level, looked like it was poised for a run up:

Instead, once again the market reversed and headed back down hitting another false bottom in July 2002 before settling finally in September of 2002, falling nearly 50% from the high reached in March of 2000.

Housing Bubble Bear Market

In March 2008, the S&P retraced 36% from the previous high of 1562 after an uptrend that had lasted about five years:

Within a couple of months, the market retraced 50% back up from the sell-off’s lows to the 1424 level …

…only to quickly reverse and head forcefully down to the March 2009 lows of around 670; a drop of nearly 892 points or 57%:

Which brings us to today

While the markets have come back strong since the historic February / March plunge that erased 32% off the market from it’s all-time highs. However, the upward retracement is well within the range that we would expect for any countertrend, or “Bear Market Rally” based on what we have observed during the previous two bear Markets.

In addition, there are still too many things we do not know yet regarding the virus as well the economy and individual businesses.

The circumstances around the recent Bear markets are all different, this certainly is the first time we have ever seen a government-mandated recession and it is hopefully the last. However, the short-term trading patterns we observe seem to be similar enough to at least make one pause. In the long-term, the markets reward good businesses, in the short-term, it is based on herd-like fear and greed, exasperated today by the algo-trading systems that tend to exaggerate daily moves in both directions.

Until we see that counter-trend close and hold above the 3000 level, we would expect to see more down-side movement before this is all over.

Read More

Are You Fed Up Yet?

One of the Best Pieces of Investment Advice I Ever Received

When I sit down with prospective clients, this is one of the first things I ask them. Are they secure in their job, fed up with their boss or the state they are living in, etc.? Many will give me one of those “who isn’t” smirks as if I’m just making idle chatter. Then I ask them, if they really were, what could they do about it? Could they just walk out today without another job in hand?

What if it was worse, what if next Monday or Friday, they were sat down and “right-sized,” or we were hit with a “super-bug” that shut down the economy and shuttered businesses, what then? Most people don’t have an answer for these kinds of questions and yet it is fundamentally one of the most critical aspects of becoming financially independent.

My father was one of those people who were never financially independent. He was a high school dropout and street hustler who ended up working his entire adult life in auto assembly plants after he came back from the war.

Not only was he dependent on his employer during his work life, he was just as dependent on his pension in retirement. Imagine sweating out every downturn in the automotive industry worried that your pension might get cut or even go away, 2008 was a grim reminder that a promise is only as good as the person, or entity behind it.

So, when I graduated college, he gave me one piece of advice.

Literally on the way home from my graduation ceremony, he told me that, after I get over the shock of how much money comes out of my pay check, I needed to figure out the cost of a comfortable but un-extravagant lifestyle, and set that as my living budget. He stressed that I should get as close as I could to living off 50% of my take home pay and bank the rest where I would likely not touch it, perhaps even using an automatic withdrawal if it was available. The purpose was to build up a “Fed Up” fund (except he didn’t say “Fed Up”) that would allow me to live an entire year without a job if I needed to.

He believed that, once I could walk away from a job for any reason and any time I needed to, I would never experience that feeling of being trapped as he had all those years. He further went on to advise that with every raise I received, needed to be split 50/50 between saving and spending so that my lifestyle would never get in the way of my security. Eventually, assuming I never had to use the funds, those savings would contribute to my long term retirement, whether it was used for income or simply as a safety net (remember this was before the 401K and IRA contributions were capped at $2500 per year).

Over the years I have given this same advice to both family and friends. Those who took it have always said that it was some of the best advice they’d ever gotten. One family member was able to use a portion of their “fund” money to pay cash for their current home; how nice not to worry about a mortgage payment in an emergency!

For prospective clients I have modified the advice some in order to keep up with the environment we now live in.

In addition to trying to live on 50% of their take home pay and setting the rest aside until they have a years’ worth of expense saved up. I also now recommend keeping at least 2 months’ worth of living expenses outside of the bank. When we suffered an extended power outage several years back, neither ATM’s nor credit card readers would work. The only way you could use a credit card to make a purchase was from someone with one of the old manually operated credit card imprinters. In an emergency when you need cash, the best thing is to have the cash readily accessible. I also recommend having a weeks’ worth in small currencies such as $1, $5- and $10-dollar bills because many merchants will not be able to break a $100 bill during these times.

Once you exceed your years’ worth of income, it is time to put together a long-term plan to grow your income through investing and protect your asset wealth, utilizing the various insurance and estate planning strategies available today.

Read More

First Quarter 2020 Market Review

May You Live in Interesting Times

It’s amazing how quickly things can change, and it reminds us of why we maintain the investment philosophy that we do.

On March 31st as the final bell rang, we closed the doors on the first quarter of 2020 – that saw the worst performance since 1987. In what will likely be remembered as a stunning blow in the history books, the Dow Jones Industrial Average ended the day down 1.8%, bringing the total 1st quarter performance to negative 23%. The S&P, Nasdaq, and Russell 1000 indexes didn’t fare much better, ending the day down 1.6%, 0.95%, and 0.45% and down 20%, 14%, and 31% the quarter, respectively.

This is in complete contrast to the first 5 weeks of the year when all of the indexes were making new highs in what seemed like an almost daily occurrence. As the year began, the indexes were well ahead of themselves and well ahead of all the trend lines, yet they wouldn’t back off, they wouldn’t come back to the average. Daily moves of up another 1% seemed to be the new norm. The rally of 2019 that saw the markets advance better than 30%, kept on going into the new year as the economy, even in the face of trade wars and impeachment, continued firing on all cylinders.

Then, because of a virus that was born and spread across the world before anyone acknowledged it, the world came to a “full stop.” The global economy was thrust into a manufactured recession as governments around the world brought whole countries to a standstill forcing a recession that is yet to be defined but one that is sure to be sharp and deep, wreaking havoc in every nation on Earth.

Making matters worse, the computerized trading systems that we lamented about in our last letter exaggerated every move in the market. Headline-based systems would kick into sell mode even prior to the market open and triggered technical trading systems creating a cascading domino effect.

What would have been a 1% move turned into a 2% move, a 4% move into 8%, etc. Our experience over many years has taught us that floor traders typically regard daily moves of as much as +/- 4% to be within the normal range of volatility. But when they see moves greater than 5%, they take notice and more importantly, take action, thus compounding the impact of these computerized systems.

As we wrote to you, we don’t see this new world of “algo-trading” changing, certainly not in the near future. This will likely make many short-term and swing-trading systems rendered useless, while testing the nerves of even the most dedicated long-term investors.

During quarters like this, two well-known quotes come to mind as we watch the gut-wrenching market volatility wreak havoc with our account balances:

“Everyone is a genius in a bull market” – author unknown, and;

“[Be] fearful when others are greedy and greedy when others are fearful.” – Warren Buffett

We enjoyed several phone conversations and emails from you during this volatile period telling us how, at some other time in your lives, market action like this would have kept you awake at night worrying about what the next day would bring.

Believe me, we were right there with you until we took a more strategic look at what we were doing with all that investment capital. As soon as we realized that we were managing our personal investing very different from the way we managed our business, a light came on in our heads and a different path to build wealth became much clearer and less stressful.

Here are two charts to ponder

The first is Warren Buffett’s “investment account”, better known as Berkshire Hathaway, as of the week of 3/20/2020:

Figure 1 BRK,B Weekly Line Chart 3/20/2020

As you can see, Warren’s account was now back to where it was back in 2017 as, very quickly, all his market gains were wiped away in the panic selling of the last few weeks. At the end of 2019, Berkshire’s stock market portfolio was $248 billion. By March 23, the value of Berkshire’s share of the top 10 publicly traded holdings was down by as much as $83 billion.

Berkshire’s stakes in Apple (Nasdaq: AAPL), Coca-Cola (NYSE: KO) and Delta (NYSE: DAL) fell by an average of 43% between February 20 and midday on March 23. Berkshire took a $27 billion hit on its Apple stock alone. Delta’s shares fell by an astonishing 63%.

The value of Berkshire’s Bank of America (NYSE: BAC) stock fell by $15 billion.

Now, here is a second chart from Macrotrends.net, taken the same day, which shows the growth of revenues happening inside Warren’s account.

Figure 2 Berkshire Hathaway Gross Revenue 12/31/2005 – 12/31/2019

The question, as an investor, is which chart is more important to you?

Warren Buffett began his investing career using value-based criteria to purchase any and everything that was “on-sale” with the intent of quickly unloading them for a capital gain. According to the book “The Snowball: Warren Buffett and the Business of Life” (which is available as a free PDF if you search hard enough!), this strategy worked well until it didn’t, which becomes very frustrating when you’re trying to make a living trading the market.

Over time, with the help of his long-time partner Charlie Munger, Buffett discovered the advantages of investing in outstanding businesses like See’s Candy and Coca-Cola, businesses with durable, competitive economics—a moat—and rational, honest management. Companies that rewarded shareholders with a steady and often increasing stream of distributions, either through the “management fees” he took from the businesses he fully owned, or the dividend distributions from those he was just heavily invested in.

In the latest Berkshire Hathaway letter to shareholders, which we faithfully read every year, we see that in 2019, Berkshire’s top 10 holdings paid the company $3.8 billion in dividends. Of those 10, Apple, Bank of America, Coca-Cola, and Wells Fargo (NYSE: WFC) accounted for three-quarters of that $3.8 billion.

In 2019, Berkshire received a total of $15.6 billion in dividends and distributions, which accounts for 65% of its operating earnings. It repurchased $4.9 billion of its stock, all paid for from the dividends it receives.

Critics who point out that Berkshire (NYSE: BRK.A, BRK.B) shares have underperformed the S&P 500 over the last 5 years are sadly missing the point. As stated above, Berkshire Hathaway is first and foremost Buffett’s investment account, similar to our IRA’s, 401K’s and the like, and; he uses his investment strategy to provide for his annual income as well as pay for all of the people and services he now requires to manage such a large “account.”

In other words, Buffett doesn’t have to sell shares of Berkshire Hathaway for cash to pay his bills, instead he relies on the distributions from the investments within the account to do so and he is one of the best at doing this. He has effectively insulated himself from the volatility that we just experienced. In fact, he took advantage of the situation, buying 976,000 shares of Delta Airlines that other panicked investors were more than happy to sell to him.

Buffett actually has two full time portfolio managers on his payroll, Todd Combs and Ted Weschler and many of the new investment selections are made by these two individuals as they are free to manage billions of dollars’ worth of capital without much oversight by Mr. Buffett nor by Charlie Munger.

So as long as Buffett’s personal and business objectives are being met (and as you can imagine, the two are quite tightly intertwined), we doubt that he gives much thought to what the market has done to his net worth or whether he really beats the market indices on any given day, or even any given year.

Much of the investing world is reeling right now from the shock of the coronavirus-induced sell-off. Yet we’re betting Buffett is thanking his lucky stars.

Which brings us back to our view on investing and growing wealth. Cash flow is king, we simply can’t spend a rate of return. Therefore, we must look to using cash flow to manage our retirement income. If we are invested in a well-diversified portfolio of income-producing investments, including an allocation of stocks that have historically increased their dividends on a regular basis, and are planning on living off of distributions from that portfolio, a market sell-off shouldn’t mean anything other than that those distributions/dividends just became more valuable in what is now an ultra-low interest rate environment.

In his book “Get Rich with Dividends.” Income Strategist Marc Lichtenfeld discusses how a bear market can be your “best friend.”

“If you are investing for the long term and reinvesting dividends, your dividends can now buy shares 30% cheaper than they could last month – and in some cases, even more than 30%.

As I’m fond of saying, that means your dividends buy more shares, which generate more dividends, which buy more shares, which generate more dividends and so on…”

As much as it hurts to look at, we really should not care if the principal is up 20% or down 20%. And, if you are still reinvesting your dividends, as many of us are, you’re suddenly enjoying an even higher yield with every dollar reinvested, and remember that those reinvestments are occurring all the time without the need for additional funds being transferred to your account.

Does this mean that we totally ignore growth or speculative opportunity stocks? Of course not, even Buffett owns a few stocks that pay no dividend at all including Amazon (NASDAQ: AMZN), Charter Communications (NASDAQ: CHTR), Verisign (NASDAQ: VRSN), Davita (NYSE: DVA), United Continental (NASDAQ: UAL), and a few other smaller positions.

But, if these stocks do not pay a dividend, he must rely completely on their price action in order to benefit from these investments. Quarters like this last one are reminders of why we don’t want that to represent the largest component of our strategy.

We understand that this philosophy can be frustrating to some, especially to those who receive the seemingly non-stop barrage of emails from “legendary” traders and hedge fund managers whom we’ve never heard of, promising:

“3 Techniques to Help You Capture the Trades of a Lifetime”

“How to Potentially Double Your Net Worth”

“The Stock of the Century – Buy This Stock RIGHT NOW!”

Our challenge is the day to day monotony of holding good companies and having the distributions automatically reinvested as they come in. We have no hot stock to talk about at the club, or chatting with the neighbors (six feet apart, of course!), and usually no explosive market gains over short periods of time. Instead we have a slow, boring grind higher and higher of investment income, almost like watching paint dry, that still doesn’t fully shield our account balances from the type of volatility that we saw this quarter.

This is, of course, the reason why we send a projected cash flow report each quarter along with a traditional performance report. We believe that over time, the two reports provide proper perspective in reviewing the progress toward your personal financial goals.

With that, let us look more in depth at what shook the markets this quarter as well as a look as to what may keep them in a state of volatility through the year.

Coronavirus / The Economy; The Mandated Recession

A few months ago, no one had ever heard of coronavirus. But now, it is the only thing people are talking about, our kids and grandkids will talk about the “Great Coronavirus Shutdown” the way that our parents and grandparents spoke of the great depression.

The U.S. government, along with the governments of almost all afflicted countries in Europe and Asia, determined that the only way to slow this pandemic was to severely restrict movement and economic activity even though that meant they would trigger a recession. School classes, and theaters are closed and sporting events, conventions and concerts throughout the U.S. are being canceled. The business and vacation travel industry has been shuttered. The Summer Olympics have been postponed.

People have sold stocks en masse, Costco’s are still getting picked clean (especially for toilet paper), and the Fed has made dramatic moves including cutting rates basically down to zero.

We won’t waste ink presenting the current numbers to you, first, because by the time you read this they will have changed, and; secondly, we know that you are very informed and as up-to-date as we are on matters like this.

We continue to struggle with both the reporting of data as well as the projections that have been published. Only history will tell if this is an overreaction or prudent crisis management.

By late February, China, where this all started, had already started ramping back up their manufacturing and technology sectors as, if we can believe them, the spread of the virus is now “under control.” Were they caving to economic pressure, or did the virus run its course due to the extreme measures taken? Several articles we have read stated that instead of trying to enforce anything nationwide, the Chinese started isolating pockets of high concentration versus low concentration thus allowing the low concentration areas to begin a path back to economic normalcy.

Here in the U.S., we are still maintaining a one-policy-for-all nationwide approach with nearly every state at some level of “stay at home” orders, even though the data shows that currently 80% of total cases and new cases are concentrated in 10 States (50% of total cases are located in New York and New Jersey). By comparison, our home state of Wisconsin has only reported 1,351 total cases, and even our temporary home state of California is reporting ½ the cases of New jersey, mostly concentrated in the major urban area of Los Angeles and San Francisco.

One of the few positives that we have seen just recently is that the number of recovered / discharged cases have now exceeded deaths in the U.S. This has been an early indicator in most of the countries that are now starting to resume “normal” activities (if you can believe them).

The other thing that is too soon to tell will be the economic fallout from a government-forced recession. We really have nothing historically to go on.

The Crash of 1929

By almost every measure, the stock market crash of 1929 was the biggest and most devastating crash in world history.

It occurred after nearly 10 years of economic expansion from 1919-1929 (the Roaring Twenties). This was a decade of steady, dramatic growth that created a sense of irrational exuberance among investors who were happy to pay high prices for stocks and leverage those investments by borrowing money to make them.

By August of 1929, word was getting out that times were changing. Unemployment was rising. Economic growth was slowing. Stocks were overpriced, and Wall Street was hugely overleveraged.

On October 24, the market dropped. It dropped again on the 28th. And by the 29th (Black Tuesday), the Dow had dropped 24.8%. On Black Tuesday, a record 16 million shares were traded on the New York Stock Exchange in one day. Investors, many of whom had put everything into stocks, collectively lost billions of dollars.

Twelve years of worldwide depression followed, and the U.S. economy didn’t recover until after World War II.

The Crash of 1987

Like the crash of 1929, the crash of 1987 occurred after a long-running bull market.

On October 19 (Black Monday), the Dow dropped 22.6%, and, in percentage terms, it’s the biggest one-day drop ever.

Theories behind the reasons for the crash included a slowdown in the U.S. economy, a drop in oil prices, and escalating tensions between the U.S. and Iran. But the financial reasons were similar to those of the crash of 1929: speculators paying crazy prices for overpriced stocks and purchasing junk bonds leveraged mostly through margin accounts.

On top of that, something new was happening: computerized trading. It made selling easier and faster and accelerated the sell-off.

But unlike the crash of 1929, Black Monday didn’t result in an economic recession. In fact, the market began strengthening almost immediately and led to a 12-year bull run.

The Dot-Com Bust of 1999-2000

In the 1990s, access to the internet started to shape people’s lives. Easy access to online retailers, such as AOL, Pets.com, Webvan.com, Geocities, and Globe.com, helped drive online growth. It also gave investors a huge opportunity to make money.

Shares of these companies rose dramatically. In most cases, prices soared far beyond intrinsic values.

In March 2000, some of these companies started folding, and investors shed tech stocks at a rapid pace. The tech-focused Nasdaq fell from 5,000 in early 2001 to just 1,000 by 2002. Paper-gains, many of which were made with borrowed money, as investors flocked to buy any stock that had “.com” in their name were wiped out.

The “Great Recession” Stock Market Crash of 2008/2009

Besides the crash of 1929, the crash of 2008 was in many respects the most serious financial collapse of the last 100 years. Many investors don’t realize how close the U.S. financial sector came to completely unravelling.

Like every crash mentioned, this one followed a long-term bull market (from 2002 to 2007). Also like the others, it was instigated by speculation. Not so much by speculation in conventional stocks, but by the widespread use of mortgage-backed securities in the housing sector.

These products, which were sold by financial institutions to investors, pension funds, and banks declined in value as housing prices receded.

And we all remember what followed. The bursting of the U.S. housing bubble and Lehman Brothers’ collapse nearly crushed the world’s financial system and resulted in a damaged housing market, business failures, and a wounded global economy.

But none of the four major stock market crashes permanently damaged the U.S. economy. In every case, the markets climbed back up and then went on to new highs.

The duration of those downturns varied. The 1929 crash was the slowest to recover at 10 to 12 years. (Depending on how it is measured.) It took seven years for the market to fully recover from the crash of 2008. And the crash of 1987 began recovering after a few months. Even where full recovery took years, the upward trend began in months or just a few years.

All of those crashes happened because of a combination of economic imbalances, flaws in the banking and financial sectors, a period of manic investing that brought market values to unrealistic heights, and panic. In other words, they were caused by economic and financial crises.

The current crash was precipitated by a health crisis. In stock market language, that’s considered an event-based crash.

Past health scares have shocked the market, too. In 2013, for example, the MERS outbreak caused the market to drop by 6%. And in 2003, the SARS outbreak caused a worldwide panic, taking the market down by 14%. But both of these event-driven crashes were followed quickly by a surge back to past highs and then beyond.

The real risk here, is that, unlike our response to these prior events, deliberately shutting down the economy may create a financial crisis that never would have happened had the response been more measured. If, like China (if we can believe them), other countries can start ramping up after two months and not suffer a second wave of infections, confidence can be restored, and we can start moving to a phase of restoration.

However, if China sees a sudden increase in caseloads (and actually reports them) requiring a second shut down, it will likely mean an extended shut down here in the U.S. rendering all assumptions useless.

Of course, even in the best-case scenario for the virus, we have other issues that we need to keep an eye on.

Oil

March 8, 2020 – (Bloomberg) Friday’s gathering of oil ministers from the Organization of the Petroleum Exporting Countries and their international allies broke up in disarray. The collapse of talks reveals deep divisions over how to deal with the slump in oil demand triggered by the spread of the Covid-19 virus.

According to the article referenced above (and several others), Saudi Arabia demanded that Russia share in a proposed reduction of a further 1.5 million barrels a day, insisting that OPEC wouldn’t reduce supply without the support of non-members. Russia refused.

The meeting was not just about making a further output cut. It was also meant to ratify an extension of the current agreement between the 20 nations to remove as much as 2.1 million barrels a day of oil from the market. That deal, reached in December, expired at the end of March, leaving members free to pump as much as they wish from April 1.

In response to the failure to agree on output cutbacks, state-owned oil monopoly Saudi Aramco, slashed its price for its flagship Arab Light crude by the most in 20 years. This was interpreted as a signal that it may try to push as many barrels into the market as possible. On that news, oil markets dropped precipitously, sending crude oil futures down to the high-twenty / low thirty dollar per barrel price range.

One reason posited for Russia refusing to play ball may be disagreement over how best to deal with a sudden sharp, but temporary, drop in oil demand. By allowing oil prices to fall, the Russians may be hoping to spur demand. It’s difficult for us to see lower prices having much impact on consumption though, when factories are closed, airlines are slashing flights, and roads are emptying.

Cheap oil won’t ease fears of the Covid-19 virus. But it may encourage countries like China and India to build up their strategic stockpiles. Both are creating buffers along similar lines to the U.S. Strategic Petroleum Reserve to protect themselves from any future supply disruptions. China already seems to be pouring vast amounts of crude into storage tanks and underground caverns.

But there is also a bigger geopolitical dimension to Russia’s withdrawal from the output-cutting pact, just as there was to its joining. Participation served President Putin’s ambitions to rebuild Russia’s influence in the Middle East. Withdrawal is aimed at punishing the U.S. for its repeated attacks on Russia’s energy interests through sanctions, which have stifled Arctic offshore exploration and shale development, prevented the completion of a gas pipeline to Europe under the Baltic Sea, and targeted the Venezuelan business of Russia’s state-oil producer Rosneft.

Since the initial shock, we have seen prices continue to fall to a low of $19.95/barrel as the virus-crisis and price war continue.

Now some are suggesting that Saudi Arabia and Russia are trying to kill off the US oil shale industry with a price war in an attempt to take back control of the oil markets. Will it work?

Saudi Arabia led OPEC in a war on shale in 2014, when it introduced the pump-at-will policy. It failed then, capitulating as oil prices collapsed a year later. But U.S. producers from Exxon Mobil Corp. to Continental Resources Inc. are already being hammered by a drop in demand and now may be a more auspicious time to launch an attack.

Even if it fails again, Russia intends to make sure that U.S. oil companies share the pain of the collapse in oil demand. Saudi Arabia appears willing to help it. The next few months could get ugly. While many oil producers learned their lessons from the last oil war, many of them are still too leveraged to make operations work at these price levels.

A string of failures would also hit the High-Yield Bond markets as much of their debt is rated below investment grade. Which brings us to our next concern.

Bond Markets

Going into the third week of March, the financial system was facing turbulence in the debt market with corporate and municipal bonds selling off in dramatic fashion. The federal Reserve managed to reverse the sell-off by announcing that they would provide a backstop for everything even to the point of direct purchases.

Now, the question is whether or not these actions will be enough to keep the market from selling off again. We don’t have an answer to that because the situation keeps unfolding in real time and is dependent on the issues raised earlier. What we do know is that central banks around the world have signaled that they will do anything and everything to keep the markets propped up, which includes the unlimited printing of money. Which takes us to our final, catch-all concern

The Aftermath

After seeing the initial policies extended until the end of April, we still have no answer as to when we will be allowed to go to a movie or eat in a restaurant (even the public beaches are closed). Neither do we know what the short or long-term impacts will be.

While we will be flying soon again, we don’t think we’ll be booking the Disney Cruise we had planned for the kids. So, we do not expect the recovery will be evenly distributed across every sector of the economy.

Will the federal Reserve’s actions finally induce higher inflation?

Back in 2009, we read and wrote about how all of the Fed intervention would produce Zimbabwe-like inflation, John Mauldin’s book “End Game” was always close at hand, fully dog-eared for quick reference as economic data poured in daily, weekly and monthly. A decade later, none of those prognostications came to fruition. Will this time be different?

Negative Interest Rates

Last week, the yields on the 1-month and 3-month Treasury Bills actually turned negative. Now if you’re borrowing money to buy a house or finance a car, low or even negative interest rates can be a great thing! It means you don’t have to pay as much in interest for financing whatever it is you buy.

But if you’re on the other side of that transaction, putting your wealth into a savings account or a money market fund, negative interest rates can be devastating. Because negative rates can deplete your savings while you’re doing the “smart” thing and setting money aside for later.

When you sell stocks in your brokerage account, your brokerage typically puts the cash from these sales into a money market fund. These funds invest in short-term treasury bills. And during normal times, these treasury bills pay you interest on the extra cash in your account.

But in today’s environment many more investment accounts are plowing more money into these money market funds, and institutional investors are also investing in short-term treasury bills. In some cases, these institutions are legally required to park their cash in these treasury bills, regardless of what price they must pay for the bills.

When this happens, all the buying pressure pushes the price of these treasury bills higher, and in a perverse twist of fate, prices for these bills actually rise above the amount that you’ll receive when the bills mature. In other words, you’re paying MORE to buy the bills than you’ll receive back from the government. So, you’re guaranteeing a loss when you invest in these bills or the money market funds that your brokerage puts your savings into.

Treasury bill rates also affect other interest rates that are important to savers, such as savings accounts and certificates of deposits (CDs).

If this situation persists, and we have no reason to believe that it won’t given the tantrums the market throws anytime the Fed tries to reverse the trend and raise rates, we will have to figure out exactly how your short-term and contingency savings should be invested.

Office Space

Talking not about the movie but the asset. After a month of “stay at home” my wife and the CFO of Sun Bum are beginning to need additional office space versus the current telecommuting situation. While there will always be a need for face to face interaction, much of our “cubicle time” really doesn’t need to be done in an office cubicle.

While this is a very small sampling, it is certainly something to look out for in the future. Having already seen what Amazon did to the suburban malls, we can’t help but wonder if another seismic shift could be on the horizon in the commercial office space market.

Of course, this is not all gloom and doom. We have already seen the speed at which biotech companies were able to shift resources to the virus. We could see many great opportunities appear in the entire health care value chain because of what is happening today in labs and hospitals. Along the same line as the office space issue, college students, along with their parents are realizing that they don’t have to actually be on campus in order to take many college classes. Could the on-line business degree become the norm instead of a snarky water cooler comment?

We could also see a resurgence in US manufacturing as people become willing to pay a little more for goods produced here, which could help rebuild the middle-class. There certainly seems to be a building political will to bring pharmaceutical manufacturing, at least, back to our own country.

All this is to say that, while things are always changing, all is not lost. This latest crisis will bring new winners and losers. It is our job to identify those trends as early as we can and then find the best investments that fit our investment income bias and put our capital to work, even if that means temporarily holding a little more cash during times like these.

As always, it is a great pleasure working with you! Please do not hesitate to call or email with any questions, concerns, or ideas you have and we will do our best to provide the answers and guidance you seek.

Read More

Remember Why You Bought It

Imagine that it’s 2007 and you own a rental property. You paid $175,000 for it and now it is currently worth approximately $200,000. It‘s located an older, but, good neighborhood with access to good schools and shopping close by. You have a full-time renter paying $1,000 monthly and you are realizing a net profit of $250 per month from the property after all taxes and expenses are considered.

Over the next year however, the 2008 financial crisis hits and, while your renter still has their job and is making the payments on time, the “pop” of the housing bubble has caused the market value of your property to drop 30%. In other words, what you could sell for $200,000 a year ago now would only sell for $140,000, less than what you originally bought it for. What do you do?

Think about it, the neighborhood is the same, the rent is the same, the only thing that has changed is what the home-buying market perceives the value of the property to be. Put another way, the new “value” is what a buyer is willing to pay for the property today. Would you sell and cut your “losses”? After all, your total net worth has been reduced by $60,000 already.

If you say you would sell and cut your losses, then you are in some pretty good company: equity investors have dumped shares of global powerhouse businesses such as Microsoft, McDonalds, Apple and Disney in April, sending the share value down dramatically in a very short time.

McDonalds Weekly Bar Chart

Microsoft Weekly Bar Chart

Apple Weekly Bar Chart

Walt Disney Weekly Bar Chart

Each of these companies pays a dividend, and have a history of raising their dividends over time as revenue and earnings grew, so why would shareholders sell now? Because the market has priced them lower than they were a month ago?

Sure, their short-term financial performance may sour due to the Coronavirus response. But does anyone not think that Disney theme parks won’t reopen and fill up again just as they did after all the other global pandemics we’ve had just in this century alone? Will their new streaming service become less valuable as more people are forced to stay indoors? Is anyone using their phones and tablets less because of the virus? Here in California, restaurants were limited to pick-up, carryout or drive through services, when was the last time you ate or even ordered food inside a McDonalds? While we are not making a recommendation to purchase these stocks and this does not suggest that people don’t trade these stocks for capital gains, they do serve as examples of “great rental properties” impacted by short-term market turmoil.

There are two basic ways that people make money in real estate. Some of them “fix n flip” while others build a portfolio of investment properties that will provide a stream of income through rent collection. We do not hold one out as superior to the other. Similarly, there are two broad ways people make money in the markets; trading for capital gains or investing for income through dividends, interest or other types of distributions.

The point is to be very clear on what your strategy is before buying so that in times of market turmoil, as we are currently experiencing, you will have the emotional clarity to stick with your plan. If you are investing for income and believe that the companies you own will survive and prosper in a post-coronavirus world, then a market sell-off should not frighten you and may even be presenting an opportunity.

Read More

Let’s Take a Breath

It is always unnerving, even for those who have seen it before, to watch the market meltdown as it has done this week.

But when you step back and look at the big picture, the last couple of days in the market may not have caused as much damage as you would think.

A Correction, But Not a Crash

Look at the overall chart of the S&P 500 below, which covers the time period from the beginning of our current bull market until now.

S&P 500 Monthly Chart 2009 to Present

As you can see, the February pullback is meaningful. But it’s not all that abnormal compared to other pullbacks we have had along the way. As you may recall, in our Q4 2019 Letter we noted:

“Of course, a meaningful correction could happen in 2020, a quick internet search tells us that S&P 500 corrections of 10% or more, including those that turned into bear markets, have occurred nearly every 1.5 years (357 trading days) on average since 1957.”

In fact, on a percentage basis, we’ve had pullbacks that looked just as bad (if not worse) in 2011, two of them in 2015, and two more in 2018.

Each time, the market found its footing and patient investors were rewarded for sticking with their positions. Will we see another rebound this time around?

Well we don’t have a crystal ball. And it’s foolish to try to predict the short-term action of the market — which is based on the fear and greed based decisions of millions of humans around the world not to mention the algo trading we wrote about in our 2019 Q4 Letter to you.

But we see that there are a lot of reasons to remain optimistic.

When it comes to the coronavirus, the outbreak is disturbing for sure. But, let’s look at the facts instead of the headlines for a better picture of where we stand today.

The current US Census Bureau world population estimate in June 2019 shows that the current global population is 7,577,130,400 (7.5+ billion) people on earth. Please keep that very large number in mind. Now, according to the website Worldometers.info:

  • The total number of Coronavirus cases worldwide, is 84,173 as of 20:15 GMT (Greenwich Mean Time).
  • The Total Number of deaths is 2,876 related to the virus (this means that the person who died had the virus, but the virus has not been confirmed as the cause of death).
  • The total number of cases where the patient has recovered / been discharged is 36,880
  • Of the 44,417 currently infected patients, 36,322 are in mild condition
  • Of the 62 total cases reported in the US, 47 of those patients were working in the State department and stationed in China before returning to the U.S.

By comparison, this year alone, the flu caused 280,000-500,000 hospitalizations and 16,000-41,000 deaths (depending on the source of the information). Mind you, these aren’t numbers from third-world countries… this is solely in the U.S.

Additionally, scientists are working around the clock to come up with a vaccination. Several treatments are now being tried.

Meanwhile, we’re are at a place where the global economy could actually afford to have a challenge like this emerge.

As we know, the U.S. economy has been growing steadily and the economic numbers (as reported on Finviz.com) reported today gave us no reason to panic.

Across the Atlantic, the European economy had been showing encouraging signs of recovery before the virus took over the headlines.

As with Ebola, SARS, the Swine Flu, and the Bird Flu, we believe this virus will ultimately be viewed as a temporary challenge for our economy. It’s becoming more of a concentrated challenge than we originally expected. But coronavirus will most likely be a temporary issue, nonetheless.

We do not say this to downplay the threat of a new “superbug” and the chaos it may cause, we are saying that this week’s action appears to be a bit extreme in the context of the actual facts and the history of similar diseases.

So, What Do We Do at This Time?

While the chart above shows that the market’s current pullback certainly isn’t a catastrophe, there’s still plenty of wisdom in protecting your wealth from what could continue to be a challenging time in the market.

The important thing to realize is that not all stocks will pull back in the same way.

Many of the stocks that were wildly popular heading into this period are now the ones that are getting hit the hardest.

This makes sense. Because emotional investors were the ones buying these expensive stocks at any price in pursuit of capital gains, and those same emotional investors are now the ones selling at any price before their gains disappear.

Instead, we like to focus most of our investments on the stocks of companies and quality REITs with stable businesses and a history of consistent dividend payouts.

The key is to make well informed and thoughtful decisions with your capital.

Don’t just sell your stocks indiscriminately to get out of the market.

Remember that each time the market pulls back, you have a chance to buy great stocks at a discount. Without a significant change in the fundamentals of these individual companies, our dividend reinvestments are being made at lower prices than we could have gotten a week ago.

So, let’s keep our heads, keep a reasonable perspective, and use this pullback to our advantage.

If the situation should change in any way, rest assured that we are on top of it and will take actions as appropriate to the particular strategies in your accounts.

Read More

Coronavirus Exposes the Hidden Risks of a Global Supply Chain

Henry Ross Perot was a billionaire, philanthropist, and politician but most of all, he was a businessman. He quit IBM in 1962 to found Electronic Data Systems which he later sold to General Motors. Later, he founded Perot Systems which was sold to Cisco in 2009.

He liked to call things as he saw them. He made it no secret that he was disillusioned by GM’s slow pace of innovation and decision making. In 1992 during a Presidential debate with Bill Clinton and George H.W. Bush, he warned about the North American Free Trade Agreement, which had just been tentatively agreed to by Canada, the U.S. and Mexico.

“You implement that NAFTA, the Mexican trade agreement, where they pay people a dollar an hour, have no health care, no retirement, no pollution controls, and you’re going to hear a giant sucking sound of jobs being pulled out of this country.”

Perot could see the logical end this agreement would take. Instead of creating better trade and introducing American products to the Mexican and Canadian consumer, CEOs would use the agreement as a blunt instrument to bludgeon the big private sector labor unions into submission. After signing a series of terrible labor contracts, NAFTA would provide a means of escape for corporate managers who were lamenting how the deals they signed now made their products uncompetitive.

Following right behind Mexico, China lined up as another great source of “low-cost” components previously manufactured in the US.

A study published April 13, 2015 by The Economic Policy Institute, concluded that the U.S. lost about 850,000 jobs from 1993 to 2013 as a result of NAFTA and more than 5 million U.S. manufacturing jobs were lost between 1997 and 2014, and most of those job losses were due to growing trade deficits with countries that have negotiated trade and investment deals with the United States.

These jobs, which were once a pathway to middle-class income levels, as was the case for my parents, were now used to fund foreign governments who, as Perot said, paid people very low wages, provided no health care, no retirement, no worker safety regulations and no pollution control. Capital investment levels, a key driver of productivity and innovation, dropped as cheap foreign labor lessened the need for automation.

Unfortunately, buying materials and components from another country isn’t the same as buying them from a different county or state.

While regulations and standards may vary somewhat from state to state, the overall standards around the country are similar enough to allow for long range planning and lean-supply chain and capacity management. Not so when dealing with other countries.

Whether it is the impact of instability from constant movement of foreign governments from left to right and back again, or the lack of transparency we see from stable, but more authoritarian regimes such as China, trying to cost-optimize supply chains that stretch around the world is fraught with risk that is too often downplayed until it is too late.

This week we are seeing this play out with the ongoing coronavirus outbreak (see: What Apple, P&G, Walmart and other U.S. companies are saying about the coronavirus outbreak).

Those companies who produce locally to sell locally (think McDonalds, Domino’s Pizza and Starbucks), will take a hit to local revenue in affected areas, but won’t see their operations impacted in the US or anywhere not affected by the outbreak. But those who rely on the import of foreign made materials, components or finished products such as Apple, Walmart, clothing apparel and automotive manufacturers, are at risk of having domestic operations severely impacted as the supply pipelines dry up due to the shutdown of foreign manufacturing.

It’s not just manufactured items that are at risk.

A report last September by NBC news revealed that the vast majority of key ingredients for drugs that many Americans rely on are manufactured abroad, mostly in China. Imagine a national outbreak of a disease and being unable to supply the necessary treatments because the source of key ingredients was shut down due to the same disease.

A supply chain that keeps every step as close to the end user as possible provides transparency, stability and flexibility when dealing with disruptions. Many US companies are, once again, going to find this out the hard way.

Read More

Pullbacks, Corrections and Crashes, OH MY! Part II

In 2015, we wrote several essays about dealing with volatility in the stock market. Now, we’re doing what we would want if we were in your shoes… We’re sharing them again – with relevant updates – to provide some perspective when it comes to growing and protecting wealth.

In part 1, I tried to make the case that trying to time market corrections was very tough. Usually the effort leads to a lot of whipsawing in and out of the market. At the end of the day you’ll likely be staring at your statement and wishing that you’d just stayed in. In fact, in 2014 – 2016 we tested a system created by a professor from a major university. In live trading, with our own money, it severely underperformed our non-tactical, long strategies by a substantial amount.

While corrections are probably best just handled by turning off the television for a couple of days, true bear markets can be much more stomach churning. One thing to keep in mind is the mathematics of portfolio recovery.

For example, if your portfolio drops 20% within any time frame, you’ll need a 25% gain to get back to pre-correction levels. While this is a high bar as far as returns go, we have seen periods where the market has given us such returns. However, if your investments drop 50% in a bear market you’ll need a 100% gain to get back to even.

From the market lows in March of 2009, it wasn’t until early 2013 that the market got back to the previous highs that were reached in 2007. Therefore, it makes sense to look for ways to mitigate the damage to your wealth caused by bear markets. In this post, I will look at what I call “technical” strategies that are reactionary in nature and are based on some type of a trigger that informs you that it’s time to act. In Part 3, I will examine “structural” strategies that are based on a more holistic approach to building and storing wealth. Neither type of strategy is perfect, and these posts are meant to educate and empower you by making you aware of the different ways that you can avoid being a victim of Wall Street’s machinations. They are not meant to be recommendations or advice.

First and foremost, at the onset of any correction, ask yourself if the market environment has changed.

Are the economic numbers consistent with the generally accepted state of the economy? Has there been an act of aggression (Iraq invading Kuwait, 911, Crimea etc.)? Have we seen a major economic event such as a debt default by a country (Greece, Spain, Russia, etc.) or major municipality? What we are looking for are clues as to whether this is a normal downward blip within a long-term upwards trend (see part I) or a reaction to a potentially calamitous change to the economic environment.

Keep in mind that based on the data published by Ned Davis Research, we should “expect” to see a moderate correction about every 18 months with a more severe correction occurring once every three to four years on average. So, it may be useful to see if the timing of this decline fits within that time frame relative to the last one.

Next consider your personal timing.

If you are 30 years old and contributing to a 401K with no plans to touch that money for at least 30 years, that four year time span is not highly significant and, although it might hurt to look at your statements, it really doesn’t impact your life that much. In the book, Triumph of Optimists, by Elroy Dimson, Mike Staunton and Paul Marsh, the authors point out that despite all the upheaval including the 1929 crash, two world wars and the 1970’s oil shocks, the US stock markets were up 1.5 million percent in the twentieth century.

In other words, a simple buy and hold strategy over an obviously very long term yielded positive results.

In a world where we get upset when a website takes an extra 1/2 second to download, it is easy to start making knee-jerk decisions instead of looking at the bigger picture in proper perspective.

However, if you are 60 and you need to start taking withdrawals on your equity investments to finance your retirement, then that four years can be devastating both emotionally as well as financially, and you have to make some reasoned decisions fairly quickly. Ideally, you would want to have a plan in place that takes the need for withdrawals into consideration long before you’re staring at 600 point drops that (and I speak from experience) will most certainly cloud your judgment.

From a technical standpoint, you can use a circuit breaker type of system to limit your downside risk.

Trailing stops work very well in that they are always on alert and if you stick to them, they will keep you from selling too soon and help keep you from holding too long. For individual stocks and ETF’s, many people use a 20 – 25% trailing stop on the individual security. You can read more about trailing stops here.

One word of caution here, many trailing stop strategies recommend placing a trailing stop order with your broker to take away the emotion when the stop price is hit. I disagree with this application of the strategy. Given the volatility that we have seen in the market, it is very likely that your stock could open below your stop price in the morning but climb right back up above it by the end of the day. If you have a trailing stop order in with your broker, that stock will be sold as soon as the stock is triggered. I recommend using only end of day pricing to determine if your stock price has been reached and simply putting in an order to sell at the market the next day.

For broader market funds and sector ETF’s like those that are currently being pushed as “the answer,” there are simple technical indicators that will stop you out before the decline becomes too severe. Here we are focusing on big trend signals that are SIMPLE, easy to understand and rarely triggered.

In that last sentence, SIMPLE is not a cute acronym, it is highlighted as an important point. One of the worst things to happen to individual investors over the last 20 years was the creation of affordable charting software. When I was teaching option strategies, I would constantly get pulled aside by some excited student (members of certain professions were the worst) who had just developed the ultimate timing system. It usually looked like this:

This is NOT simple, nor does it usually work. Remember, there are and have been thousands of analysts, both human and electronic, trying to come up with the perfect market timing system for decades. It is highly doubtful that you, with your $200 charting software, have stumbled upon something that they overlooked.

Two very simple circuit breaker systems are Simple Moving Averages and Trend Identification. For a huge supply of great articles on using Simple Moving Averages, I refer you to @Meb Faber (http://mebfaber.com/). Meb is a smart guy who among other achievements, developed a very elegant timing system that he makes available for free on his site.

Trend Identification is also very simple and easy to understand but takes a little more work and possibly some $200 charting software.

To use Trend Identification to identify potential crashes, we first need to understand that a trend in Wall Street lingo is a series of higher highs in the market along with higher lows as depicted here:

So, all we are looking for is a point where we no longer have that trend in place. The chart above is the S&P 500 Index using weekly data, I prefer doing this on a chart that plots the market on a month by month basis as it will emphasize the larger trend taking place and minimize the noise that could cause an emotional knee-jerk reaction.

Note that the growing influence of computerized, systematic trading strategies, or “robot” trading, will probably increase the size and frequency of short-term market swings now and into the future if left unchecked. There are three broad types of these trading systems: index robots, high-frequency robots and rapid response robots that approach the market from different points of view. The rapid response robots scan headlines, speeches, disclosure documents and even tweets and then place trades that attempt to get ahead of the market based on their algorithms. The latest swings from the Coronavirus headlines are a good example of this as each day brings contradicting headlines and the markets are driven up or down in response.

Using the 2008 market crash as an example, you would start looking at the chart after an initial correction took place:

Following this type of pull back, we want to watch whether the market can make a new high before it falls through that initial correction level:


Notice that this system is not perfect and will NOT prevent you from losing money, but in this particular instance, the exit point was early enough to spare you out of most of the carnage that followed. The signal came before the market finally stopped falling and it took a couple of months to develop, giving you plenty of time to prepare.

These are just a couple examples of simple, circuit breaker-type strategies for getting out before there is too much damage to your investments. I like them because they are simple and easy to understand, but I don’t like them because they are formulated from historic price action. While many systems, such as the Dow Theory, seem to have stood the test of time, the world is changing at a faster and faster pace. Just because something worked in the last crash is not a guarantee that it will help us in the next one.

In Part 3, I will explore structural strategies that are not dependent on Wall Street behaving as it did in the past.

Read More

Pullbacks, Corrections and Crashes, OH MY! Part 1

In 2015, we wrote several essays about dealing with volatility in the stock market. Now, we’re doing what we would want if we were in your shoes… We’re sharing them again – with relevant updates – to provide some perspective when it comes to growing and protecting wealth.

January 28, 2020

Yesterday at 4:30 AM the Dow Futures were looking like the market would open down around 400 points, after dropping 240 points on the previous day. The headlines were all flashing about the Wuhan coronavirus coming out of China and the potential for global collapse caused by trade cessation as well as all the losses of companies with a major presence in China. Multi-nationals with China exposure such as Disney, McDonalds and Starbucks had all gapped down significantly and by 11:00 AM, my personal email inbox was starting to fill up with messages like this in the subject line: “The Dow is CRASHING…do this now!”

Indeed, the Dow ended the day down more than 1%. This was the first significant drop since the announcement of the China trade deal was announced and, just like previous drops, people were starting to once again fear that the day of reckoning was finally here.

To be sure, if we look at a short-term chart of the Dow, a drop such as the one that occurred in 2018 (near-20%) seems pretty horrific.

Dow Jones Industrial Average Daily 2018

But what if we look at a longer-term chart?

Dow Jones Industrial Average Weekly through 2018

Or even longer than that?

Dow Jones Industrial Average Monthly through 2018

Do you see a crash, or buying opportunities?

Dow Jones Industrial Average Monthly through January 2019

We certainly have had our share of panic selling since the turn of the century. The worst period was the infamous 2008-2009 sell-off. If you had managed to sell everything and moved to cash soon enough, you missed a nasty drop in the value of your equity holdings. Each subsequent drop, however, was followed by a dramatic run up in prices. If you had gotten out of the market for those declines, fearing a repeat of 2008-2009, you would have missed out on some pretty nice gains.

Another presidential election year is now getting into full gear that seems to promise all the drama of the last cycle in 2016. With that in mind and as the market grapples with geo-political issues and the latest threat of a pandemic, it may be prudent to put market volatility in perspective.

Dow Jones Industrial Average Daily 2016

Let’s start with terminology.

On Wall Street, or CNBC for that matter, a 5% decline in the market is considered a pull-back. Even in a raging bull market where anyone with a copy of the Wall Street Journal and a dart can pick a winning stock, pull backs can be quite common and most take place with little fanfare other than the talking heads on TV promoting their theories on why stocks didn’t rise for a week.

Corrections can be a little scarier. They are defined as a decline of 10% which is enough to make a noticeable difference in all but the tiniest portfolio. Making matters worse, corrections are not necessarily proportional across the entire market. So, while the overall market may be down around 10%, certain sectors (and in a case of Murphy’s law, it seems those sectors are usually those you’re concentrated in) can be down a lot more. For instance, here is the chart for VanEck Vectors Oil Services ETF (OIH), an ETF that holds energy service companies such as Schlumberger and Haliburton.

Vaneck Vectors Oil Services ETF versus Dow Jones Industrial Avg. 2017

As you can see, it was down nearly 20% in 2017 despite a rise in the overall market. Situations like this are most likely caused by either real or perceived changes in a particular business or industry. In this case it was the energy sector. These types of changes can cause all sorts of discomfort and can create enough fear of a much larger drop that capitulation results and the investor cashes in and heads for the sidelines.

Doing so will lock-in short term losses. A great deal of precision in picking the market bottom is now needed to get back in. If they mis-time the market bottom, they end up selling low and buying back high. Of course, this is the opposite of what one wants to do when investing. In the case of OIH, it did appear to have bottomed in August of 2017 and after testing lows in October and November, looked like it was starting a new uptrend heading into the new year. Unfortunately, the next year was not any kinder to the energy sector and the ETF fell nearly 44% by the end of 2018.

Trying to move in and out of market corrections without a reliable system is usually a waste of time and money. There are some tactical managers who have had a bit of success at timing corrections and if it interests you, I suggest seeking them out before trying it on your own.

Bear markets are defined as a decline of greater than 20%, and while individual stocks and sectors can be in bear markets, or down trends (as the case with OIH), broad-based declines that encompass all or most of the stock market are fortunately rare. In fact, in the last 50 years the Dow has only experienced a decline of that magnitude nine times.1 When we look at the S&P 500, a much broader index than the Dow, we see only five years of negative returns of any kind over the last 25 years and only twice did the decline exceed 20%.2

Unfortunately, as we see in the charts, all bear markets start out looking like corrections. Once the decline reaches 10%, we get a cacophony advice that, at best, can paralyze us with fear and confusion or, at worst, spurs us to pursue absolutely the wrong course of action when it comes to managing our money.

So how do we know when a decline is a correction and when it’s the start of a bear market? Well, frankly, you never know for sure until it’s all over. Therefore, I believe the more appropriate question is; “how do we structure our investment strategies so we can coolly and confidently deal with the uncertainty?”

1) “How Common are Market Declines?” American Superior Company, http://www.americansuperior.com/bear.htm
2) “How to Weather a Stock Market Decline,” Total Annual Returns for the S&P 500, Wealth Management Systems http://fc.standardandpoors.com/sites/client/generic/axa/axa4/Article.vm?topic=5991&siteContent=8096#005

Read More

Fourth Quarter 2019 Market Review

Q4 2019 – Welcome to the Roaring Twenties!

Let’s just get this out of the way: a 10% correction (or more) could be coming in 2020. This “prediction” of course does not come from us as we follow the trend instead of guessing it. It’s from Wells Fargo’s Chief Equity Strategist. After reading this bold prediction, we sighed a collective response usually attributed to teenage characters from a Disney TV series (remember we still have young kids and grandkids).

Of course, a meaningful correction could happen in 2020, a quick internet search tells us that S&P 500 corrections of 10% or more, including those that turned into bear markets, have occurred nearly every 1.5 years (357 trading days) on average since 1957.

Most recently, both the Dow and S&P 500 dropped into correction territory on February 8, 2018, when they closed 10.4 percent and 10.2 percent, respectively, lower than their late-January peak. All three of the major market indices also fell around 9% again in December 2018.

We take this “bold” proclamation from Wells Fargo as the equivalent of proclaiming that there might be a storm rise tomorrow; eventually they will be right. In the meantime, we must manage our strategies based on what is happening while keeping an eye on what could happen.

Here is the full quote from Chris Harvey who is the Chief Equity Strategist for Wells Fargo as published on Yahoo Finance on December 19:

“A 10% stock market correction in 1H20 (the first half of 2020) is possible; we can envision one in late March/early April when the Fed’s balance sheet possibly stops growing.”

Of course, if you are in the accumulation phase of an investment-income strategy you should celebrate 10% corrections as an opportunity to buy shares of your dividend-paying companies at a lower price. If you are collecting investment income from your portfolio, you are watching dividend growth, payout ratios and the overall strength of individual businesses instead of share prices. Anyone who sold their shares of Coca-Cola (KO) in 2008 missed out on a 12.5% dividend increase. It is the strength and staying power of the business that is of main concern and not a herd-based drop in price.

So, with that out of the way, let us quickly review 2019 and look at what could keep us up at night in 2020.

2019

Stocks did extremely well last year, making investors happy and economic data in the US and around the world did NOT deteriorate (as so many had expected). For the year, the Dow gained 23%, the S&P 500 surged by 30%, the NASDAQ rose by 37% and the Russell 2000 (small cap stocks)was up 25%. Central banks continue to support the markets with ultra-low (and, in some countries, negative) interest rates and inflation in the developed world remains well under control (more on this subject later).

The energy market (oil) appears to have stabilized (although rocked a bit recently by political developments).

In the US, unemployment is at “historic” lows, interest rates are at “historic” lows and the stock market is at “historic” highs, having advanced by 18% (after making up the 13% drop suffered last December when the markets went into sell mode over FED policy). The US has forged a new trade agreement with our own neighbors: Mexico and Canada, that was finally approved by the House of Representatives this month and as we had predicted earlier this year. The U.S. Trade Delegation has apparently forged an agreement (in principle) with China. So, Merry Christmas Rally!

Looking to 2020

2019 will be a tough act to follow, with widespread gains fueled by central bank easing and falling interest rates. Many stocks are riding on high valuations that may have gotten ahead of their fundamentals.

We see this reflected in the violent selloffs of individual companies during earnings season. These selloffs so far have had no rhyme or reason other than the market being disappointed with something and adjusting the price of the stock accordingly. Often this will happen on a day when the broader market indices are up, so we take this as judgments on individual companies and not an overall statement about any sector or the economy in general.

Barring any major unforeseen economic event, such as a collapse in the housing or credit markets, we expect the overall economy to remain stable throughout the year as the trade deals weave their way into the various components of the economy.

The latest reading of the Conference Board’ Leading Economic Index (LEI) that we mentioned last quarter was unchanged for November, before any of the trade deals were showing any sign of progress. The greater certainty alone could help boost the economy.

However, while the economy should be stable, we do not expect any change in the type of market volatility that we have experienced since 2018. In fact, it could get even crazier in 2020 with several factors contributing.

Trade

We try not to over think the unfolding of any trade deal with China. We still don’t know the details and the deal such as it may be, hasn’t been signed. Expectations for the signing of the Phase One trade deal are building and news out of the White House tells us that a “signing ceremony” is due to happen on Jan. 15. Who will be there is still unclear. The announcement makes it vague by saying “high level” Chinese officials. Any talk of a delay in that signing will certainly cause the optimism to fade and cause a reassessment of market valuation levels. That will likely cause investors to hit the sell button. However, any sell-off would probably be short-lived, lasting only last until the next positive tweet.

After Phase One is “official”, President Trump has stated that he will travel to Beijing to begin the start of Phase Two negotiations. No formal date for that was indicated. We continue to expect trade talk to be a prime driver of market sentiment in the months ahead.

It is hard to remember that the trade war is now almost 24 months old! None of the predictions made at the onset have come true; the global economy is not falling apart at the seams. US macro data remains robust and (if we believe it) the Chinese economy is holding its own. Eurozone data remains a bit weaker, but none of those countries are imploding. So while any delay may cause some selling pressure, we wouldn’t expect the bottom to fall out just yet.

Credit Risk

According to Bloomberg, the total amount of bonds outstanding globally that are trading with a negative yield exceed for the first time $15 trillion. This includes government and corporate debt, and some euro junk bonds. The problem here is that we have never seen this before. We spent quite a bit of time researching this topic and could not find a sustained period of negative-yielding debt once in market history. It’s hard to estimate how this will impact economies and markets since we don’t have any historical precedent.

We hope that potential pro-growth fiscal policy changes lead to enough economic improvement to create a soft-landing in the sovereign debt market.

That would mean that rates go positive without spiking up too high and without destroying the operating budgets of the countries issuing the debt. But it would be foolish to turn our backs on Central Banks and just expect them to get it right. More than likely, this process of returning to a more normal situation will resemble a high wire balancing act where we see reactive, overcompensation triggering short-term panic selling and buying depending on which side of the “wire” the banks are in danger of falling from.

Geo-Politics

Just in time for Christmas, North Korea’s President Kim Jung Un announced that he was no longer bound by any agreement to halt missile tests. The US embassy in Iraq was under attack and just this morning as we are going through our final edits, we see the announcement of a drone strike in Bagdad that killed a high-ranking Iranian general. The fact that Iranian generals are found traipsing around Iraq raises the temperature around the world.

All of this is an unfortunate reminder that international risks have built on several fronts the last several years.  The Middle East hasn’t always been at the top of the headlines but escalating incursions into Iraq and Syria could change all that. Do not expect any of this to go away anytime soon.

US Politics!

Oh boy, it is an election year (and a leap year, February has 29 days this year). Caucuses and primaries are about to begin. By super Tuesday, Mar. 3, we should have more clarity on who is really rising to the top of the Democratic heap and then what sectors of the economy will be most impacted by the coming platforms.

The FED

Based on the current state of the economy, we do not expect much from the central bank this year. Rates remain at historic lows, inflation remains subdued, GDP is running at a healthy 2%+ rate, unemployment is at historic lows, wage growth is healthy and improving, and talk of a coming recession is nothing but a memory. The idea that 2020 would see at least one more rate cut seems to be fading while talk of rate hikes remain “off limits.

It is an election year so the FED must be careful, otherwise they will be accused of “influencing the election.”

So, unless the US economy begins to stall (possible but unlikely) or begins to overheat (possible and more likely), don’t expect FED Chairman Jay Powell to do much. He has made it clear that we are in a good place and that the FED is comfortable. Individual members will continue to voice their opinions with some more hawkish while others remain dovish and that will contribute to the expected short-term volatility as we move through the year.

Algorithmic Trading and Investment Robots

Artificial intelligence in stock trading certainly isn’t a new phenomenon, but it’s impact on daily volatility continues to grow larger each day.

A recent investment article asked, “Have bots killed short term trading?” In the late 1990’s, market movements were still controlled by market makers. Real people were making and taking buy and sell orders, albeit with high speed computer tablets at their fingertips to calculate portfolio risk and give off-setting orders. Their role was to provide a “market” for buy and sell orders coming in from everywhere to ensure orderly liquidity flow between the buyers and the sellers.

Fast forward to today when large financial firms have invested heavily in AI and several unmistakable patterns are starting to emerge.

Take the recent daily volatility caused by the trade talks. It was not so much the actual comments coming out of China or the US that was driving the markets as much as the buy and sell orders driven by artificial intelligence and computer algorithms in reaction to those comments. It was the “smart logic” (AI) that is built into these algorithms that creates the noise and the (outsized) moves from one day to the next, no matter if we had a deal or not.

This was very noticeable on Tuesday, December 3, when the president made a supposedly “off the cuff” comment while in London, attending the NATO conference. BOOM, the algorithms went into SELL mode. The next day, Chinese Officials came out with a contradictory statement and the algorithms went into BUY mode.

These “Bots” are owned by very large financial institutions and can turn the market on a dime due to the sheer volume they can trade. These are not people with the ability to think critically prior to entering a trade, these are machines that scan headlines, conference calls, prices and volumes, and; faster than I can type a single letter, enter an order that can affect your strategy for the moment.

In fact, JP Morgan Chase noted in a September study that the stock market declined slightly on days when Trump tweeted more than 35 times. On days when Trump tweeted fewer than 35 times, stocks often went up.

These mighty algorithmic robots have dominated global markets over the past decade spitting out insane swings in asset prices in the process. Unfortunately, they will probably get even mightier during the next decade.

One result will be that successfully trading the stock market will become even tougher for most. As many of you know, we track several trading services, each with their own unique entry points and most using price-stop based exit strategies. With the market getting more volatile in the short-term for no good reason, many well-reasoned trades are stopped out and that hurts performance over the longer term.

One benefit that we see could be the return to a longer-term investing approach for smaller, individual investors based on the fundamental strength and growth prospects of single companies and income-generating investments that actually serve to lower the overall volatility of individual accounts, using the day to day, or even week to week market swings to their advantage when accumulating shares.

Update on the Repo Market

In September, the Fed claimed it would be providing $75 billion in overnight liquidity to the Repo Market for a few days, and that this easing would be temporary. As a refresher, or if you are new to our quarterly letters, repo operations occur when banks do not have the required levels of liquidity. They can “park” some of their less-liquid assets with the Fed in exchange for cash, thereby increasing their liquidity.

Last quarter we noted:

“The Federal Reserve acted to calm money markets, injecting billions in cash to quell a surge in short-term rates that was pushing up its policy benchmark rate and threatening to drive up borrowing costs for companies and consumers…

Money markets saw funding shortages Monday and Tuesday, driving the rate on one-day loans backed by Treasury bonds – known as repurchase agreements, or repos – as high as 10%, about four times greater than last week’s levels, according to ICAP data.

More importantly, the turmoil in the repo market caused a key benchmark for policy makers – known as the effective fed funds rate – to jump to 2.25%, an increase that, if left unchecked, could have started impacting broader borrowing costs in the economy.” – Bloomberg

At that time, it was being reported that the consensus among most financial professionals – including the Fed itself – is that this was merely a temporary problem that could be easily corrected by the Fed’s short-term interventions.

Well, so much for “temporary.”

Fast forward to today, and the Fed has increased its overnight repo program to $120 billion… launched a term repo program that has since increased from $30 billion to $45 billion… AND launched a monthly QE (quantitative easing) program of $60 billion.

The message here is clear: When it comes to interventions/monetary easing, there is no such thing as “temporary.”

Put another way, we wonder if the Fed can EVER abandon its interventions in the markets, or instead, will it be forced to engage in larger and larger interventions more frequently.

And the worst part is that the Fed created this situation.

As we opined in earlier letters, the reality is that following the 2008 Crisis, the Fed eased monetary conditions for FAR too long. They:

1. kept interest rates at ZERO for seven years;

2. printed over $3 trillion in new money and used it to buy assets from Wall Street; and

3. engaged in endless verbal intervention, promising additional stimulus whenever the financial markets began to roll over.

The Fed did all of this for SEVEN years (from 2008-2015) – even though there was an economic argument that it could have started normalizing policy as early as 2011/2012.

The result is that the financial system is now addicted to Fed interventions and it appears to us that the Fed may no longer be able to stop intervening without inducing a crisis.

At some point, all this excess leverage will likely lead to another crisis – just as it did in 2000 and 2008. But when there is no limit as to how much new money can be printed out of thin air, it is anyone’s guess as to when the music will stop or how different global economies will be impacted. We certainly do not know, and we are skeptical of any “expert” that claims to have that insight. So, it is most prudent to continue our strategies of investing in strong businesses based on the current economic conditions while staying alert and ready to adjust when the overall trend reverses course.

The SECURE Act

After months of collecting dust in the Senate, the SECURE Act, the most significant retirement savings reform legislation since the Pension Protection Act of 2006, is finally on its way to becoming law after being tacked on to a larger mandatory spending bill introduced into the House of Representatives. Big changes are coming.

Provisions of the SECURE Act will have a wide-ranging impact on retirement savings plans, and 401k plans in particular. According to an article published by 401K Specialist Magazine, among the biggest are:

The SECURE Act’s Section 204 gives fiduciary safe harbor to 401k plan sponsors who include annuities among offerings to plan participants, something long craved by insurers who offer annuity products. Many defined contribution plan sponsors have been reluctant to offer annuities in their plans due to the concern about fiduciary liability if the annuity provider becomes insolvent. Under Section 204, if an annuity provider chosen for a 401k plan were to go out of business or defraud plan participants, employees would not be able to sue the employer afterward.

The SECURE Act will increase the tax credit for employers introducing new retirement plans from $500 to $5,000, and small employers that implement an automatic enrollment feature in the plan design will be eligible for an additional $500 credit.

The SECURE Act’s Open MEP (A Multiple Employer Plan (MEP) is a type of 401(k) plan sponsored by more than one unrelated employer). This provision will make it easier and more economical for smaller employers to offer retirement plans by allowing for the creation of pooled retirement plan providers. It removes the common nexus requirements and allows Open MEPs for employers that don’t share common traits to be administered by the pooled plan provider. The provision also protects small employers in Open MEPs from penalties if other members violate fiduciary rules, also known as the “one bad apple” liability risk that a non-conforming member can pose to an entire plan. That issue has long been a stumbling block for MEPs.

Many part-time workers will be eligible to participate in an employer retirement plan under the SECURE Act.

The SECURE Act also pushes back the age at which retirement plan participants need to take required minimum distributions (RMDs), from 70½ to 72.

To pay for the estimated $389 million the SECURE Act would add to the federal budget over the next 10 years, the bill—in perhaps its most controversial provision—will effectively put an end to the popular estate planning tool known as the “Stretch IRA.”

As James Lange wrote in an article about Stretch IRAs on 401k Specialist earlier this year, under existing law, non-spouse heirs of an IRA owner can “stretch” or extend the taxable distributions of an inherited IRA over their lifetime. The benefit of protracting the distributions of an inherited $1 million IRA could mean as much as a million dollars to the heirs of the IRA owner over their lifetime. It’s all about how quickly taxes are or are not collected.

Under the SECURE Act, the entire IRA or retirement plan would have to be distributed within 10 years of the death of the IRA owner.

This final change can have huge estate planning implications in the new age of 401K millionaires. We are working with our Pinnacle Service Providers AM Accounting & Tax Service, LLC, Mawicke & Goisman, S.C. and Lake Growth Financial Services along with our friend Marc Lichtenfeld from Wealthy Retirement to establish what the best strategies may be to address these changes.

In Summary

As the title suggests, our overall approach and outlook has not changed. The economic backdrop remains favorable. We have low inflation, low interest rates, cheap energy, a strong dollar, wages at a 10-year high and unemployment at a half-century low. Yes, quarterly corporate profit growth slowed a bit. but earnings are growing, and the outlook is still positive.

As always, should you wish to discuss the details of the quarterly cash flow or performance reports, we are more than happy to do so.

Read More

Caution: Service Line Insurance

Guest Article by Marco Briceno from The Starr Group, a  Summit Pinnacle Provider

I wanted to share something with you that an account manager brought up.

Thousands of people call their water utility companies after receiving very concerning letters from Service Line Warranties of America (SLWA) to see whether or not they are a scam. These letters claim to offer insurance for the water lines connecting your home to the street. Most people are concerned because the letter makes this insurance sound like a requirement, when in fact is not required by either municipal or state governments.

Since the average Homeowner’s policy in Wisconsin does not provide any coverage for this kind of loss, there are two things you need to know before you buy this insurance.

You can read the full article on LinkedIn.

Read More

The Hierarchy of Financial Goals

Hand writing financial goals on chartDuring their initial training, financial advisors are taught to ask about a client’s goals for incorporation into their personal financial plans. Some of these goals can be “retirement at a certain age”, “a comfortable retirement”, “putting the kids through school”, “a condo in Aspen, Florida, Spain”, etc.

While it is very important to engage with clients and create a plan that incorporates their tangible goals, I believe that it is incumbent upon us to guide them through their goal setting so that over time, investment positioning is truly in harmony not only with a client’s financial goals, but their financial risks.

To create this harmony, the purpose of each investment position needs to be aligned with the block of money allocated to any single or set of related goals. Just as important though, is for the goals to be established in a logical hierarchy of building a client’s “financial house”. In other words, you don’t start digging a swimming pool when you haven’t first funded and then completed the bathrooms and kitchen.

Every client has goals that are made up of a combination of wants and needs. We refer to these as “life’s aspirations” as they are highly individualized. These aspirations must be prioritized for the plan to be robust in all kinds of personal economic situations that the client may face throughout their life.

The first step is to work with the client to define their life’s aspirations so that they are both tangible and easily measured in terms of cash flow. For example, a comfortable retirement needs to be defined as spending $X thousand per month accounting for inflation while putting the kids through college would be $X thousands per year, for a certain number of years starting in year Y. It is important to understand that this list is highly dynamic and that items will most likely be added or removed as life’s journey continues.

Once this list has been sufficiently developed, these aspirations must be identified as either a need or a want with respect to the client’s financial situation. For instance, while they may feel that paying for an education from Stanford is a need, one can argue that even the desire to pay for tuition at the local community college is really a want as there are resources available to kids who desire to continue their education beyond high school. However, having enough life insurance to protect your assets in the event of your untimely death is clearly a need as a shortfall there could result in financial devastation for your loved ones.

Financial Goals Depicted as a Colorful PyramidTherefore, prioritization must always favor needs over wants. While that may seem self-evident as you read this, I can assure you that many clients have a difficult time discerning needs from wants and an even harder time accepting the need to prioritize them, especially during times of financial abundance. Once the list has been divided into wants and needs, the prioritization can then take place starting with needs. In our Foundations of Wealth model, we define three levels of wealth that a client can attain:

  • Financially Secure
  • Financially Comfortable
  • Financially Affluent

It is through the creation of an initial financial snapshot that we determine what level of wealth a client has attained, if any, and; what gaps exist between where the client is and their next level of attainable wealth.

Financial security prioritizes two specific areas of investment:

  • Asset protection
  • Income

At the most basic level of personal finance, the first priority is to be properly insured, including not only property and casualty insurance, but also life and disability insurance as well. Nothing will derail a financial plan faster than damages from an untimely auto accident, even a small house fire, a lawsuit, or injuries that cause you to miss work.

After insurance, the next priority for asset protection should be a stash of emergency funds equaling at least six months to one year of living expenses. These funds should be kept in cash equivalent investments whose purpose is to store wealth, so that they can be accessed quickly and easily. Some advisors have suggested having credit lines available so that you don’t have to keep as much cash around, however, in the event of job loss, any borrowed funds could quickly become another headache if the duration of the layoff is longer than initially thought.

It is also important to adjust emergency funds to keep up with changes in lifestyle, as annual expenses change and usually increase so, therefore, should the emergency stash. I have used my emergency funds for even small emergencies such as a sudden appliance breakdown or new tires and minor medical payments. As a matter of habit, I just automatically add 5% of my take home pay to my emergency fund every month to make sure that it is always replenished when I use some of it.

The next priority is income. We believe Financial Security means that you can pay your basic living expenses without the need of a W-2 paycheck (50% income as Robert Kyosaki’s rich dad called it). It’s not any more complicated than that. Income can be derived either from capital gains or distributions also known as passive income. While each advisor will have their own opinion, we believe that the accumulation of good, income-producing assets is the foundation of any investment strategy.

The next level of wealth is the state of being financially comfortable. This simply means that on top of having enough income to cover our basic living expenses, we can now also cover what we call event based expenses.

It is here that the goals start to naturally shift from needs to wants. In the pursuit of financial security, we are generally focused on needs. Event based expenses start to creep into the category of wants, although some event based needs may also be identified. Events are temporary and usually one-time occurrences, although paying college tuition for three kids, while temporary, is a longer duration example.

The goals that consume event based expenses fall into typically consist of college expenses, weddings, once-in-a-lifetime trips, second / vacation homes and milestone birthdays. Nothing should be considered too small to fit in this category.

Family Happy after Ordering their Financial GoalsAchieving a financially comfortable state is the longest and most difficult goal to reach. The reason for this is that it is usually the hardest state to define. Financial comfort for a single person making a six-figure income is much different than a two-income family with three kids, and as we have either seen or experienced ourselves, single people can become married and childless couples can become parents in a very short period of time. On the flip side, married couples can become single through death or divorce and one-child families can become 4-child families through second marriages or similar events.

This highlights the importance of the annual financial snapshot. From year to year you may find the gap between where you are, and financial comfort has narrowed or widened. That means that adjustments and even compromises must be made. It is also important to use the snapshot throughout the year as you are faced with circumstances and decisions which can impact your ability to achieve your goal. A few minutes reviewing a what-if analysis can provide objective clarity to most financial decisions.

The third and final level of wealth, affluence, is made up entirely of wants. We call these life issues “Dreams and Visions” and they hold the least priority in your personal finances. Many clients dream of having a wing at a hospital or university named after them or establishing a charitable foundation to keep funding their favorite causes after they are gone. What ever these goals may be and whatever amounts are desired, they should only be addressed after all the previous goals have been attained.

In summary, the hierarchy of goals places needs over wants, the client over others (including family members) and security over luxury:

  • Asset Protection – invest to protect wealth
  • Emergency Funds – invest to store wealth
  • Living Expenses – invest to derive income from wealth
  • Event-based expenses – invest to grow and derive income from and to store wealth
  • Dreams and visions – invest to grow and derive income from wealth

With life’s aspirations clearly defined and placed in the proper categories, investment choices become subject to a much easier analysis and the anticipated outcomes become much better aligned with the expected plan performance.

Read More

Third Quarter 2019 Market Review

Q3 2019 – The Trend is Still Up

There was a quirky show in the late 1980’s titled “Twin Peaks”, where one of the main characters, a young FBI investigator, was known to say,

“Every day, once a day, give yourself a present.”

While I found this line of thinking to be too expensive for my lifestyle, it is essential for us to find something to celebrate and associate it with our activities, schedules and responsibilities. In this way, just like that once-in-a-while, great hit I make on the golf course, these positives keep us moving forward through the valleys on our journey.

With the idea of seeking something to celebrate in the face of whatever life throws at you, let’s go to the markets.

With all the headlines about recessions, tariffs, interest rates, impeachment, air strikes and Iran, no one would blame you if you were afraid to look at your investments. But the truth is that, despite the ongoing volatility, and this is a volatile market, we sit here today just a few percentage points below the all-time highs ever reached by the stock market. In fact, on the first day of the quarter, the S&P 500 set a new closing record.

In the graph above, the middle line is a trend line and the two outside lines form a channel that is one standard deviation from the trend line. These tools make great visual aids for demonstrating market volatility.

Overall, our portfolios have held up well through the volatility, with quality dividend-paying stocks, real estate investment trusts (REITs) and even quality Master Limited Partnerships, (MLPs) attracting investment when the stock market gets choppy. Now this is not to say that these investments will not experience a price drop in a bear market, history shows otherwise. But, because the purpose of these investments is to derive income, a technical, not fundamental, drop in price will typically be an investment opportunity and money flowing to any investment will eventually lead to a rise in price.

As the trend is still up, our focus is maintained on those investments that will perform well in uptrends and watching out for any potential catalysts which may cause for a substantial short-term trend reversal. We refer to those issues as the things that keep us up at night.

Recession Watch

While we were not able to find reliable data about the number of news stories warning about a potential recession, they seemed to hit a crescendo in August coinciding with the volatility we saw in the market. Key drivers of many of these stories were the ongoing inversion of the yield curve as well as the impacts a prolonged or escalating trade war with China would have on the economy.

Almost on demand, Bloomberg published a rather well put together, data driven article regarding the current state of the economy.

Without republishing the whole thing, we highlight the following:

The Bloomberg Economic Surprise Index has reached an 11-month high after four indicators released Thursday, including existing home sales and jobless claims, each surpassed expectations. The gauge continued to advance after swinging to positive from negative on Tuesday for the first time this year. The data also pushed a similar measure produced by Citigroup Inc. to the highest level since April 2018.

In addition, an industry report on August existing home sales sailed above all forecasts following a report Wednesday showing the strongest pace of housing starts since 2007, signaling that residential construction may add to economic growth in the third quarter for the first time since the end of 2017.

Last quarter, we discussed The Conference Board Leading Economic Index® (LEI) for the U.S. and the readings we were getting from that. Again, from Bloomberg:

Elsewhere, the unchanged reading on the Conference Board’s index of leading economic indicators — a barometer of future growth — compared with projections for a decline.

Based on the data, while we may see some slowing in the growth of the economy, we are still seeing growth. A recession is, of course, a contraction of economic activity, not a slowdown, and; as we have asserted in prior letters, recessions are usually caused by negative economic events. Without a discernible catalyst to retard economic activity, there is no reason at this time for the economy not to keep moving forward, although possibly at a different, perhaps lower, rate of growth.

We are not alone in our position. In a recent video titled “Expansions don’t Die of Old Age”, Steven Dover, the Head of Equities for Franklin Templeton, a major investment management firm, notes that the record for the longest economic expansion is not 10 years or even 15 years, but now over 20 years in the country of Australia, which likely coincides with their proximity to the Asian continent, particularly China.

He then makes the point that, at least for the foreseeable future, interest rates have stopped rising while inflation remains tame by historic standards which is bullish for stocks, and; while both China and the Eurozone are experiencing tepid growth, it is still growth.

One other piece of data that gave us a positive surprise was household debt service payments as a share of disposable personal income. As ongoing observers of the economy, we are often reminded that total household debt has reached record levels as depicted by the chart below.

But another chart, courtesy of Statista.com, gives a much different perspective on household debt. The chart below depicts the debt service payments of household debts as a percentage of disposable personal income.

As you can see, as a percentage of disposable income, debt service payments have been trending downward. While an overall growth in debt, especially auto and student loan debt is always troubling and ill advised, the growth in personal disposable income seems to be keeping up with the debt load.

This aligns with the increases we observe in consumer spending data, which is seen as a key driver of economic performance.

Interest Rates and the Yield Curve

As noted above interest rates, as driven by the Federal Reserve’s monetary policy, have stopped increasing for the foreseeable future. At its latest policy meeting on Wednesday, the Federal Reserve cut interest rates by 25 basis points to a new target range of 1.75% to 2.00% and telegraphed a strong likelihood of one more rate cut by the end of the year.

Not only did the Fed cut rates, but their members actually increased their expectations for the domestic economy. An article posted on the Yahoo finance site reported:

Despite all the noise, the committee’s economic projections on components of the U.S. economy paint a brighter picture domestically. Policymakers raised their projections on U.S. GDP growth, with the median member now projecting GDP growth of 2.2% in 2019, a notch up from the median projection of 2.1% in the last dot plot release in June.

Much of this is buried in the cacophony of outrage over President Trump’s criticism of Fed policy and his call for interest rates below zero.

In theory we can make the point that interest rates on U.S. government debt should be lower than that of other issuing countries. If we think about the concept of credit risk, it would make perfect sense that the strongest financial entities would be able to issue debt at the lowest rate of interest, and vice versa.

However, it is our belief that negative interest rates are generally the result of fiscal policies that have been a wet blanket on most of the world’s largest economies for well over a decade. Governments that already place high taxes and burdensome regulations on their industries and populations have no other means of getting the consumers to spend whatever money they have left than to make it more costly for them to store it in a bank. They believe that over the long run, doing this will stimulate growth and more importantly, raise inflation, which is the only way most countries will ever deal with their ballooning levels of national debt.

Since interest rates now seem to be a tool for financial manipulation, it is impossible to apply economic principles to the current environment. We would at least hope that Chairman Powell has learned the lesson that you cannot play catch-up with rates as he tried to do over the last two years. The Fed started aggressively raising rates while reducing the size of its own balance sheet in the hope of rebuilding its ability to deal with the next downturn. As we stated back then, the Fed was on a course to be the cause of the next downturn.

Many investors, particularly retirees, use government debt, particularly 10-year Treasury Bonds, as important components of investment portfolios. Therefore, driving interest rates down to keep up with the rest of the world’s central banks could have adverse economic consequences on a substantial portion of the US population. The Federal Reserve must walk a very narrow tight rope in trying to balance its policies across a diverse range of economic needs.

In the short term (as noted above in the Recession Watch section) the current pause in interest rate increases is already stimulating the housing market and will continue, rightly or wrongly, to drive investment in higher risk assets such as stocks, corporate bonds and REITs.

The yield curve made headlines several times this quarter as, along with China trade, the purported reason for a market sell-off. However, many financial observers are coming around to a conclusion like ours, that U.S. Treasuries are one of the few places left to store cash.

According to CNBC:

About $15 trillion of government bonds worldwide, or 25% of the market, now trade at negative yields, according to Deutsche Bank. This number has nearly tripled since October 2018. Historically, people give the government their money, instead of spending it, with the promise of being paid back, with interest. Now, governments are essentially getting paid to borrow money, as people become increasingly desperate for a safe haven for their wealth.

In a scenario like this, it’s just logical that U.S. Treasuries – which many investors view as the ultimate “safe haven” apart from gold, would be in strong demand.

There are very few laws in economics, but one that has stood the test of time is the law of supply and demand. As demand for positive-yielding treasuries increases, the price of those bonds will go up which means that yields will go down. In the CNBC article, which was published in August 2019, the writer notes:

The yield on the benchmark 10-year Treasury note, was lower at 1.595% on Wednesday, the lowest level since October 2016 and 40 basis points lower than it was one month ago. The yield on the 30-year Treasury bond also dropped as low as 2.164%, near an all-time low hit in 2016.

With 10 and 30 year Treasury bond yields dropping so precipitously, while short term yields, which are more highly impacted by Fed policy, were staying steady, or slightly increasing, it should be no surprise that we would see an inversion between the short- and long-term rates.

This is not to say that an interest rate inversion is no longer a harbinger of bad economic news. The prolonged negative rates we are seeing in major economies around the world including India, New Zealand, Thailand, Japan and the European Union (ECB) are a reaction to the ongoing weak economic data coming from those regions. At some point, these weak global economies will have an impact on ours, potentially to the point of contraction. Even if it’s mild, given the lingering memory of the 2008-2009 crash, a market over-reaction is not inconceivable.

China Trade

The on-again, off-again negotiations between China and the US are on again as the two sides have agreed to resume talks in October. In September, President Donald Trump delayed the next round of tariff increases on Chinese goods until after trade talks that are scheduled for early October while the Chinese announced that they will exempt US soybeans, pork and some other agricultural products from additional tariffs according to reports in The Business Times (September 14, 2019).

Public brinksmanship by either side is often met with a knee-jerk sell-off in the US markets, while acts of “good faith” have an opposite and often equal affect. In each case, the impact is short lived and doesn’t even show up on the daily stock index charts.

We continue to see evidence that the tariffs have exasperated Chinese economic ambitions, however, this is a government that can afford to play the long game if they can keep their citizens at bay.

If they can maintain control, they are more likely to wait until the 2020 elections in hope of a more agreeable administration taking over.

India – Pakistan

In a different time, the threat of nuclear war would dominate headlines and the world would be actively campaigning to bring about a peaceful resolution between the two sides. To our surprise, there were few headlines recently as the conflict between India and Pakistan spilled over into the annual U.N. General Assembly that took place in New York City in September.

As reported in the Albany Times-Union, Pakistan’s Prime Minister, Imran Khan, pointedly accused Indian leader Narendra Modi of “cruelty” in the Muslim-majority region of Kashmir and warned of catastrophe if the two nuclear-armed nations tumbled into war. Saying the United Nations had a responsibility for robust involvement in the problem, he said inaction would produce bad results.

Modi, in his address an hour earlier, took a starkly different approach: while raising the specter of terrorism — a nod to the reasons he cited for clamping down on the region, angering Pakistan — he never uttered the word “Kashmir” and focused on India’s economic and infrastructure development.

The two countries have been locked in a standoff since Aug. 5, when Modi stripped limited autonomy from the portion of Kashmir that India controls and it was hoped that the move toward some type of resolution could be revived during the U.N. meeting. However, it looks like the anticipated progress fell way short of even the most modest goals.

While the threat of nuclear war is still a long way off, the potential for escalation of armed conflict is very real.
North Korea and Iran

Like many, we are disappointed that the U.S. has not been able to bring North Korea closer to a more peaceful position in the world. Just like “Lucy with the football”, every time we get close to the winning kick the ball is pulled away.

There are several theories offered for this. They range from North Korea being nothing but a puppet regime for China to the North Korean leader, Kim Jong Un, being fearful of giving up totalitarian control and placing his position and his life at risk. We may someday learn what is really going on in this country, but it is important to remember that these regimes can last a very long time, especially if they are being propped up by economically stronger trade partners.

Iran presents a rather interesting situation. A decade ago, the recent attack on Saudi Arabian oil facilities, which have been attributed to Iran, would have sent the markets into a tailspin. But now that the United States is a net exporter of oil, it produced only a slight and temporary uptick in oil prices and has had negligible impact on the US markets.

Like North Korea, Iran’s regime is also propped up by more economically stable trade partners, including the European Union whose member countries have signed numerous trade agreements with Iran since the signing of the July 2015 nuclear deal. Are they dealing with Iran because they believe the threats we hear about are overblown, or do they hope that by increasing economic cooperation, they will be able to persuade the regime to play a more constructive role in the Middle East, especially in Syria, and to engage with the Gulf states?

These issues, Pakistan and India, North Korea, and Iran, present risks based on their abilities to create instability throughout the regions they inhabit. However, we believe that this type of risk is nothing new and is already priced into the markets. If, on the other hand, there was a significant break-through, meaning lasting agreements that were both enforceable and verifiable, that would be an unexpected positive development.

Strange Happenings in the Repo Market

In what was a disturbing reminder of the 2008 – 2009 credit market upheaval, the New York Fed was forced to intervene in money markets due to a sudden surge in short-term borrowing costs in the morning of September 17th.

As reported by Bloomberg:

The Federal Reserve took action to calm money markets, injecting billions in cash to quell a surge in short-term rates that was pushing up its policy benchmark rate and threatening to drive up borrowing costs for companies and consumers…

Money markets saw funding shortages Monday and Tuesday, driving the rate on one-day loans backed by Treasury bonds – known as repurchase agreements, or repos – as high as 10%, about four times greater than last week’s levels, according to ICAP data.

More importantly, the turmoil in the repo market caused a key benchmark for policy makers – known as the effective fed funds rate – to jump to 2.25%, an increase that, if left unchecked, could have started impacting broader borrowing costs in the economy.

What is the Repo market?

The Repo market is not really a place, but a financial system that allows participants that own lots of securities (usually Treasury bonds) but are short on cash to cheaply borrow money. And it allows parties with lots of cash to earn a small return while taking little risk, because they hold the securities as collateral for the loan. A key feature is that the cash borrower agrees to repurchase those securities later, often as soon as the next day, for a slightly higher price, hence the name “repo”. That difference in price determines the repo rate.

Think of someone who may be debt free with $100,000 in the bank but needs $2000 cash to make a transaction and has found that the local ATM is out of order. That person may pledge their car to someone who has the cash in order to make the $2000 transaction and then, when the bank is open, withdraw the cash from their account and pay off the loan, releasing the lien on their car.

The financial media pointed to several potential causes for the sudden dearth of liquidity:

These include the Fed’s recently concluded quantitative tightening (“QT”) program – which saw the Fed shrink its balance sheet by more than $1 trillion over the past couple of years… the dramatic increase in debt issuance by the U.S. Treasury this year… post-financial crisis rules requiring banks to hold greater reserves… and even Monday’s corporate-tax payment deadline, among others.

There are several good articles about this published by several credible organizations and each one provides one or more reasonable explanations as to the cause. However, the reality is no one is really sure why it happened.

Still, the consensus among most financial professionals – including the Fed itself – is that this is merely a temporary problem that can be easily corrected by the Fed’s short-term interventions. We will keep an eye on this.

In Summary

As the title suggests, our approach is to continue to invest in the uptrend until we have strong confirmation of a trend reversal by the market. The economic backdrop remains favorable. We have low inflation, low interest rates, cheap energy, a strong dollar, wages at a 10-year high and unemployment at a half-century low. Yes, second quarter corporate profit growth slowed a bit from the first quarter. But the earnings outlook is still positive.

Until things change, the trend is still our friend.

Read More

Thanks to you we did it!

By Ron Chandler

A little less than a year ago, Paul Neuberger the Chairman of the 2019 Greater Milwaukee Heart & Stroke Walk / 5K Run asked me to join him on his Executive Committee to help raise money for this year’s event. Paul is a very passionate about this cause as his family has been touched by the disease and he set a very aggressive goal of raising $1,750,000, nearly double the highest amount that had ever been raised.

After months of meetings, phone calls and emails, I am thrilled to report that as of the day of the run, the 2019 Team had raised over $1,396,000. While short of our goal, it is certainly an impressive effort, and; even though the Heart Walk took place on September 21, donations are still being are collected through October.

For our part, between personal donations and the support of our friends and colleagues, Team Summit was able to raise $17,744.00 for this cause, far outpacing several larger investment management firms in the area.
Thanks to everyone who supported us in our efforts this year, without you, none of this happens!

Team Summit

Read More

Surfing the Stock Market

by Ron Chandler

Last weekend, I went to the beach with my oldest daughter to let her play in the waves. The area we visited is apparently a prime area for surfing and there were many people out that day riding the waves.

Stock Market Candlesticks as Surfing WavesAs time went on, I noticed that most of the people surfing were in a state of constant motion. With each wave that rose up, they would scramble to get in front of it and stand on their boards, only to end up back in the water within seconds. They would then retrieve their boards and try to catch the very next wave, often not even making it back out to their original starting point before attempting another ride.

There was little thoughtfulness to what they were doing, just a mad scramble to catch each wave that came by. It didn’t take long for exhaustion to overcome them and any hope of a sustained ride disappeared.

Out a little farther out from all of this was someone I would call a more seasoned surfer.

By that I mean his hairline had receded quite a bit and his hair color was more gray than any other color. He was sitting, almost idly, on his board as wave after wave passed by. He was out there just sitting on his board for so long, I started to wonder if he was intending to surf, or just float out on the waves all day.

After a great deal of time had passed, a rather large wave started to form, and he quickly turned his board and started paddling. When the wave reached him, he stood up with very little effort and surfed for quite a distance before turning back into the wave and cannonballing into the water. He then retrieved his board and proceeded to paddle back to his original spot and once again, just drifted along as wave after waved passed under him.

In the time we were there, about two hours, he may have only surfed four or five waves. But each ride was long and seemed to be both effortless and enjoyable.

As my mind never seems to be too far from investing, it seems like this was a perfect metaphor for what we see in the investment world today.

Since the advent of cable TV and on-line brokerage accounts, we have increasingly been conditioned to engage in trading strategies versus investments. If you have the volume off, it is hard to tell if you’re watching CNBC or ESPN. People are encouraged to buy the latest market analysis tools and pay for training courses and subscriptions promising “$30,000 in 30 days flat”, or “90 days to six figures” (these are actual email subject lines) offered by the latest investing superstars.

Then, loaded up with all their new tools, they wade into the markets intent on making a killing. And just like most of the surfers we watched, trying to catch every wave and ride it in to shore, these newly minted traders begin trading everything based on technical analysis, trading programs, “expert” recommendations, stocks of the day announcements, etc. And like those many surfers, exhaustion and frustration soon sets in, causing them to either seek more tools and subscriptions, or give up on the “rigged market” altogether.

All the while, the legendary investors like Warren Buffett, Howard Marks, Peter Lynch and Bill Miller invest with the patience of that seasoned surfer who only surfed the best waves when the time was right. Instead of throwing money at every hot idea that passes by, they only invest in the right stocks when the situation is in their favor.

Man Surfing Representing Expert Stock Investing

Let’s take the metaphor one step further with Buffett, for instance. Like the surfer who only rode four or five waves in the time I was watching, Buffett has, according to Yahoo Finance, a stock portfolio with 20 stock positions. Given his decades of investing, 20 stocks is not a large number, but even those are highly concentrated in only five stocks; Apple, Bank of America, Coca Cola, Wells Fargo, and American Express. Apple alone makes up a whopping 23% of his total capital portfolio. In other words, when you catch the great wave, ride it with conviction until it no longer meets your need.

I don’t know what makes a great wave to surf and it will take some time watching great surfers (and probably taking a lesson or two) to learn their criteria. But I have watched great investors for decades and I do know what they think makes a great company to invest in:

  • Provide a product or service that fulfills a need or want in ways that are difficult to duplicate
  • Strong balance sheet
  • Consistent revenue growth
  • Consistent profit margins
  • Consistent positive free cash flow
  • Trading at a discount to its warranted value

For that last item, I use Cash Flow Return on Investment (CFROI) to determine whether a stock is trading at a premium or discount. When I find a stock that meets these criteria, it’s time to yell, “Surf’s up!”

Read More

Top 3 Things to Know When Hiring Help

Guest Article by Marco Briceno from The Starr Group, a  Summit Pinnacle Provider

The other day I was talking with the IT Director at The Starr Group about how I don’t like to mow our yard or shovel the snow. He asked me why not hire a neighborhood kid to help me and pay him a few bucks (something I did not consider).

Millions of Americans with all kinds of financial means hire out occasional household services, ranging from babysitting, to housekeeping and yard work. Many do not know when they hire someone, you open yourself up to certain liabilities if something goes wrong.

You can read the full article on LinkedIn.

Read More

Second Quarter 2019 Market Review

Q2 2019 – The Fed Rides to the Rescue

The US market as measured by the S&P 500 continued the upward trend with a gain of 3.93% in April but then quickly reversed course in May, falling 6.58% for the month.

While many people want to point to the “trade war” between the US and China for the market volatility, we would like to remind you of what we noted in our Q-1 letter. The markets turned around from their disastrous December finish after the federal Reserve Board undertook a more dovish stance on raising interest rates. In it we said:

The best explanation, in our opinion, was the March 20th decision by the Federal Reserve to hold interest rates steady along with an indication that there will be no more rate hikes this year.

Buried in the headlines underneath all of the daily chatter about tariffs, the Mueller investigation, and severe weather was the May 1st Federal reserve meeting where the Federal Reserve announced that they were going to hold the benchmark interest rate steady at a target range of 2.25% to 2.5%,

Prior to that meeting, there were rumblings, albeit premature in our opinion, that the Fed would actually move to cut rates.

The market seemed to be climbing in anticipation of such a move as well. When it did not happen, the market did what it has done since the Fed started their interest rate intervention back during the Great Recession; it threw a tantrum. Moreover, according to an article published on Yahoo.Finance:

The central bank’s statement walked back its March view that the economy had “slowed” from the end of last 2018, noting that recent developments show that economic activity “rose at a solid rate.

Which the market took as a signal that rate cuts would not be forthcoming at the next meeting or possibly for the entire year.

We’ve given you the statistics on the trade war before and they simply do not, in our opinion, account for the violence of the sell-offs that we have seen as, according to S&P Dow Jones, only 4.3% of all S&P 500 revenues came from China based on the latest data reported.

However, we have seen the markets highly reactive to the Fed and their statements. A broad sell-off over disappointment over no coming rate cuts seems to be a much more plausible explanation for the market’s selloff in May.

This theory is further reinforced when, on June 3rd, the market had its best day in the last five months after Chairman Powell announced that policy makers will ‘act as appropriate to sustain the expansion’.

Powell’s remarks came after St. Louis Fed President James Bullard said on June 2nd that rate cuts “may be warranted soon” amid the U.S.’s international trade disputes.

All of this “coincided” with a June gain of 6.89%, the best month since January of this year. For the first six months, the S&P 500 is now up a healthy 18.5% While the Dow and the Nasdaq are up 15.4% and 21.3% respectively (source: FactSet).

Looking at the yield curve concerns, the 3 month and the 10-Year Yields are still inverted, however both the 2 and 10-year and the 10 and 30-year are not, so we will see what happens both with fundamental economic data as well as interest rates during the second half of the year.

One such measure of economic activity is the The Conference Board Leading Economic Index® (LEI) for the U.S. From their website,

The composite economic indexes are the key elements in an analytic system designed to signal peaks and troughs in the business cycle.

The ten components of The Conference Board Leading Economic Index® for the U.S. include:

  • Average weekly hours, manufacturing
  • Average weekly initial claims for unemployment insurance
  • Manufacturers’ new orders, consumer goods and materials
  • ISM® Index of New Orders
  • Manufacturers’ new orders, nondefense capital goods excluding aircraft orders
  • Building permits, new private housing units
  • Stock prices, 500 common stocks
  • Leading Credit Index™
  • Interest rate spread, 10-year Treasury bonds less federal funds
  • Average consumer expectations for business conditions

The last measure for the U.S. was unchanged in May, remaining at 111.8 (2016 = 100), following a 0.1 percent increase in April, and a 0.2 percent increase in March. Their interpretation of that reading is that:

While the economic expansion is now entering its eleventh year, the longest in US history, the LEI clearly points to a moderation in growth towards 2 percent by year end.

Economic indicators are a way to take the temperature of the U.S. economy. One or two negative readings could be meaningless. But when several key indicators start flashing red for a sustained period, the picture becomes clearer and far more significant. In our view, that time has not yet arrived.

Nearly all recessions in our lifetimes required a catalyst of some sort to reverse economic growth. Possibilities could include war with Iran, a 2008 style credit collapse, or a severe global slowdown. We will stay vigilant.

Trade

The latest news on the “Trade Wars” is really no news at all. It looked in March that some kind of a deal was imminent, and then (from CNBC):

The diplomatic cable from Beijing arrived in Washington late on Friday night, with systematic edits to a nearly 150-page draft trade agreement that would blow up months of negotiations between the world’s two largest economies, according to three U.S. government sources and three private sector sources briefed on the talks.

The document was riddled with reversals by China that undermined core U.S. demands, the sources told Reuters.

In each of the seven chapters of the draft trade deal, China had deleted its commitments to change laws to resolve core complaints that caused the United States to launch a trade war: theft of U.S. intellectual property and trade secrets; forced technology transfers; competition policy; access to financial services; and currency manipulation.

U.S. President Donald Trump responded in a tweet on Sunday vowing to raise tariffs on $200 billion worth of Chinese goods from 10% to 25% on Friday – timed to land in the middle of a scheduled visit by China’s Vice Premier Liu He to Washington to continue trade talks.

The US began planning to hit an additional $300bn of Chinese goods but, at the G20 in Japan in June, President Trump called that off and said he would continue to negotiate with Beijing “for the time being.”

We still believe that some type of a deal is possible as does Alexander Green of the Oxford Club who on July 10th wrote:

China sells a lot more to us than we do to them. Our economy is the envy of the world. Theirs is slowing – and the growth they do have is almost certainly overstated in their official numbers.

Every day the Communist leaders are hearing from disgruntled manufacturers, distributors and exporters, and from foreign companies and investors who are voting with their feet, moving operations to Vietnam, India and Taiwan, or simply forgoing investment in China as too risky or uncertain.

That’s why you should expect a trade deal, not just before the election but before the end of this year – and perhaps in a matter of weeks.

We don’t believe that you can time the stock market, much less a deal with a foreign nation. However, we are happy to see many trade deal skeptics starting to agree with us. If a trade deal does happen, it will most likely spark a further move upward in the market.

Read More

First Quarter 2019 Market Review

Q1 2019 – Climbing the Wall of Worry

The stock market these days seems to be a little like spring time in Wisconsin. If you don’t like what’s happening, just wait a day and it will be better or worse.

After enduring a really, tough December that saw the S&P 500 fall by an unsettling 9%, January came in with an impressive 8% rise and ongoing gains to close the quarter up 13.65%. That’s oftentimes a good year!

Just as we heard many reasons for the end of year downdraft (which technically nearly became a correction), we heard several reasons for the recovery this past quarter. The best explanation, in our opinion, was the March 20th decision by the Federal Reserve to hold interest rates steady along with an indication that there will be no more rate hikes this year.

The announcement comes three months after the central bank raised rates for the fourth time in 2018 and said two hikes would be appropriate in 2019. The central bank also says it will complete its balance sheet roll-off program at the end of the September which we considered to be an additional “stealth” rate hike in terms of decreasing liquidity.

This reversal in policy began long before the FOMC meeting at the end of January. On January 4th, Fed Chairman Powell mentioned muted inflation and a patient Fed in his remarks at the American Economic Association meeting in Atlanta. A week later, he was proclaiming patience again, this time before the Economic Club of Washington.

Apparently, “patience” had been on Fed policy-makers’ minds for some time. The minutes of the December FOMC meeting, released in January, already contained the word ‘patient’ and the ‘muted inflation pressures’ that crept into the January statement. They were attributed to ‘many participants’ who may have been chafing in the aftermath of Powell’s December press conference which preceded (and may have been the proximate cause of) a market downturn.

Anatomy of a Fed Backpedal

We have no claim to knowledge as to why the Fed reversed course so abruptly. Was it President Trump, Goldman Sachs or the Rothschilds? All we do know is that, as far as monetary policy goes, the Federal Reserve has removed itself as a stumbling block for further gains in the market.

Of course, when one door closes, another opens and the Fed’s actions were not without consequences, perhaps unintended.

The Yield Curve Inverts!

Thanks to a sudden surge of buying that pushed long-term rates sharply lower after the March announcement, the yield curve is now “inverted.” This warning has preceded “seven of four” recent bear markets (more on this in a moment). Time to be safe and sell everything?

That’s been the cry in the financial media the last few days as we faced the dreaded inverted yield curve.

Should we be scared? Should we change our investing strategy?

No and no.

The yield curve – especially an inverted yield curve – is a legitimate economic indicator and we should not dismiss it.

But, at the same time, it’s not as simple as the headlines make it out to be. Nothing ever is and it’s critical that we put things into the proper context.

What is an Inverted Yield Curve?

In case you’ve never took an economics class, let’s start with an explanation of what the yield curve is.

Basically, the yield curve is the measure of interest rates (or yields) from short term to long term. As a rule, short-term yields should be lower than long-term yields. This is known as a normal yield curve. If you’re going to park your money in a long-term bond, you want a higher yield to offset any risks that may develop while your money is invested.

The yield curve “inverts” when short-term rates become higher than long-term rates. So, if a short-term rate is higher than a longer term rate, that part of the yield curve is inverted.

This is what just happened by one measure. The yield on three-month U.S. Treasury bonds ticked higher than the yield on 10-year U.S. Treasury bonds.

In simple terms, the U.S. government is paying you more for lending them money for three months than if you decided to loan them money for 10 years.

This created short-term turbulence because an inverted yield curve is often associated with a looming recession.

Before we go any further, let’s make two critical points: First, a recession is not a given. Yes, there is a business cycle and someday we will have a recession but, and this is the second point, all indications are that it’s still potentially a long way off.

Critical Context

Information without context is almost as bad as no information at all.

Without the proper context, you are more susceptible to bad decisions that can cost you money from bad investments, missed opportunities, or both.

Here are two critical points of context to keep in mind:

Critical Context Point 1: There are large number of interest rates that are considered either “short-term” or “long-term.” That means there are also a large number of different rates to compare in search of a yield curve inversion.

All the recent headline noise came from the 10-year yield dipping below the three month yield.

Another yield comparison that gets a lot of attention is between the 10-year and 30-year yields. That part of the yield curve has not inverted. In fact, just the opposite. The spread between the two has increased, which is considered very healthy.

A third yield relationship that is frequently referenced is two-year yields versus the 10 year yield. This has not inverted either. Interestingly enough, the last five times it has inverted, the S&P 500 continued higher and peaked 19 months later. If that scenario happened today, we’d be looking for a peak in October 2020.

There’s a lot of money to be made in that time. The mean return from when the two year/10-year relationship inverted to the market peak is 22.3%.

Now is not the time to get all defensive.

Critical Context Point 2: You must look at which end of the yield curve is moving.

In this case, the yield on three-month Treasuries was moving higher more than the 10 year yield is falling.

There’s a very simple explanation for that: The Federal Reserve has raised interest rates nine times in a little over three years.

The Fed has much more control over short-term rates. Long-dated yields are more market driven.

You need to watch both ends. The Fed last pressured short-dated bond yields in the 1990s, according to LPL. The short end of the yield curve inverted twice in that decade but the 10 year/30-year never did.

Fundamental Capital’s Troy Bombardia, a favorite source of historical finance information, has run the numbers on what happens to the S&P 500 when the 10 year “long” yield dives below the three-month rate:

  • In 1966, 1973, 2000, and 2006, an inverted yield curve indeed preceded a big stock market pullback (usually by a year or two).
  • Meanwhile in 1978, 1980 and 1989 it didn’t mean much. Investors who sold on this indicator likely regretted it.

From this analysis then, the record of yield curve inversions as an indicator of an imminent bear market is no better than mixed.

Nuclear Winter Warnings

While all eyes have been on the nuclear showdown between Trump and North Korea, our eyes have been looking at another area of the world that is not getting much attention.

India and Pakistan have long engaged in a festering conflict the veteran foreign reporter Eric Margolis has called “the world’s most dangerous crisis.”

Even so, this is the first time we’ve seen fit to make it a lead item on our list of what keeps us up at night. That’s how big a deal it is. If it went nuclear, there’s no telling what the impact on the world might be.

“It is almost unprecedented for two nuclear-armed countries to carry out air strikes into each other’s territories,” reports the BBC’s correspondent in Delhi and yet that’s what’s happened in recent weeks.

The trouble began on February 14th — well, really it began in 1947, but we’re getting ahead of ourselves — when a suicide bomber killed at least 42 Indian troops in the disputed territory of Kashmir. India’s government held Pakistan’s government responsible.

Events have escalated to a point that the Pakistani government claimed it shot down two Indian military jets and captured a pilot.

“India and Pakistan, both nuclear-armed, have fought four wars over divided Kashmir since 1947,” Mr. Margolis explains. That’s when the Indian subcontinent won independence from Britain.

Kashmir is a majority-Muslim territory. Two-thirds of it sits in Hindu-majority India. The other third lies in Muslim-majority Pakistan.

As international conflicts go, Kashmir is probably more intractable than Israel-Palestine and it’s way more perilous.

India’s conventional forces would overwhelm Pakistan’s in the event of all-out war. Pakistan’s only means of effectively fighting back would be tactical nukes. “Both sides’ nuclear forces are on a hair-trigger alert, greatly increasing the risks of an accidental nuclear exchange,” Margolis writes.

“Rand Corp. estimated a decade ago that such a nuclear exchange would kill 2 million immediately and 100 million in ensuing weeks. India’s and Pakistan’s major water sources would be contaminated. Clouds of radioactive dust would blow around the globe.”

A more recent estimate by Physicians for Social Responsibility pegs the numbers at 20 million dead in the first week and 2 billion from the resulting global famine.

The risk that hostilities could rapidly spiral out of control eased slightly after Imran Khan, Pakistan’s cricket-star-turned-prime-minister, announced he was returning the pilot to India in a “goodwill gesture.” Commander Varthaman was duly handed over to India. Mr. Khan — elected with military support just last year and still wrestling with a severe economic crisis — has also implored New Delhi to engage in dialogue and avoid any “miscalculation” that could lead to greater conflict.

So that’s a thumbnail sketch of both the background and the latest developments. If you want to know more, Google is your friend. Or you can read Margolis’ excellent book War at the Top of the World — complete with his firsthand accounts of getting shot at along the “Line of Control” in Kashmir at 16,000 feet above sea level.

Sub Prime Debt Bomb

We’ve seen a lot of news coverage and internet postings recently that work to rekindle investors’ worst fears of a return to the dark days of the financial crisis. Several articles have warned that consumer debt and loan delinquencies are rising, particularly in the auto space. But this doesn’t mean a crisis is brewing. Delinquencies and losses are only part of the story for subprime autos.

Loomis-Sayles’ Senior Mortgage and Structured Finance Analyst, Jennifer Thomas, provided the analysis below recently as to why Loomis-Sayles thinks that the subprime auto sector is in better shape than it gets credit for:
Borrower wage gains – worth the wait

Subprime borrowers tend to be lower-income earners. For this group, wage gains usually don’t materialize until late in the economic cycle. This has certainly been the case with the current cycle. A decade into the recovery, lower-income groups are only now enjoying strong income growth. But higher wages are worth the wait. Recent earnings relative to expenditures can have an impact on borrowers’ payment and default behavior. And compared to other workers, wage increases are especially meaningful for subprime borrowers, many of whom live paycheck to paycheck.

The chart below illustrates the late-recovery bounce in wages for retail workers (a proxy for lower-income earners).

Lenders and issuers adjust with the cycle

Borrowers aren’t the only group that influences loan performance. Lender and issuer trends vary throughout the economic cycle, which can affect credit patterns. But these aspects of subprime auto ABS get much less attention than the consumer angle.

In the middle of the cycle, as the benefits of monetary stimulus spread, lenders tend to “broaden the credit box.”

This means extending capital to non-prime borrowers. For the current cycle, this happened from 2015 into the first half of 2017. As the share of higher-risk borrowers grows, increased delinquencies and losses typically follow with a lag, which we saw in 2017 and 2018.

This latest rise in delinquencies and losses got plenty of media coverage. What got almost no attention were efforts by lenders to account for higher anticipated defaults and delinquencies. As the credit cycle matures, subprime lenders adopt more conservative underwriting practices. These lenders are credit specialists who price loans (by setting appropriate interest rates) to reflect late-cycle risks and cover anticipated future losses.

Asset-backed securities themselves also prepare for expected negative events with high levels of credit support.

This includes measures like excess spread—or the difference between the interest an ABS deal takes in and what it pays out to investors. For ABS investors, this extra capital is the first line of defense against losses.

Where we are today

Though headlines focus on the downside, auto loan quality is actually up on the whole. The Federal Reserve has commented on this, saying: “… the overall auto loan stock is the highest quality that we have observed since our data began in 2000.”[1] That said, I am always watching for risks. Right now, I am monitoring how pressures like rising rents and healthcare costs could affect subprime borrowers over time.

The chart below sums up subprime ABS throughout the cycle. It shows the impact of prior changes in underwriting practices (first loosening credit from 2015 through early 2017, and then tightening credit) and the recent benefits of stronger income growth among subprime borrowers. In fact, as wages rise, losses for the 2016-2017 vintages and recent ABS deals are improving. The shift to more conservative underwriting also appears to be underway, and I believe this will meaningfully impact future delinquency and ABS credit performance.

Fundamentals, not fear

It’s important to remember that subprime lending has not always had a negative image. It was originally heralded as the “democratization of credit,” extending capital to a new demographic of borrowers. But a broader borrower base brings with it more delinquencies and defaults. When the statistics look scary, investors shouldn’t lose sight of fundamentals. I think borrower health, and lender and issuer behavior are a much better yardstick for investors trying to determine how subprime auto ABS measures up.

While this is one opinion from one analyst, at one company, it is important to know that this is a company that has been around since 1926 and currently manages approximately $250 billion in assets across four different types of investment vehicles. They have been trading the fixed income markets for over 25 years. So, it is critical for them to get things right with respect to their own business interests.

China Trade Talks

While the Federal Reserve, India-Pakistan and sub-prime auto loans may not be getting many headlines from the various financial news channels, not a day seems to go by without something about China trade talks flashing across the screen (we keep the volume on mute to preserve our sanity as well as objectivity). It reminds us of an old Brady Bunch episode when the middle sister complained that all anyone ever spoke about was “Marsha, Marsha, Marsha.”

Our position on China remains the same. Economically, the tariff tussle hurts them more than it hurts us and that will lead to some sort of compromise deal that will be better than what we have in place today but will be short of the goal of a world of free trade. President Trump will meet with China’s Vice Premier Liu He as speculation grows that negotiations over a trade deal between the world’s biggest economies are entering the final stages.

We have learned from experience that it is unhealthy to hold our breath over these reports but, given Wall Street’s penchant for buying the “Devil you know”, if a deal is signed, regardless of its quality, it will be another speed bump removed from the current upward trend.

We Understand

If you’ve been reading our quarterly missives for a while, you can see that we never run out of things to keep us awake at night. We know that someday, there will be another recession and when that recession comes,

  • Unemployment will rise.
  • Government safety nets won’t prevent widespread hardship.
  • Safety net spending will scare bond market investors.
  • Interest rates will rise.
  • Economic problems will get worse.
  • The Fed and the federal government will quickly run out of policy tools.

We also know that the recessions in our lifetimes began with a triggering event:

  • 2009 Great Recession:

Collateralized Mortgage Debt

  • 2001:

Dot.com bubble burst + ENRON

  • 1990 RECESSION:

Oil shock (we went to war in the Middle East)

Junk bonds (a financial innovation from Wall Street at the time which was born from Michael Milken’s realization that arranging lending to companies with miserable credit ratings was a lucrative strategy for Drexel Burnham but which proved to be less lucrative for the actual lenders)

  • 1980-82:

Oil shock / Iranian revolution (oil was a much bigger part of our economy and we didn’t have hybrids or the level of US production that we have now)

Inflation (never fully cured from the early 70’s when we left the gold standard)

We can go back: 1973 (war + oil crisis + no gold standard). 1969 (Vietnam), etc., but the point is that recessions don’t just happen out of thin air, so we keep our eyes on the horizon and look for things that could cause our economy to reverse course.

In the meantime, there will be fluctuations in the market as fear continues to scare people into a run for the exits.

We continue to position our investments into strategies that take advantage of pull-backs and we constantly research and test ideas that would not only take advantage of pull-backs, but also add additional protections in the face of an eventual recession and the possible bear market that could accompany it.

Read More

Fourth Quarter 2018 Market Review

Q4 2018 –Will we have a recession in 2019?

We love the holiday season as it gives us time to visit with family and friends and step away from the market for a while, unless of course we have a market like we saw in this fourth quarter and people realize what we do for a living. With headlines like:

“U.S. stocks post worst year in a decade as the S&P 500 falls more than 6 percent in 2018”

“The S&P 500 and Dow fell for the first time in three years, while the Nasdaq snapped a six-year winning streak.”

“Major stock indexes posted their worst yearly performances since the financial crisis.”

“The Dow and S&P 500 record their worst December performance since 1931 and their biggest monthly loss since February 2009.”

We found ourselves pulled aside and being asked for investment advice or our opinion in hushed voices while celebration went on around us.

In fact, the S&P 500 and Dow Jones Industrial Average were down 6.2 percent and 5.6 percent, respectively, for 2018 which are their biggest annual losses since 2008. The Nasdaq Composite lost 3.9 percent in 2018, its worst year in a decade as well. However, these losses are not in the same ballpark as those recorded in 2008, when the S&P and the Dow fell 38.5 percent and 33.8 percent, respectively, and the NASDAQ dropped 40 percent.

For the fourth quarter, the S&P 500 and NASDAQ fell 13.97 percent and 17.5 percent, respectively, their worst quarterly performances since the fourth quarter of 2008. The Dow notched its worst period since the first quarter of 2009, falling nearly 12 percent.

A sizable chunk of this quarter’s losses occurred in December. The indexes all dropped at least 8.7 percent for the month. Traders on television and in the news had trouble pinpointing the cause of the extreme volatility: the S&P 500 was down more than 20 percent from its record high on an intraday basis on Christmas Eve, briefly meeting the requirement for a bear market, and then roared back the next session. The Dow jumped more than 1,000 points on Dec. 26 for its biggest ever single day point gain. The consensus seems to be building to chalking up December’s volatility to computer-driven trading.

Likely reasons given for the sell-off include:

  1. Concerns of an economic slowdown
  2. Fears the Federal Reserve might be making a monetary policy mistake
  3. Worries over ongoing trade negotiations between China and the U.S.

We’ll address each of these ideas below.

Reading the headlines and listening to the commentary during the December decline, you would have been led to think that the bottom had fallen out of the U.S. economy and that we were on the brink of the next Great Depression. We do not believe either to be the case. Before we provide our reasoning, let us first make sure that we are using these words properly instead of provocatively as many media sources tend to do.

The standard definition of a recession is two or more consecutive quarters of declining GDP. Since a depression is understood to be something worse than a recession, many people think it must mean an extra-long period and deeper level of decline. But that is not the definition of an economic depression.

Possibly the best definition ever offered came from John Maynard Keynes in his 1936 classic, The General Theory of Employment, Interest and Money. Keynes said a depression is “a chronic condition of subnormal activity for a considerable period without any marked tendency towards recovery or towards complete collapse.”

Keynes did not refer to declining GDP; he talked about “subnormal” activity. In other words, it’s entirely possible to have growth in a depression. The problem is that the growth is below trend. It is weak growth that does not do the job of providing enough jobs or allow a government to stay ahead of the national debt.

According to the website Trading Economics, the GDP Growth Rate in the United States averaged 3.22 percent from 1947, the end of the Great Depression, until 2018. However, according to the website Statista, the average real GDP growth from 2000, when we were in the middle of the dot.com crash, until 2017, the last annual datapoint we have to examine, was 1.97%.

Over the first three quarters of 2018, US GDP advanced at an average rate of 3.3%. If growth in the fourth quarter continues at or near that rate, one could argue that, by Keynes definition at least, we might just be emerging from an eighteen-year depression.

This does not, however, mean that the market will continue to rise unabated. As we can see the chart below of the S&P 500 from 2000 to 2018, in both 2011 (1.6% GDP growth) and 2015 (2.9% GDP growth) the stock market temporarily swooned despite continued economic growth. Again in 2018, the stock market reminded us that, in the short term, it can have a mind of its own.

S&P 500 Monthly Chart 2000 to 2018

Interest Rates are Still Key

Despite what you may be hearing during your ride home, seeing on the news, or reading in your news feed, the Federal Reserve’s interest rate policy is still the number one issue driving the markets. In December, the policymakers raised the central bank’s benchmark borrowing interest rate to 2.5%. This was the fourth rate hike of 2018. Previously, they had only raised the rate four times since December 2015.

In a press conference following the December meeting, Jerome Powell also noted that rates this year were raised more times than expected because the economy was stronger and healthier than anticipated. But the Fed went on to lower its expectation for gross-domestic-product growth in 2019 by 0.2 percentage points to 2.3 percent.

Low interest rates have been the key ingredient in the almost 10-year-old market uptrend we have experienced since 2009 and the prospect of rising rates is if it makes other investments look more appealing, it makes price appreciation-driven growth much harder to come by. Recall that it was immediately after the January 2018 meeting when the Fed announced their plan for three rate increases that the market immediately experienced a two-week sell-off.

In addition to the rate hike and the projection of at least two more increases in 2019, Chairman Powell also stated that the Fed’s quantitative tightening would continue at its current pace. Quantitative tightening is the reversal of the quantitative easing policy the Federal Reserve, along with several other central banks, engaged in after the near financial collapse of 2008.

Quantitative easing is the process whereby central banks essentially create money by depositing money at private banks and other financial institutions and then buying securities from them, with the money remaining in those institutions. The intention, the central banks hope, is that this money will be loaned out to corporations and consumers in order to spur business activity.

In reversing the process, the central bank sells securities back to the financial institutions, thus draining money from the amount that the banks have on hand. That reduces the amount of money they have to lend, which, again, other things being equal, should raise the cost of money to borrowers, or interest rates.

In the U.S., the Fed ended its asset purchases in 2014 but continued to reinvest interest payments and the proceeds of matured bonds into new securities, leaving the size of its portfolio mostly unchanged. On June 14, 2017, the Fed announced it will begin reducing its portfolio holdings as the U.S. economy has finally shown sustained growth. The current pace is running off as much as $50 billion of the Fed’s bond portfolio each month. However, like QE before it, QT has never been done before, especially on such a massive scale. This worries many investors because the likely effect is that it will raise the cost of borrowing and reduce asset prices.

The impact of the rate increase and the chairman’s comments afterward started the reversal that wiped out the gains of 2018.

Some pundits have claimed that the Fed needs to raise rates so as to have more “ammo” to respond to the next slowdown. To that, our response is that it would seem rather foolish if, in the act of preparing for the next slowdown, the Fed’s actions directly cause one. Additionally, given the recession discussion above, we would point to how ineffective the Fed’s past accommodative policy (low interest rates plus quantitative easing) was for the economy.

We believe that individual stocks and the broader markets are driven primarily by corporate earnings and interest rates and so we would expect the volatility in the market to continue to rise and fall with every Fed statement and speech.

To punctuate this point, as we sit here writing this, the market is now up over 3% today “after the Federal Reserve chairman, Jerome H. Powell, said the central bank’s approach to monetary policy would remain flexible in the face of market turbulence and signs that the global economy is slowing.” – Source: Marketwatch

One last comment about market volatility, while causality is difficult to prove, we do believe this volatility is being driven mostly by computers.

According to an article this week in the Wall Street Journal, about 85 percent of all trading is controlled by computers. And I don’t mean that humans use computers to make the trades, I mean the computers are monitoring trading activity, market data and even political rhetoric and then making instantaneous decisions on what and how much to buy or sell. As the WSJ article put it, the volatility we’ve been seeing in the stock market is being driven mostly on autopilot.

This explains the speed with which these swings in the market are happening. Whereas a human might wait to make a move, perhaps being intimidated by the impact a big purchase or sale would have on the markets, computers are programmed to act the instant the market changes.

It is impossible to know how the stock market would have reacted over the last month if humans were still in charge. But the thought is that losses that occurred in a day may previously have taken a week, or month, etc.
The other thing speeding up trading is that the majority of the remaining 15 percent of investors who make their own trades trust the computers. When the computers start selling one thing heavily, these investors tend to jump on board, moving together like a herd.

Economists are having a tough time interpreting market volatility because of the computers. They can’t tell if the market is showing us the reality of the global economy to come, or if computers are simply amplifying normal “year-end nervousness.”

Regarding China and Trade

We believe that with news channels running 24 hours per day, they have an ongoing need to find something new and interesting to explain market activity. The trade war with China has been a favorite go-to explanation ever since President Trump announced tariffs on Chinese steel exports and other goods coming into the U.S.
First, let’s examine the facts as we know them:

According to the financial website, The Balance, in 2017, (the date of the most recent data available) U.S. exports to China were only $130 billion while imports from China were $506 billion.

The United States imported from China $77 billion in computers and accessories, $70 billion in cell phones, and $54 billion in apparel and footwear. A lot of these imports are from U.S. manufacturers that send raw materials or components to China for low-cost assembly. Once shipped back to the United States, they are considered imports.

China imported from America $16 billion in commercial aircraft, $12 billion in soybeans, and $10 billion in autos.
According to the World Bank, in 2017, Chinese exports were $2.3 trillion and accounted for 18.48% of China’s GDP, which was approximately $12 trillion in 2017. For the United States, total exports were $1.5 trillion, representing 7.94% of our GDP.

So, doing some very simple math, adding a 25% tariff to Chinese imports would represent a $126 billion tax hike to the over $19 trillion U.S. economy. While certainly not insignificant, it does not seem as important as the 46% increase in the prime rate of interest since 2016.

As far as which side has leverage in the negotiations is concerned, in 2017 China accounted for approximately 9% of our total exports while we represented nearly 22% of theirs. So, while certain multi-national businesses may be hurt in the short-run, as we saw with Apple, it is pretty clear that other than slightly higher prices for computers, cell phones, apparel and footwear, our economy is not very sensitive to any possible Chinese retaliatory measure. Additionally, many other countries would be more than capable of absorbing the demand for these goods, should the current situation drag on and the multi-nationals choose to relocate their operations in order to reduce cost.

While we don’t like making predictions, given the constant table pounding by the large U.S. companies, we believe that we will probably end up with another last minute New-NAFTA-like deal with better terms than we had before, but still with less than the President desires (a tariff-free world). Of course, post-deal enforcement is another issue.

In any event, we expect 2019 to be a very interesting year!

Read More

Third Quarter 2018 Market Review

Q3 2018 – How Long will the party last?

The stock market has many old sayings, from “buy the rumor and sell the news” to ”as goes January, so goes the year.” And let’s not forget this memorable one: “Bulls make money. Bears make money. Pigs get slaughtered.”

But one old saw from Wall Street that you probably heard recently is “sell in May and go away.” It means that you should sell your stocks in May, and come back to the market in the fall, specifically in November.

According to the folks at the Fiscal Times: “The full quote dates to 1930s London, when stock traders would tell each other to “sell in May and go away, stay away till St. Leger Day.”

St. Leger Day is dedicated to the St. Leger Stakes, the final leg of the British version of the Triple Crown in horse racing that’s held each year in late September.

Basically, English traders wanted to enjoy a long vacation—and ended up altering stock market behavior in the process.

Why? Because stocks have historically underperformed between May through October, compared to returns seen from November through April. Since 1950, the Dow Jones industrial average has returned an average of only 0.3 percent during the May to October period, compared with an average gain of 7.5 percent between November and April, according to the Stock Trader’s Almanac. A less-pronounced “sell in May” effect is present in the Standard & Poor’s 500-stock index as well.”

However, in the past 6 years from 2012 through 2017, following this strategy would have made you miss gains ranging from just 0.27% to 12.99% in the DJIA. And in 2018, while we haven’t yet reached the start of November, the stock market rewarded those who stayed invested with the DJIA returning 10.64% through the end of September. During that same period, the S&P 500 and NASDAQ Composite were up 10.98% and 14.42%, respectively.

It is interesting to note that, in a turn-about from recent history, this past quarter saw the Dow Jones Industrial Average (+9.6%) and S&P 500 (+7.70%) outperform the technology heavy NASDAQ Composite (+7.4%). This was a result of weakness in some of the FAANG stocks (Facebook, Amazon, Apple, Netflix, and Google) that have been propelling the markets, especially the NASDAQ, higher for so long,

Bonds returned 0.08% in the quarter as measured by the S&P U.S. Aggregate Bond Index. This index includes U.S. treasuries, quasi-governments, corporates, taxable municipal bonds, foreign agency, supranational, federal agency, and non-U.S. debentures, covered bonds, and residential mortgage pass-throughs. Commodities returned -2.08% based on the Dow Jones Commodity Index.

As we sifted through the news, two themes kept popping up as the major equity indices set new all-time highs

  1. How long can the longest running bull market in history continue, and;
  2. Which marijuana stocks will create the next generation of millionaires?

We will address these two items first before updating the real issues that concern us.

Welcome to the Longest Bull Market in Wall Street History

That was actually the title of an article posted on MarketWatch on August 22nd, along with the obligatory table of “Bull Markets Since WWII” showing that “Since March 9, 2009, which marked the low of the financial crisis and which many consider the birth date of the current bull market, the S&P 500 SPX…has advanced 320%, the Dow Jones Industrial Average DJIA…has risen 290% and the NASDAQ COMP…has soared 520%.”

But there is a problem with this article: there is no hard and fast definition of what constitutes a bull market or when it begins. As a writer at “The Reformed Broker” points out:

“It’s become likely that we are in a secular bull market for stocks. We do not measure secular bull markets from the bear market low of the prior cycle. The 1982-2000 secular bull market is measured from the day in 1982 when stocks finally took out their 1966 high. It had been a 16 year secular bear market until closing above those highs, and stocks never looked back. We do not date that bull market from the lows of 1973-1974 that were the nadir of the prior bear. Nor should we use 2009 as our starting point for the current bull market. 2009 was merely the cycle low of the prior bear, not the starting point of the current bull.”

So, according to the analysis by The Reformed Broker, the current bull market is actually only three years old, not seven and, if it were to end today, only three other bull markets measured this way would have shorter durations. This viewpoint should be solace for investors who find reason to worry about the age of the current bull market, despite the axiom that bull markets don’t die of old age.

Pot Stocks Continue to Go “Higher”

Just like bitcoin and other cryptocurrencies last fall, “pot stocks” are now skyrocketing as the general public has suddenly become enamored with the possibility of explosive profit potential within this new industry.

On September 19, Tilray (TLRY), a Canadian medical marijuana company, rose more than 50% in a single trading session. At one point, its shares had more than doubled in just a few days. It’s currently valued at roughly 500 times sales, about 300 times book value, and around 800 times its negative earnings before interest, taxes, depreciation, and amortization (“EBITDA”). It has a market cap of roughly $14 billion and sales of less than $21 million. No business anywhere, in our opinion, is worth such valuations.

If you recall, last year there were a dozen companies that reaped rewards by putting “bitcoin” or “blockchain” in their name. Long Island Iced Tea Corp. rocketed 458% after changing their name to Long Blockchain Corp.

The Tilray example is part of the wider bubble in marijuana-related stocks. The number of cannabis news stories recently overtook the number of cryptocurrency news stories, according to data compiled by Bloomberg.

It is apparent that the crypto mania that gripped the investment world last year has now been replaced by a manic demand for marijuana related stocks.

Of course, it goes well beyond crypto and marijuana. From the housing bubble in 2008, to the dot com bubble in 2000, Gold in the 1970’s all the way back to the tulip bubble of the 1700’s, humans have always had a tendency to be gripped by investment manias.

Manias like these don’t end well for most of those involved. Parabolic rallies are typically followed by huge declines of 50%… 80%… or more. That’s exactly what’s happened to bitcoin and other “cryptos” over the past several months. And we expect pot stocks will eventually suffer a similar fate.
The aftermath however, can present buying opportunities for the patient investor who is willing to accept that the fast money has already been made. Amazon, after all, was trading for $40 per share as late as December of 2004, long after the market had started to recover from the “dot-com” bust.

We believe that if we continue to analyze the universe of stocks for those companies with better than average sales, earnings and profit margins, marijuana companies with solid long term potential may eventually make it to our screens. In the meantime, we are happy to watch from the sidelines.

Trade (Wars)

On the trade front, Mexico, Canada, and the U.S. reached a new trade agreement. Most opinion makers seem to think the new accord is better than NAFTA. The market breathed a sigh of relief.

Earlier in July President Trump and Jean-Claude Juncker, the chief of the EU’s executive arm, the European Commission, held a joint press conference in which both leaders promised to work towards zero tariffs on non-auto industrial goods; to reduce barriers and increase trade in services, chemicals, pharmaceuticals, medical products, and soybeans.

They also agreed to reform the WTO and that the European Union will buy more liquefied natural gas from the United States. Perhaps most importantly, they agreed to refrain from imposing new tariffs on one another while they work together on these issues.

While this agreement sounds promising, it should be noted that nothing specific was established or signed and as Goldman Sachs put it:

“The lack of specifics in today’s U.S.-EU announcement raises the possibility that the negotiations could falter at a later stage, as U.S.-China negotiations did earlier this year.”

Hopefully, with an agreement with Mexico and Canada completed (although not approved yet by the congress), momentum will build toward reaching an agreement with the EU which would then put pressure on China to possibly rethink their current strategy.

Each agreement which takes away the implementation or threat of tariffs will be positive for the market and, hopefully, beneficial for US companies most impacted by these agreements.

Currency

Interestingly, the dollar has appreciated sharply this year despite the various “trade wars” referenced above. Coincidentally with the US imposing tariffs on Chinese solar panels and washing machines on January 22nd, the dollar began a sharp run higher.

A rising dollar makes imports cheaper which could, at least for those imports priced in foreign currencies, offset to some degree the inflationary impact of tariffs.

North Korea

Talks with North Korea continue as both sides jockey for a win-win outcome that makes neither side look like they surrendered. This is a situation that has been festering since the 1950’s so a quick solution, like the Mexico and Canadian Trade agreement, would seem highly unlikely. However, it is promising that both the North and South have continued to work towards a de-escalation of border tensions and we haven’t seen a North Korean missile test since November of 2017.

Federal Reserve Policy

In our Q2 letter, regarding the Federal Reserve Bank’s policies on interest rates, we wrote: “We see these Fed moves as the #1 driver of the overall volatility in the market for several reasons:….”

Our opinion has not changed, interest rates not only impact consumer spending decisions about homes, autos and luxury items, but they also impact business investment as well. Businesses typically finance their large capital expenditures with debt so an increase in interest rates will either increase the cost of the expenditure or curtail spending altogether. Either way, neither is good for the continued private sector economic growth that we need for both higher wage growth and a larger workforce.

Since August 20, the yield on the 10 Year Treasury has leapt from 2.83 to 3.22 on October 1st. This is not an insignificant move and signals a dramatic increase in borrowing costs which eventually make their way into the economy. For those of you wondering, the ten-year yield was 3.43 on January 1, 2008.

We have written before that the Fed feels that they need higher interest rates in order for the Fed to “reload” in advance of the next economic downturn. It is our opinion that they should have started this back in 2010 at a much more gradual pace to reach a “neutral stance”. In the Fed’s terms, those are rates that are neither accommodative nor restrictive to economic growth.

We readily admit that we have no idea as to when rates reach a level of neutrality, which is why we will never be nominated to serve at the Fed. We only observe that historically it appears the Fed didn’t know what level neutral was either and only found out when it went too far and sent the economy into a contraction. Motivations driving the Fed aside, the speed and magnitude of further rate increases demand ongoing attention.

One last comment on interest rates is in order. A lot has been made in the press recently of the yield spread between 10 and 2-year maturity Treasury bonds. Over the last 30-40 years, when this spread went negative, meaning that short term (2 year) yields were higher than mid-term yields (10 year), a recession followed in fairly, short order. While this spread is still positive, it is quite close to going negative. If, as it has in the past, this foreshadows an imminent recession, then it’s time to be extra cautious on the stock market as well.

Trade negotiations, geo-politics (short of nuclear war) and even election cycles will continue to create volatility shocks in the market. However, we believe that the biggest threat to the market remains the Fed’s monetary policy. In a recent article posted on MarketWatch, researchers calculated that stocks have suffered around $1.5 trillion in losses following speeches from the Fed’s Chairman Jerome Powell.

Powell has hosted three news conferences this year following meetings of the rate-setting Federal Open Market Committee. which were followed by an average decline of 0.44 percentage points in the S&P 500. Other talks and speeches have resulted in an average fall of 0.40 percentage points, with losses coming in five of the past nine prominent speeches or Congressional testimonies Powell has delivered.

The stock market knows that, over the long term, it is the economy that drives growth in sales and earnings and that sales and earnings growth ultimately drive long term performance in equities.

We believe it is our role to continue to identify those companies who can thrive in different economic conditions and buy them when they are trading t a favorable price. Watching business fundamentals instead of charts, newsletters, or headlines, we expect to be rewarded over the long term with less volatility and better sustainability.

Read More

Second Quarter 2018 Market Review

Q2 2018 – Tightening and Tariff Tantrums

The major indices performed much better in the second quarter than the first as very positive earnings reports produced gains of 3.44% for the S&P 500. Bonds, as measured by the S&P US Aggregate Bond Index were down only 0.12% for the quarter and commodities as measured by the Dow Jones Commodity Index were up 1.06%. Finally, Bitcoin recovered a little bit in April and May before continuing its 2018 swoon (we haven’t gotten a call from anyone wanting to invest in Bitcoin or other Crypto currencies in several months).

While market volatility as measured by the VIX was nothing compared to the first quarter, the second quarter gains were not at all smooth and the number of one-day moves, up or down, of 1% or more was 26 out of 64 trading days in the quarter.

In our Q1 Letter we noted that, “There are four major factors driving the market. The factors are growth, trade wars, geopolitics and regulation of technology. “, and that opinion has not changed although trade wars and growth (and interest rates in particular), are having the greatest short-term impact on the markets.

In March, all eyes were on the Federal Reserve Bank and their monetary policy in the face of strengthening economic data. After a two-day meeting, the Federal Open Market Committee unanimously voted to increase its benchmark fed funds rate by 25 basis points, to a range of 1.50% to 1.75%. The Fed signaled two more rate hikes in 2018 amid speculation that it was considering adding a third increase. It did, however, raise its forecasts for hikes in 2019 and 2020, citing a stronger outlook on the economy. And then, in June, they voted to lift the target range for the federal funds rate by another 25 basis points to between 1.75% and 2% and signaled plans to do so two more times this year. That would be more than originally projected for this year, based on the risk of faster projected economic growth and low unemployment driving inflation beyond their 2% target.

We see these Fed moves as the #1 driver of the overall volatility in the market for several reasons:
The strategy of using interest rates to fight inflation is called “Contractionary Monetary Policy” and usually results in the Fed over-tightening by squeezing the buying power of households without a corresponding increase in wages. This, of course, can negatively impact revenue growth for businesses which can lead to negative earnings growth which, in turn, is a negative influence on stock prices.

As interest rates rise, savers have the opportunity to earn more interest on their debt instruments. Typically, higher rates draw money out of stocks and into interest bearing investments, adding another negative influence for stocks.

Higher rates also increase borrowing costs for businesses which may curtail business investment. Business investment is a driver of economic growth. Slowing economic growth would be, yet again, negative for stocks.
In their June statement, the Fed said that “In determining the timing and size of future adjustments to the target range for the federal funds rate, the Committee will assess realized and expected economic conditions relative to its maximum employment objective and its symmetric 2 percent inflation objective. This assessment will consider a wide range of information, including measures of labor market conditions, indicators of inflation pressures and inflation expectations, and readings on financial and international developments.”

We tend to live in the camp that economics is more art than science and believe we are all at risk when a governing body (Fed members are called “governors” after all) treats economics more like a science, believing that it can move levers and adjust the economy with scientific precision. Since the June 13 meeting, the S&P 500 has dropped approximately 2.5%. We don’t believe that this is coincidental and will continue to monitor Federal Reserve policies.

Regarding trade, the rhetoric is heating up as additional tariffs have been announced by the administration beyond those announced on Chinese imports. These new tariffs include a 25% tariff on imports of steel, and a 10% tariff on aluminum, from the European Union, Canada, and Mexico.

The tariffs angered U.S. allies, and have resulted in retaliatory measures taken by these countries as well as India. As these various measures and counter measures have been announced, we have seen brief market sell-offs in those sectors most likely to be affected. These sell-offs have been called “Tariff Tantrums” by some market pundits because of the panicked reactions to what could happen as opposed to reasoned action based on the fundamental data of what is actually happening. A recent article in USA Today went so far as to say that the tariffs in total will add over $5,000 to the price of every car sold in America! Interestingly, however, the article contained no analysis of actual cost data to support this claim.

We still do not think a full-scale trade war is in the cards as the risk of real economic slowdown is too high for all players involved. On July 2nd, Bloomberg ran an article showing how China is zooming to a record year of corporate-bond defaults in 2018. The article states, “Corporate profits have worsened this year and are unlikely to improve against the backdrop of an economic slowdown…” Therefore, it is not in China’s best interest to prolong any uncertainty regarding trade agreements with the US. Meanwhile the EU’s growth continues to disappoint. In 2017, the 19-country zone showed a decade-high rate of growth of 2.5%. By first quarter 2018, though, their growth had slowed to just 0.4 percent and Q2 results are not expected to pick up enough to sustain the 2017 performance.

We believe that the economic risks of a prolonged trade war are far too great for politicians to gamble with. How this gets resolved is still anybody’s guess. In June it was reported that President Trump proposed to the United States’ closest allies the idea of completely eliminating tariffs on goods and services. Apparently he did not get a very encouraging response. It may be that we start establishing separate trade deals with individual countries that contain better (but surely far from perfect) terms for the United States.

Concerning geopolitics in general and North Korea in particular, President Trump did meet with North Korean leader Kim Jong Un and the pair signed a document stating that Pyongyang would work toward (emphasis ours) “complete denuclearization of the Korean Peninsula.” While this is a far cry from final and ever-lasting peace, it is nonetheless a significant step forward. It must be noted that missile test launches and underground bomb tests in North Korea have ceased for the time being and there is certainly less concern around the possibility of an imminent nuclear world war than there was a year ago at this time.

Finally, we continue to watch the potential collision course between the FAANG companies (Facebook, Amazon, Apple, Netflix and Google, or it’s parent, Alphabet) and Washington D.C. While we are concerned that any legislation will create an increase in volatility of the major indices which are market cap weighted (the FAANG stocks make up 27% of the 2,595-security Nasdaq Composite), our bigger fear is the longer-term ramifications of legislation on growth and innovation.

For example, the Supreme Court’s decision on South Dakota versus Wayfair (now known as the “Wayfair Decision”) over South Dakota’s application of its sales tax to internet retailers who sell into South Dakota but have no property or employees in the state could have a chilling effect on the further development of e-commerce. Regardless of any opinion about whether this decision is right or wrong, we note that sales taxes, which exist in 41 states, apply to most purchases of retail goods within the state. The seller has the responsibility to collect the tax and forward the money to the state. E-commerce businesses will now have to collect the same sales tax collected by all other retailers. As e-commerce’s strengths over brick-and-mortar are more about convenience, wider selection, and lower costs, it’s unlikely this decision will hurt the larger e-commerce firms. As sales tax collection on e-commerce grew from almost zero to half of all sales, e-commerce has continued to grow sharply.

Our concern, however, is the ability of small e-commerce sellers to collect and pay sales taxes in a simple way. So, while the Amazons of the world will be able to absorb the costs of complying with sales tax initiatives, smaller retailers, as Amazon once was, may ultimately get squeezed out of the e-commerce channel. While this is just one example, one can see how government regulation can serve as a moat for the large, established tech companies to protect their market share from competition, whether it be in e-commerce, social networking, or healthcare.

During his March 2018 testimony before Congress, Facebook founder Mark Zuckerberg made clear that he was open to the government regulating Facebook in some way. “The question isn’t, ‘Should there be regulation, or shouldn’t there be?’ It’s ‘How do you do it?’” Zuckerberg told Wired.com. Zuckerberg knows that any legislation would not only impact Facebook but would also impact any small firm trying to compete with them and when it comes to business and regulation, the firms that can afford the best lawyers, accountants and technology will have a clear advantage over anyone else.

In conclusion, we continue to be cautiously optimistic, especially regarding US equities. A modestly bullish path forward is most likely. Net profit margins, fueled by the reduction in the corporate tax rate due to the recently passed tax reform, were at ten-year highs in 2017 according to FactSet. It is important to note, though, that net profit margins were improving on a sequential basis during all of 2017, prior to the tax bill becoming law. In any event, it appears the lower tax rate is more than offsetting any impact of higher wages and other cost increases, and many analysts expect even higher net profit margins for the S&P 500 for the remainder of 2018.

We believe that the best approach is to assess incoming data and update our opinions accordingly, stick with higher quality investments in correspondingly suitable allocations based on each investor’s financial and emotional tolerance for risk, and stay nimble.

Read More

First Quarter 2018 Market Review

Q1 2018 – The Roller Coaster is on the Track

At the time of our last quarterly update, we had just finished a great year for the stock market.

Accordingly, we wrote “…we do not expect 2018 gains to match those of 2017.” So far, we have been more correct than we really wanted to be with the S&P 500 showing a modest decline year-to-date despite the exceptionally strong start in January.

The “modest decline” doesn’t adequately describe the very sharp moves, both up and down, by the S&P 500 and the Nasdaq Composite in the first three months of 2018.

Those sharp moves translate into an increase in market volatility starting in early February, as measured by the VIX, after spending a year below 12; a reading that is historically very low for the markets.

Some people who read stock market charts are describing the move in January as a classic “Blow-off Top” which, according to Investopedia is “A chart pattern that indicates a steep and rapid increase in a security’s price and trading volume followed by a steep and rapid drop in price and volume. While we see a steep and steady rise in price followed by a steep and rapid drop in price, when we add volume to the chart, we do not see the type of volume behavior that the definition is calling for.

According to wealth management company Gluskin Sheff’s Chief Economist, David Rosenberg, the S&P 500 Index is on pace for an incredible 100 sessions with a daily move of 1% or more. It’s still early, and there’s no guarantee this pace will continue. But it would place 2018 in rare company. In fact, this has only occurred in five previous years over the past 70.
Two of those years – 2001 and 2008 – occurred in the middle of a serious bear market decline. The other three – 1974, 2002, and 2009 – marked significant multiyear bottoms. But all five were incredibly volatile periods for investors.

What’s Going On?

There are four major factors driving the market. The factors are growth, trade wars, geopolitics and regulation of technology.

Each of the four factors has several potential outcomes, some being positive for the markets and others being negative. With each tweet, speech, data point and action that takes place, traders and investors recalibrate their outlook and adjust their positions accordingly only to have a contradictory tweet, speech, data point, etc., follow which forces them to recalibrate their viewpoint once again. No wonder the market seems confused.

US Economic Growth

With regard to growth, the bulls expect a boost from the Trump tax cuts. They are also anticipating inflation due to strong job creation, rising labor force participation and a low unemployment rate. They expect interest rates to rise but consider this more a sign of economic strength than a cause for concern. Strong growth is good for corporate earnings, and a little inflation is usually good for nominal stock prices, at least in the early stages.

Bears point to an economic slowdown in the first quarter (most projections are around 2% or less and by the time you read this the actual results should be known). This is consistent with the dismal average of 2.1% growth since the end of the last recession in June 2009. Stronger growth is impeded by demographic and debt head winds and the impact of Chinese labor and technology on global pricing power.

Tax cuts are not expected to help, because the drag on growth caused by increased debt will outweigh any stimulus from lower taxes.

The market is also concerned that the Fed is giving a weak economy a double dose of tightening in the form of rate hikes and the unwinding of several years of quantitative easing (loose monetary policy). We don’t think the Fed will push the economy to the brink of recession before they get the message and pause on rate hikes, probably after the November elections.

Trade Wars

To many, the possibility of trade wars are another conundrum. There is little doubt that a true trade war would reduce global growth. But many are wondering if we’re facing a trade war or just a series of head fakes by Donald Trump as he pursues the art of the deal?

For example, Trump imposed tariffs on steel and aluminum imports and then almost immediately carved out exemptions for Canada and Mexico pending progress on renegotiating NAFTA. Then the President trumpeted a trade deal with South Korea that imposed quotas on steel imports but almost immediately said that deal was conditional upon South Korean help in dealing with North Korea.

Trump has also threatened over $50 billion of penalties on China for theft of U.S. intellectual property, but within days China and the U.S. calmed market fears by announcing plans for bilateral trade negotiations.

So, is it really a trade war, or just a set of negotiating tactics?

We don’t believe a trade war is the real end game for the President. Trump is a New York businessman and he approaches the office of President like a New York businessman versus a politician. If his real goal is to create a more level playing field and address the burgeoning trade deficit we have with China, then a trade war would be a step backwards. We also question China’s strength in direct negotiation with the United States, While the news media would have us believe that China holds all the cards, the scenario changes when you actually look at the hand they have been dealt.

While it is true that China is the world’s fastest growing major economy, much of its growth has been from investment in an export-based model and now that strategy, wrought with examples of poor investment that we have mentioned before, may prove detrimental to their global ambitions.

China’s total debt has been building up in the economy during the last several years to support growth. China’s debt surpassed 300% of GDP in 2017. The People’s Bank of China has enabled the buildup of debt with “huge lending” to commercial banks. Debt-fueled consumer demand accounted for 71% of China’s economic growth in the first three quarters of 2016. China’s economic growth is being held up through extremely high credit generation. That is probably not sustainable for long without substantial damage to the economy and financial system.

Overcapacity in industrial enterprises is the biggest problem that China is facing today. China now has far more capacity than it – or for that matter, the world – needs. In some cases, overcapacity exists to the level of 30% of domestic need. The overcapacity problem has been exacerbated in recent times by the clear slowdown of China’s economy. Particularly, the slowdown in infrastructure projects and in the real estate sectors. Overcapacity in the manufacturing sector could take far longer to be sorted out, especially given the state of the global economy.

To tackle such conditions and avoid an impending crisis, China faces a very serious need to boost exports, as its domestic demand cannot absorb the goods that would be produced at the higher capacity utilization levels needed to sustain the economy. In such a scenario, any fall in Chinese exports due to a trade war has the potential to cause a huge setback to China’s plans and strategies.

Will the threat of a trade war work to level the playing field? Chinese President Xi Jinping has just promised foreign companies greater access to China’s financial and manufacturing sectors and pledged Beijing’s commitment to further economic liberalization despite (or because of) rising trade tensions with the U.S.

The news that China intends to try to do better is welcomed, but it’s nothing we haven’t heard before. There was no clear schedule for implementation of the proposals. Barring concrete progress on a trade deal, we suspect it’s simply a matter of time before tensions rise again.
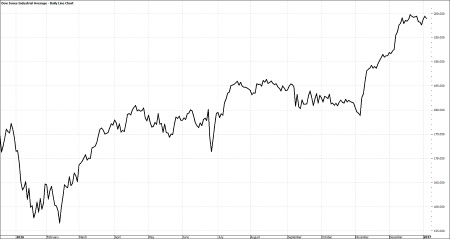
Trump has left enough wiggle room to indicate he could back off the trade wars if he can attain enough concessions from China and the NAFTA countries. Our expectation is that trade talks and skirmishes are likely for some time to come. China will probably stall concrete action until the outcome of the November election to see if voter support for Trump increases or decreases. The advent of a Democrat majority in one or both Houses of Congress could change the political calculus.
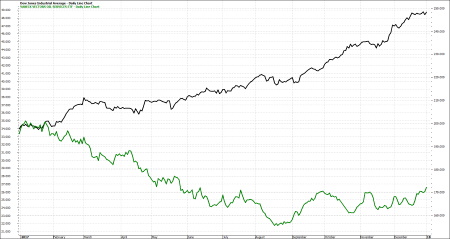
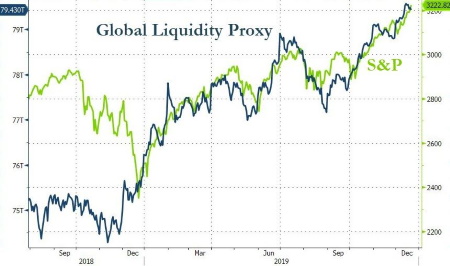
Real Wars

Geopolitics is another on-again, off-again market driver particularly concerning war with North Korea.

If anyone had suggested, even three months ago, that North Korea would end up participating in the Winter Olympics and subsequently request a meeting with the U.S. to discuss nuclear disarmament, the suggestion would have been rejected outright as naïve. And yet, a rapid round of diplomacy involving summits including North and South Korea, China, and Japan, are all leading to a summit between Donald Trump and Kim Jong Un. Quite possibly these developments may point to a possible peaceful resolution of the impasse.

If you believe Kim Jong Un is dealing in good faith, you’ll be encouraged by these developments. If you believe Kim Jong Un is dealing in bad faith and just playing for time as he perfects his weapons technology, then you’ll expect that war is just a matter of time.

Take your pick.

Technology Wars

The final factor that is confounding markets is the potential for regulation of technology. Investors do not need to be reminded of the outsized impact of the FAANG stocks (Facebook, Apple, Amazon, Netflix and Google) on markets overall and the Nasdaq-100 in particular.

Suddenly, Facebook is facing scrutiny because of misuse of personal customer data and for acting as an accessory to alleged Russian meddling in U.S. elections. Amazon is under the gun on possible antitrust grounds, alleged government subsidies for shipping and Trump’s visceral dislike for the “fake news” Washington Post owned by Amazon founder Jeff Bezos.

There has already been a congressional hearing on one of these matters with a high likelihood of more to come. It’s possible that hearings could lead to legislation. Will Silicon Valley lobbyists dilute the legislation? Will antitrust allegations go up in smoke? Or will populist outrage with the tech giants lead to a sea change and aggressive enforcement as we saw with the Rockefeller trusts in the early 1990s?

The correct answer is that no one knows. This will be a battle between corporate lobbyists and populist outrage. Usually the lobbyists win, but this time may be different.

None of these four issues will be resolved quickly. It may take six months of data before the Fed realizes the economy is weak despite tax cuts or before growth bears throw in the towel.

Trade wars usually play out over years, not months. If Kim Jong Un wants peace, we should know fairly soon. If not, the countdown clock to war, currently on pause, will resume ticking.

The hearings and legislative process involving technology regulation could easily take a year or more to play out. Members of Congress like to milk these issues for campaign contributions from both sides before resolving them, so quick results here are unlikely.

Summing Up

The problem for investors is they have to wake up every day and commit capital whether they know the outcome of these issues or not.

If growth is strong, trade wars fizzle, North Korea wants peace and the tech lobbyists prevail, then Dow 30,000 is a possibility.

If growth is weak, trade wars escalate, North Korea is dealing in bad faith and popular outrage hamstrings the tech giants, then Dow 20,000 is the more likely market destination.

Of course, other combinations of these factors are more probable than a uniformly positive or negative scenario. Mixed results, though in unknown combination, are entirely possible.

Our estimate is that a slightly more optimistic, modestly bullish path is most likely. Money is still going to flow where it is best treated. We do not believe the economy is so strong that interest rates will rise enough to trigger an immediate mass inflow of investment into bonds. But it’s unwise to put a stake in the ground on any particular outcome. The best approach is to assess incoming data and update our opinions accordingly, stick with higher quality investments in correspondingly suitable allocations based on each investor’s financial and emotional tolerance for risk, and stay nimble.

It is highly unlikely that market volatility will go away any time soon because the issues now driving that volatility, if history is a guide, will not be resolved soon.

An update on Cryptocurrencies

For those who were worried last quarter that they were going to miss out on the next great wealth making investment, we have good news. Bitcoin, still the leader of the cryptocurrency revolution has dropped dramatically from its most recent run up.

This is not the first time this has happened, nor do we believe it will be the last. The cryptocurrency market is still in its infancy and has been compared to the Wild West. We do believe that in the long term, the promise of the underlying technology behind these currencies, Blockchain, could prove to be beneficial to a number of industries, but many of the companies involved in Blockchain are being valued on hopes and dreams instead of fundamentals.

In such an environment, picking winners from losers is still more closely related to picking numbers on a roulette wheel than it is to common sense investment principles.

We continue to monitor the markets for real opportunities based on the value-based approach that has served us well all these years and if the right company comes along, we will not hesitate to add it to our universe of stocks.

Until that time, we still regard investments in these currencies or blockchain start-ups as strictly speculative and not suitable for any core portfolio strategy.

Read More

Fourth Quarter 2017 Market Review

Look Both Ways as You Cross the Street?

Stocks rose for a fourth straight quarter with a gain of 6.34%. Bonds, including treasuries, were up 0.39% even with the Federal Reserve hiking interest rates a quarter of a point in December. Commodities (as measured by the Bloomberg Commodity Index) again had a strong fourth quarter led by energy and metals. And Bitcoin…….well, despite its unprecedented increase in value, we still consider Bitcoin to be a medium of exchange and better suited as a store of wealth versus a growth or income-producing investment.

2018 Outlook:

As you recall, one of the key variables we identified as impacting the market was meaningful tax reform and, while far from perfect in our view, it is hard to argue that the reforms are not meaningful.

For those of us old enough to remember, the tax reforms of the 1980’s impacted the economy positively through deep cuts to personal tax rates. This bill delivers only modest personal relief for most of us who pay taxes, but it does create a much more favorable business climate than we’ve seen in many years through significant corporate tax reduction.

While we may see only modest gains in our personal tax bills, we will all certainly benefit from any gains in real economic growth that may be spurred on by these tax changes. If demand exceeds capacity, as it often does when economic growth is robust, that will fuel the need for capital investment in new and expanded factories and facilities across the nation. That expansion could push up the demand for labor and increase hiring and wages.

Economic growth should translate into increased revenue which, if companies hold their costs in line, would result in enhanced rates of earnings growth. Faster growth would have a positive impact on one of the fundamental components of stock pricing.

Interest rates will still be favorable for borrowers and near historic lows even if the Federal Reserve proceeds with its three projected interest rate hikes in 2018.

Couple all that with an already improved business regulatory climate and you have a constructive environment for continued market gains in 2018.

But while these catalysts typically signal that stocks have more room to run, there are still risks worth watching and we do not expect 2018 gains to match those of 2017.

The first question pertains to the effect of the tax cuts on the market from this point. We have heard opinions from “experts” that the reforms have been fully priced into the market or not priced in at all. We believe the truth is somewhere in between those two extremes, but there is a strong possibility that prices have gotten at least a little ahead of fundamentals. So, it would not be surprising if the market pauses until earnings announcements enable investors to better calibrate how “cheap” or “expensive” stocks really are.

Another common assumption is that major companies will repatriate the billions of dollars currently held overseas and use that capital for domestic investment, acquisitions, and share buy backs. While we do believe that this will occur to some degree, we also think that at least some of the repatriated cash will be applied to debt reduction.

Reducing debt would strengthen balance sheets which is good in the long run but it doesn’t necessarily drive increases in stock prices in the short run. Since these companies will determine what is in their own best interest, it is impossible to draw any macro conclusions about the impact of repatriation. We would prefer to err on the side of caution.

The risk of some sort of military conflict with North Korea still exists. The missile tests continue, bomb tests continue, military drills continue, and rhetorical spats continue. We do not see a peaceful path to eliminating the nuclear threat presented by this regime. Any resolution that results in a nuclear exchange occurring anywhere in the world will certainly rock the markets for some period; how significantly and for how long is open to debate.

International Economies – China

China’s growth rate has taken a hit this year which makes sense since you can only build so many empty cities. Unfortunately, GDP calculations in China have long been suspect making it difficult to determine the soundness of the Chinese economy. For instance, if the government spends money to have a hole dug, then spends more money to have that whole filled, economic measurements will show GDP growth even though there was no need to have the hole dug in the first place. Add to this slowing growth extreme debt levels, capital flight, corruption, and pollution, and you have a large economic house of cards that may become impossible to stabilize. The Chinese economy is now so large that even a moderate slowdown will negatively impact economic growth in much of the world with a likely knock-on effect for stock prices.

The Fed

With all major economies expanding, there is a possibility that central banks begin raising rates overly aggressively; particularly our own Fed as well as the European Central Bank.

We know that the Fed has already started to unwind their balance sheet and is now gradually ratcheting down the quantitative easing by $20 billion per month in January and further to $50 billion by October. As the Fed’s appetite wanes, the Treasury will need to issue more debt into the market, putting upward pressure on rates. We also know that the Fed wants to raise interest rates at the short end of the maturity spectrum sooner rather than later in preparation for the economic downturn that will inevitably occur at some unknown point in the future.

Meanwhile, the ECB announced in October that it would cut its quantitative easing to €30 billion a month in January 2018. That’s a 50% cut from the prior level of stimulus. At least some portion of that has found its way to the stock market over the last decade.

Couple these actions with the Fed’s projected interest rate hikes and it’s clear there is a risk that the Fed might “hit the brakes” too hard and too fast and adversely impact economic growth. If there’s anything that we have learned over the years, it’s that monetary policy is just as much art as it is science.

Yet another reason to believe that 2018 will not be like 2017 is that 2018 is an election year. As we have seen in the past, elections can bring market volatility. If the special elections last year are any kind of an indicator, we expect the 2018 political scene to be as contentious and over the top as anything we have seen in our lifetimes. The markets don’t like uncertainty, so we could very well see a bumpy ride starting sometime during the run-up to the elections.

When we look at all these factors we do not believe that we should be taking a defensive posture with our investments, but at the same time it would be a mistake to be complacent. Timing the markets is a dangerous game; in this environment, it makes more sense for investors to focus on making sure they are well-positioned to pursue personal goals. Our risk-based allocations are constructed using the historic performance of the component strategies in varying market conditions as a guide and, in our opinion, represent a rational approach to dealing with market uncertainty.

Read More

Second Quarter 2017 Market Review

With the current stock market uptrend now the second longest bull market on record, and the economic expansion the third longest since the end of WWII, there’s been a lot of talk and, in some cases warnings, that both of these trends are in danger of coming to an end. Our short answers to these two questions are no and no.

First the economy. While we admit that very recent economic releases have come in somewhat below expectations, there are a number of solid reasons to believe that economic growth will continue to move forward. First and foremost, the Federal Reserve, while gradually bringing short term rates up to more normal levels, continues monetary policies that are far from being restrictive and has no desire to slow or stop economic growth since inflation is well below the target of 2%. The Fed, of course, also understands that the continuation of economic growth is important to lowering government deficits.

And because U.S. Corporations today derive about 50% of their profits from overseas, we are also benefiting from the recent upturn in Europe and Japan, as well as from the policies of their Central Banks which are on the same growth objective as our Federal Reserve. This synchronization of global markets presents a strong case that economic growth will continue to grow in the U.S. despite having already achieved one of the longest expansions over the past 70 years. In our opinion, there is a near zero percent chance a recession will present itself in the next 12 – 18 months.

That’s very good news for the stock market which tends to react to, with leads and lags, to the ups and downs of the economy. Other factors, such as a major geopolitical crisis or a financial crisis, can also cause a bear market. At the current time, however, we do not recognize there to be any critical financial issues or serious geopolitical risks.

While it’s unfortunate that North Korea apparently has nuclear weapon capability, they suffer from shortages of motor fuel, food, equipment and sanitation and health care for troops in the field. The Kim family regime recognizes they would lose control of the country should they start a war they have no chance of winning against the U.S. and its allies.

We have been positive on the outlook for U.S. stocks over most of the past eight years. One day we will turn bearish, but that won’t happen until we believe a recession is on the horizon. Right now we see more positive factors than negative ones. U.S. business and consumer confidence and corporate earnings are at record levels.

The number of available jobs is near record levels and more people are returning to the workforce. Consumer and business sentiment are near record highs while low inflation and interest rates justify (support) current stock prices, in our opinion.

Other issues that could temporarily derail the current uptrend of the market are unfortunate events like the recent Virginia disturbance and past Government shut-downs due to politicians bickering over the nation’s debt ceiling. These and similar issues tend to cause only short term disruptions for the market.

Read More

First Quarter 2017 Market Review

Equity investors began their celebration immediately after the November elections. On the other hand, fixed income investors made an initial exit from the bond market only to cautiously creep back in after November’s shock. The markets were reacting to President Trump’s determination to “make America great again”, partly by reviving an economy that never was able to fully recover its momentum after the Great Recession of 2008-2009.

While a bit off of its closing high on March 1st of 2395.96, the S&P 500 has risen 13.3% from a closing low of 2085.18 on November 4th to end the first quarter at 2362.72. The Barclays Aggregate Bond Index dropped approximately 3.5% from its pre-election level to its bottom in mid-December. It has since recovered 2.2%.

Interestingly, the stock market has begun to falter ever so slightly as the Republicans’ failure to repeal and replace Obamacare has caused second thoughts about their ability to reshape the economy, especially through broad based changes in tax policy. The reasoning seems to be: “If they can’t agree on something that touches 14% of the US economy, how will they be successful on taxes which touch every aspect?” Only time will reveal their ultimate level of success.

As has been the case over the last months, the economic outlook is not without a mix of positive and negatives. Consumer confidence is at its highest level since 2000, and small business confidence remains high and at levels not seen since before the financial crisis.

The Federal Reserve is confident enough to have raised rates in March and is talking about ongoing rate hikes over the course of the year. Nonetheless, there are some signs of possible trouble ahead. Retail sales remain weak, with the latest report showing just a 0.1% rise. Prices of used cars are in steep decline and manufacturers are offering large incentives to move new cars off the lots.

Meanwhile, pending sales of existing homes reversed course to rise sharply (+5.5%) but were outdone by new home sales (+6.1%) and new home construction (+6.5%). Conversely, multifamily starts fell 3.7%. Demand for oil looks to be somewhat weak as evidenced by recent oil price drops. Ominously, we have also seen the biggest jump in unemployment claims in six months, yet today a very strong jobs report showed companies added 263,000 to their payrolls in March, far surpassing the 185,000 expected. Our conclusion is that while economic reports are a bit muddled, we don’t see much risk of an imminent recession.

Despite looming interest rate increases, long term bond prices rose in the first quarter and short term bonds fell. The fixed income holdings in your portfolio were up a respectable 0.41% with the government holdings detracting from a stronger showing by the portfolio’s corporate bonds.

The stock market did finish a consolidation phase in late January and continued its upward move to reach new highs. Valuations remain stretched, but the market has already had a minor correction in the wake of the healthcare reform debacle and that may be all we get for a while. In all likelihood, as long as a generally positive view on government reforms and modest rate hikes stays in place and corporate earnings don’t disappoint, we would expect the stock market trend to remain upward.

Read More

Fourth Quarter 2016 Market Review

Investors spent much of the last few years concerned that the economy might slip back into a recession given the slow growth environment we were experiencing. This perception changed abruptly during the fourth quarter as indicated by the surveys for consumer confidence, investor confidence and small business expectations which all turned strongly positive. Since better economic growth usually results in higher inflation and interest rates, financial service stocks dominated with a 21.1% gain during the fourth quarter while the energy sector (inflation beneficiaries) was the second best with a 7.28% increase. Dividend stocks, on the other hand, were held back by an increase in inflation expectations and increased only 0.49% for the quarter.

Value stocks significantly outperformed growth stocks during both the fourth quarter and for the year, while small stocks also easily beat large cap stocks during both periods. Value stocks benefit the most from better economic conditions and the new administration’s plan to lower corporate tax rates would benefit small companies more as they tend to have higher effective tax rates. The S&P 500 increased 3.82% for the quarter and 11.96% for the year. And finally, with interest rates moving higher, 5-year municipal bonds declined 2.76%, while Intermediate Gov’t/Corporate bonds dropped 2.1% for the quarter.

We believe the sudden and sharp improvement in business and investor expectations has played an important role in the stock market’s success of late. As such, it may be that prices (stocks) have advanced too far ahead of the improvements investors are looking for. Under these circumstances, stock prices typically tend to consolidate or even correct lower as investors wait for the improved expectations to become a reality. This looks to be what has been happening during the month of January thus far. From our perspective, we see economic conditions and corporate profits already improving and this higher level of growth will continue throughout the coming year. As a result, it should be a favorable environment for the stock market.

Read More

Third Quarter 2016 Market Review

The stock market shifted gears during the third quarter as investor concerns over the economy faded. As a result, growth oriented equities (like Technology stocks) moved from the worst performing (-2.84%) economic sector during the second quarter, to the best (+12.9%) during the third period. And because higher inflation and interest rates are highly correlated with faster economic growth, interest rate sensitive stocks such as utilities and telecom issues both declined almost 6% during the quarter. Third quarter corporate earnings came in above estimates and interest rates started an uptrend which accelerated over the next several weeks. The S&P 500 stock index increased 3.85% while the bond market, based on Barclays Intermediate Government Corporate Index, increased 1.21%.

Despite the near complete absence of fiscal stimulus, the economy showed good improvement during the third quarter and given the recent strength of the stock market, investors appear to be betting that the improved trend will continue. Corporate profit growth improved in the third quarter and forward earnings estimates rose to a record high during the first week in October. The CRB raw industrial spot price index has recovered smartly of late. That’s good news since there’s a very strong correlation between the level of inflation and earnings growth. Jobless claims are at their lowest readings since 1973 and wages are beginning to improve which should support higher levels of consumer spending going forward. Finally, history shows that the absence of political gridlock in America has been good for economic growth and stock prices no matter if it be Democrats or Republicans in control.

As always, we value your business and our relationship with you. Please don’t hesitate to call if you have any questions or comments, or if there’s any way in which we can be of service.

Read More

Second Quarter 2016 Market Review

In all our years of working in and studying the stock market, we cannot recall when so many investors got it wrong. “Power to the People!” was a widely heard slogan in the U.S. during the 1960s. The U.K. citizens seemed to reflect that sentiment in late June when they voted to exit the European Union. Shortly after the vote it was found that many of the voters didn’t understand what they were voting for and that the advocates supporting the exit didn’t have even a rough outline of a plan as to how to accomplish an exit. Talk about creating a negative investment environment. The stock market, after moving in a modest uptrend for most of the second quarter, moved sharply lower in response to the results of the U.K. vote which was almost completely unexpected.

Fortunately, the U.K. accounts for only 3.9% of U.S. exports and the economic numbers for the U.S. were above expectations in the weeks following the market decline. In the end, the S&P 500 increased 2.46% for the second quarter and 3.84% during the first half of the year. For the second quarter, last year’s beaten down Energy sector posted the strongest gains at +11.62% while the Information Technology sector came in last place with a decline of 2.84% for the quarter and near the bottom with a decline of 0.32% for the first half. In the fixed income arena, interest rates in general declined to record or near record lows influenced by concerns over global economic conditions, especially in Japan, and in parts of Europe where a number of government rates are below zero. The U.S. 10-year Government Bond rate recently hit a record closing low of 1.395% while the Intermediate Government/Corporate Bond Index increased 1.59% for the quarter and 4.07% for the six months.
While the economies of most free world countries are not running on all eight cylinders, we are encouraged by the progress we see in the U.S. at the present time. Consumer spending has picked up, jobs are being created at a reasonable rate, wages appear to be firming, the Energy sector looks to be stabilizing, and monetary policy (i.e. low interest rates) continues to have a positive influence.

Importantly, all these factors are contributing to a better earnings picture. Compared to a somewhat dismal earnings trend of 12 months prior, analysts have been raising their earnings estimates for the
past 11 of 12 weeks. While valuations are not overly compelling, they are lower than they were at the beginning of the year, clearly lower than the peaks recorded in 2015 and they should be supported by the positive direction of the economic and corporate profit trends that we expect. Barring some obvious unforeseen political or terrorist event, the investment environment should be favorable for most of the time over the next 6 months.

Read More

First Quarter 2016 Market Review

To say that the past three months have been a volatile period for the market is not an exaggeration. With terrorism in the background, oil prices plummeting, negative interest rates in Europe and Japan, and economic growth in question throughout most parts of the world, January got off on a terrible note, sending the Dow to its worst 10-day start to the year on record going back to 1897! Although the market began to turn back up during the latter part of January, it started to decline sharply again in early February, eventually bringing the market down to a year to date total return of -11.4% by mid-February. Fortunately, the fears of an economic meltdown gradually dissipated from that point on and the market actually ended the quarter up a modest 1.35%.

Nonetheless, the first quarter was one of those nervous market periods where so-called defensive stocks (as opposed to growth stocks) took their place on the leader board given the perceived stable nature of their operations. The Consumer Staples stock group (Proctor & Gamble, Coke, Clorox, etc.) is a perfect example of defensive type stocks. This sector accounted for 47% of the gains reported for the S&P. On the other end of the spectrum, Consumer Cyclical stocks ranked near the bottom during the period in terms of returns.

In the end, what matters most to investors is that economic growth remains healthy enough to increase consumer paychecks and grow corporate profits within a reasonable inflationary environment. The stock market began to move higher again in mid-February in response to what turned out to be an improvement in U.S. economic conditions. In addition, inflation is beginning to move higher and, excluding food and energy, is close to the Federal Reserve’s 2% objective for perhaps the first time since the stock market began to move higher in 2009. The velocity of money is also beginning to improve (+8%) which means the economy is finally making use of the extra money the Fed has been printing over the past several years. Barring a rash of terror attacks, talk of interest rate hikes, or another hit on oil prices, the investment environment should be OK for at least the short term.

Read More

Fourth Quarter 2015 Market Review

Having finally taken the plunge to initiate a cycle of rising interest rates, the question uppermost on many investors’ minds is whether or not the Federal Reserve will follow through and continue to raise rates over the course of 2016. While the recent performance of the US economy is less than uniformly supportive, policy makers indicate that they believe it is strong enough to support increasing rates.

But there is more to consider than just the domestic economy. As you know, with the advent of the internet, instantaneous global communications, and increased cross border trade, no single country is immune to what is going on in the world around it. We have seen a significant slowdown in the growth of the Chinese economy, collapsing commodity prices (particularly oil), and a startling drop in international freight rates and traffic. On top of these fundamental issues, there are political issues including terrorism and huge immigration flows into Europe (and the US).

Interestingly, the Fed is caught in something of a lose – lose position from a market perspective. If it continues to raise rates, investors may view that as too much of a headwind for securities prices. On the other hand, should the Fed back down from rate increases, that climb down may well be interpreted as a lack of confidence in the economy, both at home and abroad. One thing that we can be reasonably sure of is that, should the Fed continue on its course toward normalization of interest rates, the necessary increases will be slow. Under either scenario, a low rate environment is expected to persist for some time.

The stock market repeated its August swan dive in December driven primarily by declining oil prices and China fears. This drop, unfortunately, was not enough to enable your Rydex fund holding to remain above its end of September value. For the quarter, it fell 7.34% and 4.39% for the full year. Fixed income holdings also show a negative yearly return of 0.66%. This reflects the effects of the rate increase as well as investor aversion to anything but the very highest quality issues.

Read More

It’s Never too Early to Start Investing for Dividends

“The three worst things that ever happened to Investing are Ameritrade, E*Trade and Scottrade!”

Stock Market Data Showing Constant FluctuationsThat’s how I usually get started when I’m ready to climb on my soap box and discuss building wealth with anyone willing to listen. While I believe all of these institutions are reputable (in fact I have an account with Ameritrade), the “trade” in each of their names represents what I feel is a disturbing aspect of the investment industry; short-term thinking.

Instead of focusing on building a foundation for sustainable wealth, the focus tends to be one of beating the markets on a monthly, weekly, or even daily basis. Instead of finding well-run businesses that could eventually provide a predictable source of income, many investors are looking to derive income from trading, jumping in and out of the market; sometimes in minutes.

The Short Term Day-Trading Mindset Puts Long Term Financial Security at Risk

The day trading and active trading phenomenon has been a huge boon to the various discount brokers. Each transaction puts money in their pockets, regardless of whether it was profitable for the trader or not. There are a lot of disasters that result from the “trading your way to financial independence” mindset, but none are on the brokerage side of the business.

Even today, after two devastating stock market sell-offs in 2001 and again in 2008, individual investors are still looking to maximize their “total return” by whatever means is available to them. This is particularly true for pre-retirees who believe the best approach is to build up as much wealth as you can and then convert it over to “safer” investments after you retire.

Anyone following this approach saw their accounts drop considerably in value in 2001 and 2008 (and in the case of 2008, take nearly five years to recover if they stayed invested and performed like the broader market). But for those who manage their own accounts, there is a substantial risk of over-trading as market perceptions (read emotions) change. This often results in buying near market tops and selling near market bottoms: with the predictable result of wreaking havoc with your portfolio and your financial plans.

When you know you can sell something almost as soon as you buy it, it affects how you think about the purchase in the first place. You can be careless because you can get out quickly. With constant measurement of returns and the oppressive 24/7 media cycle, the pressure to act is immense.

You see a stock like Tesla (TSLA) start to run up and, remembering what happened in 2013 (the stock more than quadrupled), you buy in and try to ride the trend up just when it suddenly reverses (as it has three times since 2014) and hands you a short term trading loss.

Less Glamorous Dividend Investing Can Be a Great Long Term Investment

Check for Dividend Payment from Dividend Focused Investment PortfolioCompared to the excitement of finding the next moonshot stock, dividend investing is boring. In using dividends to secure financial independence, a portfolio of securities is run like a rental real estate portfolio. Each investment is made in anticipation of a future cash flow and judged versus the initial cost of that investment. The investor does not make any assumption of the future price of the stock as that price could be momentarily “unfairly” impacted by the market’s lack of enthusiasm for the business.
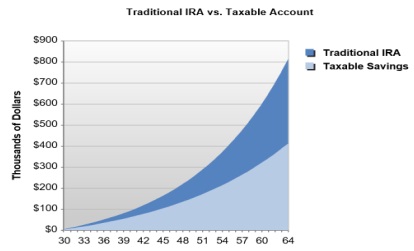
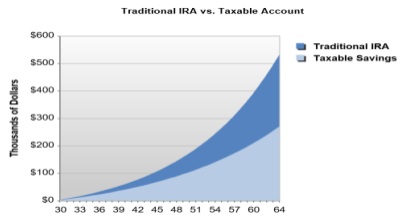
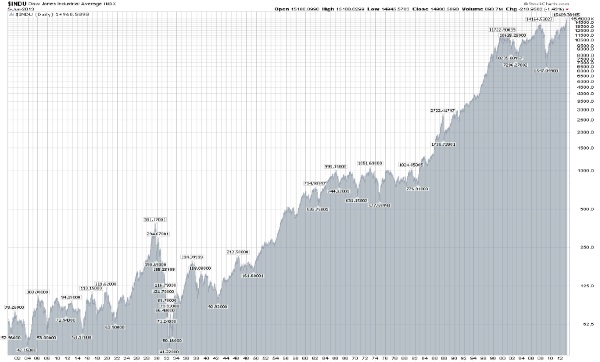
One of my favorite examples of this is Clorox (CLX). Clorox is almost never in the news; even during earnings season it hardly gets a passing mention. Yet Clorox has been paying a dividend since 1968 and has increased its dividend payment for 38 straight years.

In fact, based on numbers I took from Yahoo Finance, if you had started in 1990 with a $5,000 investment in Clorox and then made annual $5,000 investments plus the reinvestment of all dividends received, after nine more years you would have approximately $211,970 in your account. Your total investment would have been $53,614.33.

For the next 10 years from 2000 to 2009, if you only reinvested the dividends from your Clorox stock, the value of your shares would have grown to approximately $246,000. More importantly, the dividend income stream starting in 2010 would have grown from $9,574 per year to $12,572 in 2015. That’s a little over $1,000 per month that you would have received in 2015 by holding the stock. Let’s be clear: you would not have had to sell shares to have realized that monthly income.

For those of you keeping score, that’s an annual return of over 13% on your total investment of $92,743.72.*

Smaller Dividend ETF Investing Still Provides Strong Returns

Some would argue that this is a bad example since no one in their right mind would maintain such a large concentration in only one stock (assuming the $5000 invested is an IRA contribution). So let’s look at a more “realistic” example. Instead of investing in one stock, we will invest in an Exchange Traded Fund (ETF) called the SPDR S&P Dividend ETF (SDY).

This ETF “seeks to provide investment results that, before fees and expenses, correspond generally to the total return performance of the S&P High Yield Dividend Aristocrats™ Index. It has over 100 holdings comprised of companies from 10 different sectors that have a history of at least 20 consecutive years of dividend increases. It selects companies from the S&P 1500, which includes midsize and small-cap companies. That means the High Yield Dividend Aristocrats probably has some balance of both growth and income, as smaller companies are usually assumed to be faster growing than larger companies on average. With over 100 holdings, the risk of over-concentration in any one should be eliminated for all practical purposes.

Again using data from Yahoo Finance, I ran a ten-year study starting in 2006 using just $2,500 as the initial investment (assuming the other $2,500 would be invested in a non-correlated asset). Additional annual investments of $2,500 were made and all dividends were reinvested at the end of each year. By year-end 2015, the total annual contributions equaled $25,000 and reinvested dividends totaled $8,179 for a total investment of $33,179. The account balance at the end of 2015 was $42,099 and the total amount of dividends paid in 2015 was $2,436 (which is 7.3% of the $33,179 total investment).**

Again, we see that an investment plan focused on growing long term dividend income can be a very effective way to conservatively build a future income stream.

Try Summit’s Dividend Based Portfolio and Absolute Return Allocation

Can we do better than SDY? Sure! Summit has a dividend-focused portfolio consisting of 30 or so dividend paying stocks that are judged to be undervalued and therefore represent an opportunity for capital appreciation in addition to dividend income. We also combine this portfolio with a low correlation volatility-capture strategy in our Absolute Return Defensive allocation for those investors who are seeking dividend returns with less year-over-year volatility than equities alone.

In any case, the most important element of successful dividend investing is time. Time for accumulation and dividend compounding to start producing significant monthly payments that can supplement your other sources of retirement income. When it comes to dividend investing, time is the one thing that you can never get enough of.

So what are you waiting for?

Contact Summit for a free consultation on a long term dividend focused investment portfolio.
* In this study, for illustration purposes only, shares were purchased on the first trading day of each Calendar year. Your results may vary depending on the assumptions you make in trying to recreate this study. No assertion is made as to the accuracy of data provided by Yahoo Finance.
** In this study, for illustration purposes only, dividends were reinvested at the end of the week following the last dividend payment and additional shares were purchased on the last day of the Calendar year. Your results may vary depending on the assumptions you make in trying to recreate this study. No assertion is made as to the accuracy of data provided by Yahoo Finance.

Read More

Beat the Market but Lost Money? Absolute Return May Be the Strategy for You

You Measure Investment Success in Absolute Terms, Does Your Financial Advisor?

Investing has never been easier to do and more difficult to understand than it is today. Back in the early 1980’s when I first started investing, the mantra was: buy stocks for the long run. Then, after the crash of 1987, the message evolved into: build a balanced portfolio with 60% in stocks and 40% in bonds to protect your portfolio from any bumps in the road while growing your capital.

Nearly 30 years later, we have seen an explosion of investment products available to us. The two basic securities known as stocks and bonds have been sliced and diced by market cap (large, medium, small, and micro), growth versus value, yield, industry sector, country, quality (high or low), taxability (taxable, tax free, tax deferred), maturity (from long to short), coupon (again high or low), etc. Additionally, investors today also have access to options, futures, FOREX, precious metals, and real estate either directly or through mutual funds, Exchange Traded Funds (ETFs), or Exchange Traded Notes (ETNs).

Investors also have a seemingly never ending variety of advice on how they should be investing their personal assets. Some of these sources directly contradict each other!

Investment luminary and Vanguard’s founder John Bogle admonishes investors that matching market-based returns, especially when using his low-cost Vanguard branded funds and ETFs, yielded better results for most investors than picking individual stocks, market-timing, or any other investment strategy.

At the same time, Bloomberg columnist and wealth manager Barry Ritholtz reminds us that numerous studies have pointed out that weighting indexes on just about any fundamental basis other than market capitalization not only outperforms market-cap-weighted indexes (think S&P 500 and the like), they do so with less volatility.

Relative Performance: Success Is Beating the Market, Whether You Make or Lose Money

In all cases though, the assumed basis for measuring the merit of such sage advice is the performance of your individual account relative to some kind of benchmark, usually a broad-based market index like the S&P 500 for stocks and the Barclays U.S Aggregate Bond Index for fixed income.

The theory is that as long as you beat the index, you are doing fine. But is that really the best way to measure how you are doing when it comes to building and protecting your personal wealth?

In 2008 the S&P 500 lost 37%, so if you had started the year with $100,000 invested in a passive S&P 500 index fund, your account balance would have been reduced to $63,000 by the end of the year. Assuming you didn’t panic and just held on to the same fund, you would have waited until 2013 before your account was back over $100,000 in value. So, the question is: would you have felt much better if you were invested in a market beating fund (a relative out performer) that “only” lost $30,000 (for example) of your money in 2008?

While performance relative to a benchmark has become the generally accepted standard in the investment industry, most individual clients, whether they realize it or not, still focus on absolute returns. In other words, they really don’t care as much about beating a benchmark as they do about growing and preserving the money in their individual accounts. Many managers lost clients after 2008 even though they beat the market. Reason? They still lost an unacceptable amount of the client’s money!

The Absolute Return Alternative: Success Is Measured in Dollars Made

An alternative to the pervasive relative performance measure is absolute return. Absolute return is simply the appreciation or depreciation of the asset (stock, bond, fund, or portfolio, etc.) over a given time period. For example, if you invest $1,000 in a single stock and one year later that investment is worth $1,100, your absolute return is $100 or 10%.

Unlike traditional investment strategies, a strategy that pursues an absolute return is not measured against traditional market indexes but rather against its own return goals.

For example, an absolute return strategy may seek to outperform Treasury Bills by a certain margin since T-Bills are considered to represent the risk-free rate of return by many investment professionals. As such, absolute returns focus the investment manager on the most basic concern of the client – achieving a positive real return that enhances the client’s purchasing power.

Absolute return strategies are different from tactical strategies which dynamically increase or decrease exposure to asset classes in anticipation of or in response to changing market conditions. Instead, a manager deploying an absolute return strategy will use various asset classes and/or various hedging techniques, which may include derivatives and shorting, to attempt to achieve stable returns with moderate volatility.

The stability of returns is critical; they are trying to achieve an investment objective of positive annual returns with a consistent level of volatility, year after year regardless of what the market is doing. Remember that an unending string of positive returns is the goal, not a guarantee, and that the risk of incurring some level of loss or missing the goal is never truly eliminated regardless of what investment tools the manager may be using.

There are many absolute return strategies and each one offers its own unique approach to meeting a desired goal. Interested investors should try to understand the underlying strategy, its inherent risks, and its track record (in absolute terms of course!) before committing capital to any investment product.

Contact our financial advisors for a free consultation on starting an absolute return portfolio.

Read More

There is Still Time to Fund Your 2015 IRA

Many of us view April 15th*, the date by which we must file our tax returns for the preceding year, as an important deadline. However, for all of us, it actually represents a much more significant deadline:

Tax Day is the last day that we can make our 2015 contributions to our Individual Retirement Accounts.

Even if you have a 401(k), you can still have either a Traditional or Roth** IRA to make the most of your retirement savings. Your contributions may also be tax-deductable, which means they could reduce your taxable income and, therefore, the amount of tax you have to pay. If that’s the case, then each year you make a contribution, you could reduce your income tax and any gains in your account in your account will grow tax deferred.

The earlier you start saving with an IRA, the sooner you can start reaping the benefits of compounding and increasing your potential retirement income. Using the financial calculators at Bankrate.com****, you can see the potential results.

Results Summary for 30 Year Old Investor Contributing $5,500/Year

Graph Showing Results of Max IRA Contributions for 30 Year Old by Age 65

An individual age 30 with an initial $5,500 contribution and a $5,500 contribution every year thereafter can potentially accumulate a significant amount of money for retirement by age 65.***

  • Starting balance: $0
  • Contribution for 2015: $5,500
  • Total contributions by age 65: $192,500
  • IRA total before taxes: $813,524
  • Total for an equivalent taxable account: $413,051


Results Summary for 30 Year Old Investor Contributing $300/Month

Graph Showing Results for 30 Year Old Investing in IRA

Even if you cannot contribute the maximum allowable to your IRA, you can still make substantial progress toward retirement with smaller amounts. For example, even with a contribution of $300 per month, the benefits of tax deferred compounding become readily apparent.***

  • Starting balance: $0
  • Contribution for 2015: $3,600
  • Total contributions by age 65: $126,000
  • IRA total before taxes: $532,488
  • Total for an equivalent taxable account: $270,361

Opening an account with Summit Investment Management is simple and easy.

You can either open an account online and access portfolios designed to align with your individual risk profile or you can contact us for a New Client Enrollment kit that gives you access to our advisors for a more personal experience.

Either way, you can benefit by investing your retirement savings with an experienced investment team that actively manages your portfolios making investment decisions that are based on our highly disciplined, rules-based selection process.

So what are you waiting for? April 15th is just a few weeks away, start investing in your future today!

*April 15th, 2016 is the District of Columbia Emancipation Day and is considered to be a legal holiday so the due date for the 2015 tax returns is the next business day April 18th.
**If your income exceeds $131,000, you cannot contribute to a Roth IRA.
***These examples are for illustrative purposes only and do not represent the performance of any specific product. They assume a hypothetical 7% annual rate of return in a tax-deferred account.
****Bankrate.com is an independent, advertising-supported publisher and comparison service. Bankrate may be compensated in exchange for featured placement of certain sponsored products and services, or your clicking on certain links posted on this website. Learn more by visiting their site.

Read More

Third Quarter 2015 Market Review

History shows us that the greatest threats to a bull market are recessions. So when the market fell quickly (-11%) one week in August, investors and the financial press were quick to round up the usual suspects to blame for the recession that was likely to occur. Heading up the list was once again China which is struggling to keep its growth rate from declining too much due to the structural changes underway in that country.

Europe was also not progressing as well as hoped for despite the quantitative easing efforts their central bankers adopted a number of months ago.  And lastly, the talking heads on CNBC, etc. once again pointed to the perceived threat of Fed interest rate hikes that would “surely” pull the economy in the wrong direction.

The Dow Jones Industrial Average, S&P 500 and NASDAQ all declined in the 6%-7% range for the third quarter and brought the year-to-date results to minus 7-8%. Fortunately, the stock markets rebounded during October, which completely recouped these losses.  In addition, Intermediate Term bonds inched 0.95% higher during the quarter as the rates on 10 year U.S. Government Bonds declined from 2.33% to 2.06% for the period.

While we were surprised to see the market recover its losses so quickly, we did not believe a recession was imminent and, therefore, thought the August market decline was one of those “normal” corrections that most market gurus have been forecasting at one time or another over the past 2-3 years. In our opinion, China is doing an okay job of transitioning to a consumption based economy. Trends in Europe are still positive and their central banks are on alert to provide additional monetary stimulus if necessary.

And, finally, we very much doubt that a modest rise in interest rates will do noticeable harm to our economy. However, we rate the overall investment environment only good at the present time and we wouldn’t be surprised to see a bump in the road before global economic growth becomes more certain.

Read More

Second Quarter 2015 Market Review

The U.S. Economy rebounded from its modest decline of the first quarter that suffered from inclement weather on the East Coast, a prolonged dock strike on the West Coast, an abrupt decline in oil prices and the negative impact on exports caused by a strong dollar. The rebound seemed to return economic growth to the 2% – 2.5% range, modest by historical standards, but at a level that could prove sustainable for the longer term.

Unfortunately, a number of additional negative factors external to the U.S. began to restrict economic growth again late in the second quarter. These included a replay of the Greece fiasco, an escalation of Mid East violence, Chinese economic and stock market problems, and the fears of pending Fed interest rate increases.  As a result, the S&P 500 stock index increased just 0.28% in the second quarter and only 1.23% for the first six months of the year.

Consumer Discretionary stocks increased the most (+4.78%) for the quarter and once again the Utility sector turned in the worst return at -5.78% following its first quarter decline of 5.17%.  In the bond market, interest rates turned back up during the second quarter, resulting in a modest 0.62% decline for Barclays U.S. Intermediate Government/ Credit Bond Index.

As we look into the prospects for the second half of the year, we are encouraged by the improved health of the labor market and consumer balance sheets, but at the same time, believe the economy may struggle a bit over the next few months resulting in a less than perfect investment environment.

The resurgent strength of the dollar (up 15% vs. last year) and weaker oil prices (-49%) are exerting a greater than expected negative impact on corporate sales and profits.  While these factors might keep the market from moving appreciably higher near term, we continue to maintain a positive outlook for both the economy and the stock market.

Read More

First Quarter 2015 Market Review

The first quarter turned out to be one of the more volatile periods for the stock market we have seen since early 2012.  With the dollar strong and inclement weather a deterrent, investors first became concerned that economic growth was moving at a dangerously slow rate.  But then job growth picked up nicely, oil prices seemed to stabilize and investors began to regain confidence during February.  However, investors became concerned again, this time worried that the strong job gains would soon convince the Federal Reserve to raise interest rates.

The almost 0% short term interest rates that the Fed put into effect a few years ago have been the primary drivers of the economic recovery and especially important to the very good stock market we have experienced over the past 5 years.  As a result, investors have been highly sensitive to any potential upward adjustment in interest rates for quite some time now.

As a result of these on again, off again concerns, the S&P 500 stock market index rose just 0.95% during the first quarter despite no change in short term interest rates and good, albeit sub-par economic growth.  On the other hand, longer term rates did decline for the period as quantitative easing programs accelerated in Japan and began in Europe with some 10-year country government bond rates going to zero or less during the period.

This persuaded many global investors to convert their currencies into dollars and use these dollars to buy U.S. Government Bonds, thereby pushing prices higher and in turn, lowering interest rates.  As a result, the Barclays U.S. Intermediate Government Credit bond index increased 1.45% for the quarter.

Shifting gears back to the stock market, there was a relatively high degree of performance dispersion among the economic sectors during the period.  Benefitting from Government subsidies, Healthcare stocks performed the best (+6.5%) while the fear of rising interest rates hurt the Utility sector as stock prices in that category declined the most at -5.2%.

Finally, there was also a very clear performance distinction between growth and value stocks and between small, medium and large capitalization stocks.  Growth stocks outperformed in general and small capitalization stocks placed first overall.

The first quarter was a good period for active portfolio managers (i.e. stock pickers) given that the market was less correlated during the period than it has been in recent history.  According to a Barron’s article, “the 8,212 diversified equity funds tracked by Lipper…returned 2.48% for the January –March period, compared with just 0.8% for S&P 500 Index funds”. As noted earlier, the S&P 500 Index itself increased 0.95%.

The outlook for the stock market for the remainder of the year will continue to be importantly dependant on what happens to interest rates.  Overall, the global economy is still showing more signs of stagnation than not.  On the margin, the Eurozone’s economy appears to be improving, though barely.  U.S. economic growth has slowed this year and it’s not for certain that it was due primarily to bad weather.  The Japanese economy looks to be on its way to its third lost decade and China is slowing as are other major emerging markets.

This all suggests deflation is more likely the issue and raising rates would only slow business conditions further. We are also pleased to see that corporate earnings, excluding energy stocks, should increase about 8% this year, oil prices appear to be near a bottom, and the changing fundamentals of the Energy Industry promise to positively affect the economy and stock market long term.

Read More

Fourth Quarter 2014 Market Review

Wall Street forecasters believe the U.S. economy started off 2015 with the strongest momentum in at least a decade and is in better shape today than any other developed country in the world.  Importantly due to the full scale resurgence of the U.S. Energy Industry, economic growth has averaged 4.8% over the past two quarters, the highest rate in over a decade

With this non-farm payrolls are increasing at the fastest rate since 1999.  As a result, most stock and bond prices rose last year with the S&P 500 up 13.7%, the Dow Industrial Average at +10.4%, the average domestic stock mutual fund up 7.5% and the Barclay’s Government/Corporate Intermediate Bond Index rising 4.9%.  Large and middle sized stocks performed much better than small cap stocks during the year, but in the foreign stock arena, emerging market stocks declined 2.06% while foreign markets with developed markets were off 6.43%.

The equity markets in the U.S. were unusually volatile last year as investors negatively reacted to a number of events including the abrupt slow down in the economy early in the year, followed by Russia’s takeover of Crimea (March) and then the Ebola (October) crisis.

While the market recovered from all of these events by the end of October, another blow to investor confidence surfaced in December as oil prices declined sharply prompting many to assume that the global economy was in trouble. The outlook for 2015 will have a lot to do with how well the European economy holds up next year and what happens to the price of oil.

European officials recently announced quantitative monetary easing program similar to what the U.S., U.K. and Japan have been using to stimulate economic activity.  At a minimum, their efforts should keep the Eurozone from slipping into a recession, ward off deflation, and perhaps help to modestly grow the economy.  This should be enough to remove the negative aura from the market.

We’ve several times in the past made mention of the very major and positive changes expected to incur in the energy industry, and these expectations are quickly becoming a reality.  The fact that the U.S. is near or at energy independence and prices have declined, has major positive long term benefits for the U.S. and many other parts of the world.  A near term perceived problem, however, is that the sharp drop in oil and other energy prices reflects a very weak global economy.

While we do not believe that to be the case, the stock market might prove volatile until it becomes clear that oil prices have at least stabilized. Longer term, the changing complexion of the Energy Industry promises to have fundamentally positive effects on the U.S. economy and its stock market

Read More

Second Quarter 2014 Market Review

The stock market continued to move higher in the second quarter of 2014 despite the abrupt halt of Japan’s economic turnaround, the geopolitical issues in the Ukraine and the Middle East, and concerns that US economic growth was in jeopardy. But in the end, what matters most to the US Stock market is that our economy moves in a positive direction and that inflation does not get out of hand to the upside. Fortunately, government estimates of inflation indicate that it is well under control and the recent upturn in the economy is a clear signal that business conditions are moving in a positive direction.

As a result, the S&P 500 Composite Index of stocks increased 5.23% during the second quarter and 7.14% for the first half of 2014. Mid and Large Cap stocks easily outperformed small cap issues in both the growth and value categories for the second quarter. All ten economic sectors posted positive results for the quarter and the three biggest contributors to the first half were Technology (1), Health Care (2), and Energy (3).

Looking into the months ahead, it’s important to recognize that recessions are primarily caused by the Federal Reserve when it tightens credit conditions (raises interest rates) to slow economic growth that in turn helps to slow inflation rates. We do not believe a policy to tighten credit is imminent, especially given today’s circumstances. The obvious reason is that inflation trends have been modest in most cases and there also appears to be a good deal of excess productive capacity available in today’s global market place.

A second, and possibly more important reason, is that many major governments of the world need inflation (read higher taxes) to help service their debt obligations which have increased substantially over the past several years. On the other hand, should the Fed and/or other central bankers of the world tighten credit availability too soon, deflation and an extremely difficult financial environment would likely result. Fortunately, Central Bankers around the world are keenly aware of this scenario and, therefore, not likely to let the world fall into a deflationary mode.

As a consequence, it may be quite some time before interest rates are increased worldwide given the slower growth in China, the almost recessionary conditions in Japan and parts of Europe, and the relatively modest growth we are experiencing in the US. For the most part, the Federal Reserve has been on its own when it comes to reigniting growth in our economy and even though our economy is in better shape than others, it is evident that the Fed’s efforts have not led to an environment of self-sustaining growth.

And even if the Fed moves to increase rates sometime in the future, their influence on world markets is lessening given increased globalization. For instance, today’s U.S. 10-year Government Bond trades at an extremely low rate of 2.41%; heavily influenced by Spain’s 2.15% rate even though it is obviously a much riskier investment.

If world interest rates remain low and the investing public begins to believe they will stay low for more than just the short term, stock prices could move higher from current levels since history shows they are undervalued based on today’s interest rates. For example, a recent study by a well-respected financial firm indicated that based on current interest rates and consensus earnings estimates, the S&P 500 is currently about 7. 5% undervalued.

Please understand that there are a lot of “ifs” included in this scenario and that the implied revaluation is likely to unfold over the next year or so. In the meantime, our economy has improved, corporate earnings are improving, and the overall environment for stocks on balance appears positive.

Read More

First Quarter 2014 Market Review

Volatility and a higher level of anxiety returned to the markets during the first quarter. The primary catalysts were the “evil empire’s” invasion of Crimea and a severe slowdown in the economy induced by colder than normal temperatures. The inclement weather kept consumers away from the shopping malls and Russia’s political aggressions clearly detracted from investor confidence. Fortunately, business conditions appear to be getting better with the cold weather behind us and the political issues could be dealt with by adopting some intelligent U.S. energy policies.

Value stocks clearly outperformed growth stocks during the period while midcap stocks outperformed both large and small stocks. Following several months of underperformance, utility stocks posted the best sector gains for the period and consumer discretionary stocks performed the worst, reflecting the sharp drop in economic growth.

Despite the economic slowdown, the majority of corporate earnings reported were above expectations and analysts have recently been raising their numbers for the second quarter. Overall, the market moved modestly higher during the quarter. The S&P 500 increased 1.8%. With business conditions sluggish, interest rates declined during the quarter and this provided a rebound in bond prices following last year’s 0.86% decline, the first fall-off that has occurred since the mid-1980s.

There seems to be a much higher than normal number of people calling for a severe market correction. One of the reasons often cited by naysayers is that the market is too expensive and therefore vulnerable to a bear market. The most recent earnings estimate published for the S&P 500 is $121.86 and at today’s stock prices, the market sells at a PE of 15.8x compared to 18.8x during the last market peak in 2007.

History shows that major downward moves are primarily influenced by economic recessions, not by valuation. The soft first quarter was a temporary weather-induced setback from the uptrend; recent activity has clearly improved; and with excess capacity available and no labor shortages, higher inflation is not a threat for the Federal Reserve to contend with. While this is not to say that we can’t have a meaningful correction, it’s difficult to see a full-fledged bear market on the immediate horizon.

Read More

Fourth Quarter 2013 Market Review

A year ago today, investors were losing sleep over a number of issues that appeared to be legitimate concerns. Fortunately, almost none of these concerns materialized. There was no fiscal cliff, the U.S. did not default on its debt, Europe did not disintegrate, and while China’s growth slowed, there was clearly no hard landing.

The result was an outstanding year for the U.S. stock market. The S&P 500 posted its best gain (+32.39%) since 1997 and all ten economic sectors reported gains for the period. Growth stocks outperformed value stocks and that was especially evidenced by the modest returns earned by dividend yield stocks, many of which are found in the utility and telecommunication sectors.

Both of these sectors increased less than half as much as the S&P 500! The bond market struggled through most of the year as everything but savings rates and the lowest government rates moved higher. The Intermediate Government/Credit Bond Index declined 0.86% last year and the Aaa -A Rated Corporate Bond Index fell 1.94%. A legendary baseball coach once said “never make predictions, especially about the future.”

Having said this, we believe the economic outlook is good enough to support another positive year for stocks, despite the very strong gains the market has already achieved since 2009 and the current complacent mindset of investors. The latest survey shows that a 25 year low, 15% of market forecasters are bearish on the market. This is a contrary opinion indicator which currently suggests the market is due for a correction.

On the other hand, the economy should do better than 2013 as monetary stimulus continues and last year’s fiscal tightening from increased payroll taxes and the sequester lessens. Bottom line, any correction that might occur is not likely to reverse the market’s longer term uptrend.

Read More

Third Quarter 2013 Market Review

After suffering through a plethora of negative events for more than three years, almost nothing appears to meaningfully raise the anxiety level of investors these days. We commented early in the year that a better housing market, permanent changes to our tax code, and fixes made to the European banking system should substantially lessen the market’s volatility and risk exposure.

The virtually crisis-free environment over much of the past twelve months has resulted in good stocks going up and problem stocks going down. This more normal investment environment is expected to continue the majority of time over the next several years. The good news is that our company-specific, fundamental type selection process tends to perform well during periods like these.

Growth stocks significantly outperformed at all market capitalization levels and for the second quarter in a row, while the higher dividend paying utility, telecommunication and consumer staples stocks collectively lost money. Small Capitalization stocks outperformed both mid-cap and large-cap stocks. The S&P 500 Indexes rose 6.02% and 5.24%, respectively.

Interest rates rose slightly during the period, resulting in a modest 0.62% gain for Barclay’s Intermediate Government/Credit Index and a 0.72% gain for the S&P 2018 Municipal Bond Index. Looking into the fourth quarter; U.S. economic growth is slower but not negative; Europe seems to be gaining some traction for the first time since 2007; the political wrangling has been put on hold for 90 days; the sequester is reducing Government debt; and the appointment of Janet Yellon to head up the Fed may provide even more stimulus to the economy and markets than “helicopter Ben” bestowed upon us.

Short term, the market is overbought and investor sentiment is a bit complacent. While these last two factors have typically resulted in a temporary market consolidation, we haven’t had a meaningful correction since the market began its turnaround in 2009, and this pattern might just remain the same this time around.

Read More

Second Quarter 2013 Market Review

Events like the IRS scandal, Egyptian political problems, Obamacare missteps, NSA phone taps, China’s credit crunch, the Benghazi disaster, and Japan’s economic instability were not significant enough to disrupt the stability of the U.S. stock market in the quarter just ended.

On the other hand, most foreign stock markets were noticeably weak during the period, and the abrupt increase in interest rates caused a temporary 6% correction of stock prices and an even greater correction for stocks that pay above average dividends. This hurt prices for stocks like utilities, which declined 2.73% for the quarter. On the other end of the spectrum, financial stocks led the way with a 7.25% gain followed by consumer discretionary stocks at +6.81%.

Overall, the S&P 500 increased 2.91% for the quarter. Growth stocks outperformed in the small and mid-cap space, but it was value stocks that took first place in the Large Cap arena. The average U.S. domestic mutual fund increased 2.29%, the average Foreign Stock fund was off 2.2% and taxable bond funds declined 2.43%.

Our experience in the most recent quarter continues to bolster the opinion held by many fund managers that the market continues to be decoupled from the overall economy as a result of unprecedented intervention by Central Banks worldwide. This is evidenced by the spike in volatility we observed at the mere hint that the US Federal Reserve may begin tapering its current stimulus effort known as QE3. Moving forward, we expect Federal Reserve policy to remain accommodating as the fundamentals of the economy have leveled off and in some areas have even begun to deteriorate.

While these policies have been bullish for stocks to this point, the longer they continue without substantial improvement in the economy, the greater the risk of periods of higher volatility for which our newly revised hedge is well suited. Add to this the uncertainty over the continued implementation of Obamacare, the first major city bankruptcy in Detroit, the ongoing tax and budget battles in Washington DC, and you have an environment where unhedged portfolios could experience uncomfortable P/L swings.

Still, over the near term, we do not believe we are on the verge of a new recession and that equities, with proper protections in place will continue to be the place to be invested.

Read More

First Quarter 2013 Market Review

The investment climate was remarkably good during the first quarter.

With the exception of the financial melt-down of the tiny island, Cyprus, and some late in the period saber rattling by the North Koreans, investors benefited from a virtually crisis free environment. The housing industry continued to improve. Corporate profits were modestly higher and above expectations. Economic growth was mostly steady and only softened with the uncertainties created by the sequester. And finally, stock market volatility dropped sharply and more than half of the ten economic sector stock price indexes posted double digit gains for the quarter.

The Health Care sector led the way with a 15.22% gain while both Technology and Basic Materials came in below 5% for the period. The S&P 500 reported a total return of 10.61% for the period and the average diversified domestic stock mutual fund was up 10.2%. Small Cap stocks outperformed large company stocks and value (defensive) stocks outperformed growth issues in most areas. In the fixed income area, the Intermediate Government/Credit Bond Index increased just 0.26%.

Given the above average strength of the stock market over the past six months, it is not unusual for the market to pause or pull back for a period of time.

In addition, the April to May period is a typical seasonal period during which such corrections have occurred in the past. It is not necessarily usual, however, for the markets to undergo a major decline unless stocks are extremely overvalued, economic conditions deteriorate substantially or something catastrophic like another financial meltdown occurs. Stocks are not excessively expensive based on historical standards, and in our opinion, economic conditions are holding and another financial meltdown is not in the cards.

Read More

The Stock Market’s Pre-Halloween Horror Show

A Five Part Chill Ride

From an attitude of complete complacency throughout 2013 and through the summer of this year, investors are suddenly beginning to take fright. But, what, exactly, are they afraid of? Here’s a short list of things that seem to be going bump in the night.

  1. October

    This is probably the least frightening thing, but it is true that historically, October is the most volatile month of the year. Whether this has to do with mutual fund jockeying before the end of the fiscal year or pre-holiday jitters, no one knows for sure. What the market has shown so far this month is not out of the norm.

  2. Fed tightening

    The Federal Reserve continues to rumble about eventual tightening. At the same time, it repeatedly assures that any interest rate increases will be slow and measured to make sure the economy doesn’t crumble in response. Can we trust them? Do they know how to deliver what they promise? If the past is any guide, rate increases will probably provide something of a bumpy ride for the market.

  3. Geopolitical problems

    From ISIS, to Russia, to China, to our own southern border,there seems no end to geopolitical worries now that our government has stepped back from its traditional center stage role in international affairs.

    • ISIS has taken large chunks of territory in both Iraq and Syria. It sits on the border of Turkey, a member of NATO and is threatening Jordan and Lebanon. ISIS has announced their intention to bring down the government of Iran and to hijack that country’s own contentious nuclear program. Furthermore, they have ambitions to infiltrate terrorists into the US through our virtually unguarded border with Mexico. Certainly, if they can destabilize Turkey, take down Iran, or manage a large scale terrorist attack within the US, the fallout could be damaging to the market. Russia and China have both taken much more aggressive military postures of late.
    • Russia, of course, has annexed Crimea and is making at least a small scale war in eastern Ukraine. Obviously, part of the motivation is pure opportunism, but at what point will the West call Putin’s bluff. If it is a bluff. Russia’s economy runs on oil and with the oil price having come off signifcantly of late, it will be intereting to see if that take the wind out of Putin’s sails, or, on the other hand, further motivate him to be adventurous abroad to divert his public’s focus from a stalling economy.
    • China, too, is flexing its military muscles. With tens of millions of young men with no chance of finding a bride, thanks to its misguided “one child policy”, the testosterone levels in China’s armed forces must be unbelievable. So far, China has been limited to bullying Japan and trying to push the US Navy around a bit in the waters off the Chinese coast. Nonetheless, China’s tone and actions have been worrying enough to push Japan to the point where that country is rethinking its commitment to post WWII pacifism.
    • So much has been written about our southern border problems that it’s hard to add anything new. Nonetheless, it should be repeated that a lack of control of who enters the US could lead to severe internal security problems in a worst case scenario.


  4. Ebola

    With the first reported US fatality, a fatality and confirmed case in Spain, and worries about suspected cases in the UK and Australia, the fear of Ebola and its possible consequences is certainly onthe rise. Beyond the health fears, though, lies a fear that points a potential dagger at the heart of the market. The economies of the countries hardest hit by the plague, Liberia and Sierra Leone, have virtually collapsed. Could a similar chain of events bring the US economy, or the world economy, to a standstill?

    Western medicine is certainly light years ahead of the healing arts in west Africa. The medical authorities in developed countries claim that they are prepared and that there will be no pandemic in Western nations. But the apparent bungling of cases in Spain and here in Dallas leave the public, and the market, skeptical.

  5. Global economics

    While the US seems to be making slow but fairly steady progress, things are not so good in other corners of the globe. The European economy is definitely slowing, as are Japan and China. Can a weak, but recovering, US economy withstand the headwinds from the rest of the world? At 10/9/14’s close of 1928.21, the S&P 500 is only 4.5% off its most recent intra-day high of 2018.66, set back on September 19th.

The market was certainly ripe for a correction, at least, and whether this dip turns into more than that may well be known by the time Halloween arrives.

Read More

The Importance of Avoiding Losses

Avoiding Stock Market Losses Yields Huge Returns

One of the most important investment issues facing an equity (stock market) investor, if not THE most important, is the avoidance of investment losses. Oddly, this is rarely discussed by investment advisers despite the fact that, in our opinion, it is far more important than virtually any other variable affecting long term investment returns. Topics discussed include an explanation of how losses cripple returns, common strategies used by investment managers to counteract this problem and why they are ineffectual, and lastly, a description of how Summit Investment Management deals with this issue.

Any discussion of this topic must begin with an understanding of the variability of stock market returns. We will use price only returns to the Dow Jones Industrial Average (DJIA) to illustrate our points.

Graph Showing Dow Jones Industrial Average over 113 Year Period

In the one hundred thirteen (113) years since the turn of the 20th century, the DJIA has produced positive annual price returns (excluding dividends) seventy-three (73) times. In other words, there have been forty (40) years of negative calendar returns.

This means that the DJIA has declined approximately thirty-five percent (35%) of the time on an annual basis.

An investor, therefore, should expect that on average, over a 3 year holding period, there is likely to be one year with a negative return. While that is a statistical fact, it doesn’t always play out that way in reality as the DJIA has had winning streaks of 4 or 5 consecutive years and even one (in the 1990’s) that lasted 9 years as well as losing streaks of 3 or 4 straight years in duration.

“So what?” the investor might well ask. The DJIA produced a return of 19,731% over that time period or 4.79% annually. An initial investment of $1,000 would have become $197,307. Isn’t that good enough?

To answer that question, let’s see what happens to results when we manage to avoid those 40 years of negative returns. We will assume that when the historical market return is less than zero (0%), instead of a negative return our DJIA portfolio return is now zero (0%). No losses are allowed. Obviously, the returns will be higher, but how much higher?

It turns out that by staying even when the market declines makes a world of difference in performance. The results, in fact, are so good that they are difficult to comprehend.

Instead of a compound return of 19,731%, this “no down year” DJIA garnered a total return of 24,151,084%.

Chart Showing DJIA Prices

That equates to an average annual return of 11.59% or 6.80% more annually, on average, than the DJIA actually returned with both up and down years. That initial $1,000 investment would have grown to $241,510,837.

Over a century is a very, very long time for an individual. It can be within the investment horizon of a wealthy, multi-generational family, a corporation, foundation, or trust, however.

But to bring this concept into focus for most investors, let’s look at the experience since the turn of the 21st, rather than 20th, century. In the thirteen (13) full years that have passed since New Year’s Eve 1999, the DJIA has had eight (8) years of positive returns (2003, 2004, 2006, 2007, 2009, 2010, 2011, 2012) and five (5) years of negative returns (2000, 2001, 2002, 2005, 2008).

Graph of Dow Jones Industrial Average Annual Return 2000-2012

This is slightly more negative than our full period would have led us to expect, with about a thirty-eight percent (38%) occurrence of negative results (35% over the 113 year period). The DJIA produced a total return of just 13.98% in that time, or a paltry 1.01% per year on average. Without any loss years, those figures become 138.89% and 6.93%, respectively.

Let’s take this one step further. Rather than limit our study to calendar years, we will now eliminate any market declines of 10% or more, whenever they may happen during our study period. Our analysis shows that since 1900, the DJIA has tumbled ten percent (10%) or more on seventy-seven (77) different occasions. That equates, on average, to once every 536 days or approximately once every eighteen months.

The worst uninterrupted decline of –64.71% came, not in 1929, but between November, 1931 and July, 1932. The market plunge in 2008 – 2009 was the second worst on record, dropping 49.86% from top to bottom.

Starting with our latest 2000 – 2012 period and eliminating those falls of ten percent (10%) or more has an even greater effect than our calendar year experiment showed. Over the course of those years, there have been eleven (11) periods in which the DJIA dropped more than ten percent (10%). By eliminating these losses, the total return for the thirteen year span increases to 1,597.66% or 24.34% per annum. An initial investment of $1,000, therefore, would have become $15,976.61 rather than the $1,139.80 that was possible through the loss including DJIA.

For the full one hundred thirteen (113) year period, the elimination of any market declines of ten percent (10%) or more results in a truly “jaw-dropping” return. If you wish to learn more about the full period effect, please contact Summit. It is clear that, solely from a return perspective, there is a strong case for the importance of avoiding losses.

But there is another perspective that is also quite compelling in its own right.

To understand this additional perspective, consider the following scenario. One million dollars ($1 million) has been amassed to fund a future project. That project can be of any nature whatever; retirement funding, or philanthropic giving for example.

When a severe market downturn hits, long held plans can be jeopardized. Often the sponsor/investor is left with one of two poor choices. To preserve the principal of the fund, disbursement amounts can be cut. This can ensure the survival of the project longer term but may cause severe disruptions near term as funding is reduced.

Sometimes, as is the case with mortgage obligations, disbursements cannot be minimized. In such cases, the principal amount can be irreparably damaged as the periodic fixed payments represent a much larger percentage of the remaining principal. Principal can be prematurely exhausted, leading to an untimely project end. In either case, the project being funded will suffer. The only real difference is in the timing.

Common Investment Management Responses

Investment managers, recognizing, at least to some extent, the problem posed by losses, commonly resort to the use of three common “remedies”. The first remedy, and the oldest, is diversification. Market timing, or the moving of funds from one asset class to another in the hopes of avoiding a decline is the second. The third remedy is to restrict equity investments to “value” stocks.

If we look at the major asset classes of Treasury bills, bonds, and common stocks we are struck by a dilemma. The most attractive asset on a return basis, common stocks, is the least attractive on the basis of return variability. Conversely, Treasury bills are the most attractive asset in terms of return variability but least so when it comes to returns.

The typical manager response to this conundrum is to recommend a diversified portfolio.

The investor thereby gains some return stability at the cost of lower returns. Ah, but the manager will say, because these asset classes sometimes move independently of one another, the risk-return tradeoff is superior as measured by something called the Sharpe ratio!

Unfortunately, you can’t spend your Sharpe ratio. Lower returns are lower returns and that means that, at the end of the day, you will end up with less money in your account than you would have had you owned only equities, unless, of course, your accumulation period happens to end coincidentally with a stock market decline.

Investment managers who market time are working to keep their clients’ funds invested in the most attractive asset at any given moment. There are many variations of this strategy from managers who will completely exit an asset class to those who will slightly tilt their asset weights in response to whatever types of signals they may use.

Those signals can be based on economic changes, interest rates, price movements, seasonality or any of a host of possible indicators or combinations of indicators. What they all have in common is that they tend to miss crucial turning points in market direction. Therefore, assets are often unexposed or under-exposed to some of the biggest return days.

In the stock market it has been estimated that missing just the best 25 days of returns to the S&P 500, for example, would reduce the return of an investor from 9.8% to just 6.1% (for the period 1970 through 2011). That’s twenty-five (25) days out of a total of ten thousand six hundred thirty-seven days (10,637), or just .24% of the days over the period of the study. That is an incredibly small margin for error. To miss less than one fourth of one percent of the possible investment days and wind up with an annual return that is reduced by thirty-eight percent (38%) is shocking.

Timing the market, therefore, is highly risky as it could lead to the missing of those crucial return days.

Value investing has a long and successful history. It has shown itself generally superior to a growth based approach to the stock market in periods of market decline. But it is not a panacea as the most recent severe stock sell-off illustrates.

The Summit Approach to Loss Avoidance

We have now seen the nature of the problem and the most common steps taken to deal with it. Returns can be greatly enhanced if losses are avoided. Diversification, while it can reduce losses, can also result in reduced returns. Market timing is highly risky. A value based portfolio doesn’t always provide its owner with protection from a generalized market decline.

Through its expertise in options, Summit has developed an approach that addresses the issue of avoiding losses without diluting returns through diversification, taking on the risk of market timing, or blindly trusting in the shield of value investing.

What Summit has done is to