Q1 2019 – Climbing the Wall of Worry
The stock market these days seems to be a little like spring time in Wisconsin. If you don’t like what’s happening, just wait a day and it will be better or worse.
After enduring a really, tough December that saw the S&P 500 fall by an unsettling 9%, January came in with an impressive 8% rise and ongoing gains to close the quarter up 13.65%. That’s oftentimes a good year!
Just as we heard many reasons for the end of year downdraft (which technically nearly became a correction), we heard several reasons for the recovery this past quarter. The best explanation, in our opinion, was the March 20th decision by the Federal Reserve to hold interest rates steady along with an indication that there will be no more rate hikes this year.
The announcement comes three months after the central bank raised rates for the fourth time in 2018 and said two hikes would be appropriate in 2019. The central bank also says it will complete its balance sheet roll-off program at the end of the September which we considered to be an additional “stealth” rate hike in terms of decreasing liquidity.
This reversal in policy began long before the FOMC meeting at the end of January. On January 4th, Fed Chairman Powell mentioned muted inflation and a patient Fed in his remarks at the American Economic Association meeting in Atlanta. A week later, he was proclaiming patience again, this time before the Economic Club of Washington.
Apparently, “patience” had been on Fed policy-makers’ minds for some time. The minutes of the December FOMC meeting, released in January, already contained the word ‘patient’ and the ‘muted inflation pressures’ that crept into the January statement. They were attributed to ‘many participants’ who may have been chafing in the aftermath of Powell’s December press conference which preceded (and may have been the proximate cause of) a market downturn.

Anatomy of a Fed Backpedal
We have no claim to knowledge as to why the Fed reversed course so abruptly. Was it President Trump, Goldman Sachs or the Rothschilds? All we do know is that, as far as monetary policy goes, the Federal Reserve has removed itself as a stumbling block for further gains in the market.
Of course, when one door closes, another opens and the Fed’s actions were not without consequences, perhaps unintended.
The Yield Curve Inverts!
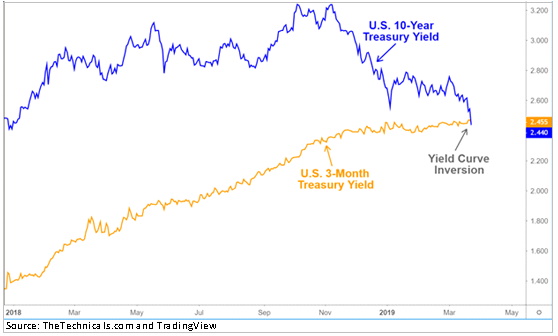
Thanks to a sudden surge of buying that pushed long-term rates sharply lower after the March announcement, the yield curve is now “inverted.” This warning has preceded “seven of four” recent bear markets (more on this in a moment). Time to be safe and sell everything?
That’s been the cry in the financial media the last few days as we faced the dreaded inverted yield curve.
Should we be scared? Should we change our investing strategy?
No and no.
The yield curve – especially an inverted yield curve – is a legitimate economic indicator and we should not dismiss it.
But, at the same time, it’s not as simple as the headlines make it out to be. Nothing ever is and it’s critical that we put things into the proper context.
What is an Inverted Yield Curve?
In case you’ve never took an economics class, let’s start with an explanation of what the yield curve is.
Basically, the yield curve is the measure of interest rates (or yields) from short term to long term. As a rule, short-term yields should be lower than long-term yields. This is known as a normal yield curve. If you’re going to park your money in a long-term bond, you want a higher yield to offset any risks that may develop while your money is invested.
The yield curve “inverts” when short-term rates become higher than long-term rates. So, if a short-term rate is higher than a longer term rate, that part of the yield curve is inverted.
This is what just happened by one measure. The yield on three-month U.S. Treasury bonds ticked higher than the yield on 10-year U.S. Treasury bonds.
In simple terms, the U.S. government is paying you more for lending them money for three months than if you decided to loan them money for 10 years.
This created short-term turbulence because an inverted yield curve is often associated with a looming recession.
Before we go any further, let’s make two critical points: First, a recession is not a given. Yes, there is a business cycle and someday we will have a recession but, and this is the second point, all indications are that it’s still potentially a long way off.
Critical Context
Information without context is almost as bad as no information at all.
Without the proper context, you are more susceptible to bad decisions that can cost you money from bad investments, missed opportunities, or both.
Here are two critical points of context to keep in mind:
Critical Context Point 1: There are large number of interest rates that are considered either “short-term” or “long-term.” That means there are also a large number of different rates to compare in search of a yield curve inversion.
All the recent headline noise came from the 10-year yield dipping below the three month yield.
Another yield comparison that gets a lot of attention is between the 10-year and 30-year yields. That part of the yield curve has not inverted. In fact, just the opposite. The spread between the two has increased, which is considered very healthy.
A third yield relationship that is frequently referenced is two-year yields versus the 10 year yield. This has not inverted either. Interestingly enough, the last five times it has inverted, the S&P 500 continued higher and peaked 19 months later. If that scenario happened today, we’d be looking for a peak in October 2020.
There’s a lot of money to be made in that time. The mean return from when the two year/10-year relationship inverted to the market peak is 22.3%.
Now is not the time to get all defensive.
Critical Context Point 2: You must look at which end of the yield curve is moving.
In this case, the yield on three-month Treasuries was moving higher more than the 10 year yield is falling.
There’s a very simple explanation for that: The Federal Reserve has raised interest rates nine times in a little over three years.
The Fed has much more control over short-term rates. Long-dated yields are more market driven.
You need to watch both ends. The Fed last pressured short-dated bond yields in the 1990s, according to LPL. The short end of the yield curve inverted twice in that decade but the 10 year/30-year never did.
Fundamental Capital’s Troy Bombardia, a favorite source of historical finance information, has run the numbers on what happens to the S&P 500 when the 10 year “long” yield dives below the three-month rate:
- In 1966, 1973, 2000, and 2006, an inverted yield curve indeed preceded a big stock market pullback (usually by a year or two).
- Meanwhile in 1978, 1980 and 1989 it didn’t mean much. Investors who sold on this indicator likely regretted it.
From this analysis then, the record of yield curve inversions as an indicator of an imminent bear market is no better than mixed.
Nuclear Winter Warnings
While all eyes have been on the nuclear showdown between Trump and North Korea, our eyes have been looking at another area of the world that is not getting much attention.
India and Pakistan have long engaged in a festering conflict the veteran foreign reporter Eric Margolis has called “the world’s most dangerous crisis.”
Even so, this is the first time we’ve seen fit to make it a lead item on our list of what keeps us up at night. That’s how big a deal it is. If it went nuclear, there’s no telling what the impact on the world might be.
“It is almost unprecedented for two nuclear-armed countries to carry out air strikes into each other’s territories,” reports the BBC’s correspondent in Delhi and yet that’s what’s happened in recent weeks.
The trouble began on February 14th — well, really it began in 1947, but we’re getting ahead of ourselves — when a suicide bomber killed at least 42 Indian troops in the disputed territory of Kashmir. India’s government held Pakistan’s government responsible.
Events have escalated to a point that the Pakistani government claimed it shot down two Indian military jets and captured a pilot.
“India and Pakistan, both nuclear-armed, have fought four wars over divided Kashmir since 1947,” Mr. Margolis explains. That’s when the Indian subcontinent won independence from Britain.
Kashmir is a majority-Muslim territory. Two-thirds of it sits in Hindu-majority India. The other third lies in Muslim-majority Pakistan.
As international conflicts go, Kashmir is probably more intractable than Israel-Palestine and it’s way more perilous.

India’s conventional forces would overwhelm Pakistan’s in the event of all-out war. Pakistan’s only means of effectively fighting back would be tactical nukes. “Both sides’ nuclear forces are on a hair-trigger alert, greatly increasing the risks of an accidental nuclear exchange,” Margolis writes.
“Rand Corp. estimated a decade ago that such a nuclear exchange would kill 2 million immediately and 100 million in ensuing weeks. India’s and Pakistan’s major water sources would be contaminated. Clouds of radioactive dust would blow around the globe.”
A more recent estimate by Physicians for Social Responsibility pegs the numbers at 20 million dead in the first week and 2 billion from the resulting global famine.
The risk that hostilities could rapidly spiral out of control eased slightly after Imran Khan, Pakistan’s cricket-star-turned-prime-minister, announced he was returning the pilot to India in a “goodwill gesture.” Commander Varthaman was duly handed over to India. Mr. Khan — elected with military support just last year and still wrestling with a severe economic crisis — has also implored New Delhi to engage in dialogue and avoid any “miscalculation” that could lead to greater conflict.
So that’s a thumbnail sketch of both the background and the latest developments. If you want to know more, Google is your friend. Or you can read Margolis’ excellent book War at the Top of the World — complete with his firsthand accounts of getting shot at along the “Line of Control” in Kashmir at 16,000 feet above sea level.
Sub Prime Debt Bomb
We’ve seen a lot of news coverage and internet postings recently that work to rekindle investors’ worst fears of a return to the dark days of the financial crisis. Several articles have warned that consumer debt and loan delinquencies are rising, particularly in the auto space. But this doesn’t mean a crisis is brewing. Delinquencies and losses are only part of the story for subprime autos.
Loomis-Sayles’ Senior Mortgage and Structured Finance Analyst, Jennifer Thomas, provided the analysis below recently as to why Loomis-Sayles thinks that the subprime auto sector is in better shape than it gets credit for:
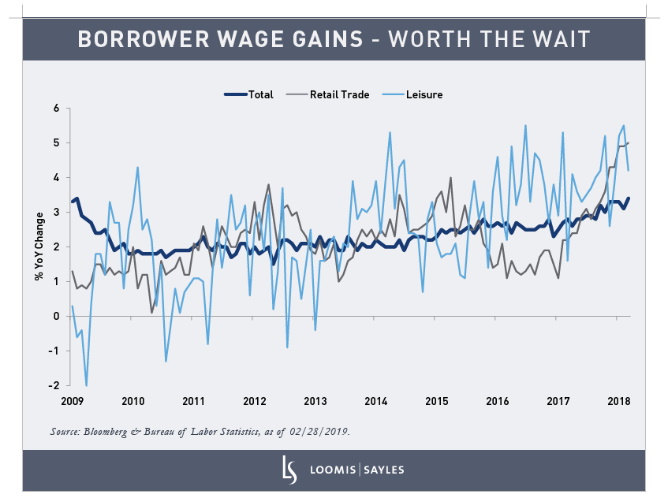
Borrower wage gains – worth the wait
Subprime borrowers tend to be lower-income earners. For this group, wage gains usually don’t materialize until late in the economic cycle. This has certainly been the case with the current cycle. A decade into the recovery, lower-income groups are only now enjoying strong income growth. But higher wages are worth the wait. Recent earnings relative to expenditures can have an impact on borrowers’ payment and default behavior. And compared to other workers, wage increases are especially meaningful for subprime borrowers, many of whom live paycheck to paycheck.
The chart below illustrates the late-recovery bounce in wages for retail workers (a proxy for lower-income earners).
Lenders and issuers adjust with the cycle
Borrowers aren’t the only group that influences loan performance. Lender and issuer trends vary throughout the economic cycle, which can affect credit patterns. But these aspects of subprime auto ABS get much less attention than the consumer angle.
In the middle of the cycle, as the benefits of monetary stimulus spread, lenders tend to “broaden the credit box.”
This means extending capital to non-prime borrowers. For the current cycle, this happened from 2015 into the first half of 2017. As the share of higher-risk borrowers grows, increased delinquencies and losses typically follow with a lag, which we saw in 2017 and 2018.
This latest rise in delinquencies and losses got plenty of media coverage. What got almost no attention were efforts by lenders to account for higher anticipated defaults and delinquencies. As the credit cycle matures, subprime lenders adopt more conservative underwriting practices. These lenders are credit specialists who price loans (by setting appropriate interest rates) to reflect late-cycle risks and cover anticipated future losses.
Asset-backed securities themselves also prepare for expected negative events with high levels of credit support.
This includes measures like excess spread—or the difference between the interest an ABS deal takes in and what it pays out to investors. For ABS investors, this extra capital is the first line of defense against losses.
Where we are today
Though headlines focus on the downside, auto loan quality is actually up on the whole. The Federal Reserve has commented on this, saying: “… the overall auto loan stock is the highest quality that we have observed since our data began in 2000.”[1] That said, I am always watching for risks. Right now, I am monitoring how pressures like rising rents and healthcare costs could affect subprime borrowers over time.
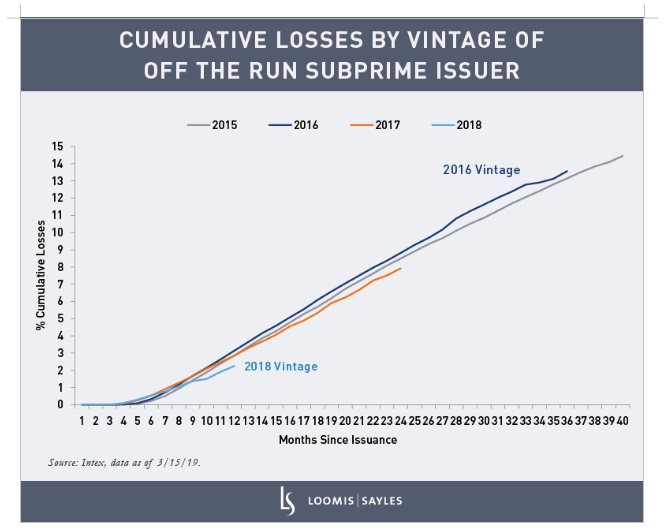
The chart below sums up subprime ABS throughout the cycle. It shows the impact of prior changes in underwriting practices (first loosening credit from 2015 through early 2017, and then tightening credit) and the recent benefits of stronger income growth among subprime borrowers. In fact, as wages rise, losses for the 2016-2017 vintages and recent ABS deals are improving. The shift to more conservative underwriting also appears to be underway, and I believe this will meaningfully impact future delinquency and ABS credit performance.
Fundamentals, not fear
It’s important to remember that subprime lending has not always had a negative image. It was originally heralded as the “democratization of credit,” extending capital to a new demographic of borrowers. But a broader borrower base brings with it more delinquencies and defaults. When the statistics look scary, investors shouldn’t lose sight of fundamentals. I think borrower health, and lender and issuer behavior are a much better yardstick for investors trying to determine how subprime auto ABS measures up.
While this is one opinion from one analyst, at one company, it is important to know that this is a company that has been around since 1926 and currently manages approximately $250 billion in assets across four different types of investment vehicles. They have been trading the fixed income markets for over 25 years. So, it is critical for them to get things right with respect to their own business interests.
China Trade Talks
While the Federal Reserve, India-Pakistan and sub-prime auto loans may not be getting many headlines from the various financial news channels, not a day seems to go by without something about China trade talks flashing across the screen (we keep the volume on mute to preserve our sanity as well as objectivity). It reminds us of an old Brady Bunch episode when the middle sister complained that all anyone ever spoke about was “Marsha, Marsha, Marsha.”
Our position on China remains the same. Economically, the tariff tussle hurts them more than it hurts us and that will lead to some sort of compromise deal that will be better than what we have in place today but will be short of the goal of a world of free trade. President Trump will meet with China’s Vice Premier Liu He as speculation grows that negotiations over a trade deal between the world’s biggest economies are entering the final stages.
We have learned from experience that it is unhealthy to hold our breath over these reports but, given Wall Street’s penchant for buying the “Devil you know”, if a deal is signed, regardless of its quality, it will be another speed bump removed from the current upward trend.
We Understand
If you’ve been reading our quarterly missives for a while, you can see that we never run out of things to keep us awake at night. We know that someday, there will be another recession and when that recession comes,
- Unemployment will rise.
- Government safety nets won’t prevent widespread hardship.
- Safety net spending will scare bond market investors.
- Interest rates will rise.
- Economic problems will get worse.
- The Fed and the federal government will quickly run out of policy tools.
We also know that the recessions in our lifetimes began with a triggering event:
- 2009 Great Recession:
Collateralized Mortgage Debt
- 2001:
Dot.com bubble burst + ENRON
- 1990 RECESSION:
Oil shock (we went to war in the Middle East)
Junk bonds (a financial innovation from Wall Street at the time which was born from Michael Milken’s realization that arranging lending to companies with miserable credit ratings was a lucrative strategy for Drexel Burnham but which proved to be less lucrative for the actual lenders)
- 1980-82:
Oil shock / Iranian revolution (oil was a much bigger part of our economy and we didn’t have hybrids or the level of US production that we have now)
Inflation (never fully cured from the early 70’s when we left the gold standard)
We can go back: 1973 (war + oil crisis + no gold standard). 1969 (Vietnam), etc., but the point is that recessions don’t just happen out of thin air, so we keep our eyes on the horizon and look for things that could cause our economy to reverse course.
In the meantime, there will be fluctuations in the market as fear continues to scare people into a run for the exits.
We continue to position our investments into strategies that take advantage of pull-backs and we constantly research and test ideas that would not only take advantage of pull-backs, but also add additional protections in the face of an eventual recession and the possible bear market that could accompany it.

