May You Live in Interesting Times
It’s amazing how quickly things can change, and it reminds us of why we maintain the investment philosophy that we do.
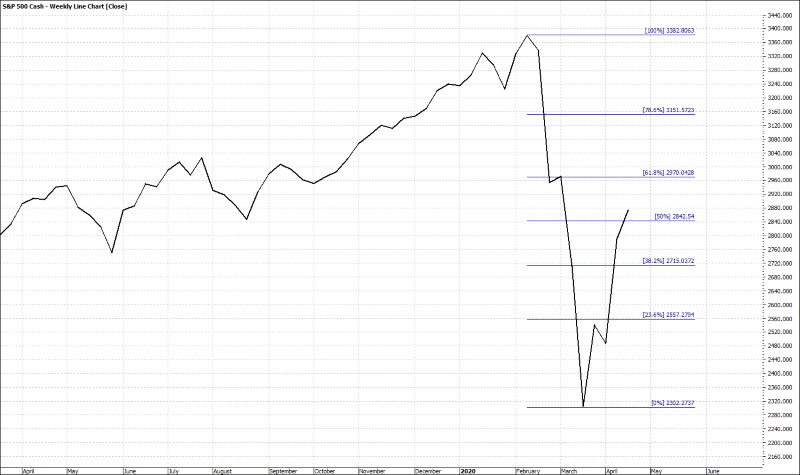
On March 31st as the final bell rang, we closed the doors on the first quarter of 2020 – that saw the worst performance since 1987. In what will likely be remembered as a stunning blow in the history books, the Dow Jones Industrial Average ended the day down 1.8%, bringing the total 1st quarter performance to negative 23%. The S&P, Nasdaq, and Russell 1000 indexes didn’t fare much better, ending the day down 1.6%, 0.95%, and 0.45% and down 20%, 14%, and 31% the quarter, respectively.
This is in complete contrast to the first 5 weeks of the year when all of the indexes were making new highs in what seemed like an almost daily occurrence. As the year began, the indexes were well ahead of themselves and well ahead of all the trend lines, yet they wouldn’t back off, they wouldn’t come back to the average. Daily moves of up another 1% seemed to be the new norm. The rally of 2019 that saw the markets advance better than 30%, kept on going into the new year as the economy, even in the face of trade wars and impeachment, continued firing on all cylinders.
Then, because of a virus that was born and spread across the world before anyone acknowledged it, the world came to a “full stop.” The global economy was thrust into a manufactured recession as governments around the world brought whole countries to a standstill forcing a recession that is yet to be defined but one that is sure to be sharp and deep, wreaking havoc in every nation on Earth.
Making matters worse, the computerized trading systems that we lamented about in our last letter exaggerated every move in the market. Headline-based systems would kick into sell mode even prior to the market open and triggered technical trading systems creating a cascading domino effect.
What would have been a 1% move turned into a 2% move, a 4% move into 8%, etc. Our experience over many years has taught us that floor traders typically regard daily moves of as much as +/- 4% to be within the normal range of volatility. But when they see moves greater than 5%, they take notice and more importantly, take action, thus compounding the impact of these computerized systems.
As we wrote to you, we don’t see this new world of “algo-trading” changing, certainly not in the near future. This will likely make many short-term and swing-trading systems rendered useless, while testing the nerves of even the most dedicated long-term investors.
During quarters like this, two well-known quotes come to mind as we watch the gut-wrenching market volatility wreak havoc with our account balances:
“Everyone is a genius in a bull market” – author unknown, and;
“[Be] fearful when others are greedy and greedy when others are fearful.” – Warren Buffett
We enjoyed several phone conversations and emails from you during this volatile period telling us how, at some other time in your lives, market action like this would have kept you awake at night worrying about what the next day would bring.
Believe me, we were right there with you until we took a more strategic look at what we were doing with all that investment capital. As soon as we realized that we were managing our personal investing very different from the way we managed our business, a light came on in our heads and a different path to build wealth became much clearer and less stressful.
Here are two charts to ponder
The first is Warren Buffett’s “investment account”, better known as Berkshire Hathaway, as of the week of 3/20/2020:
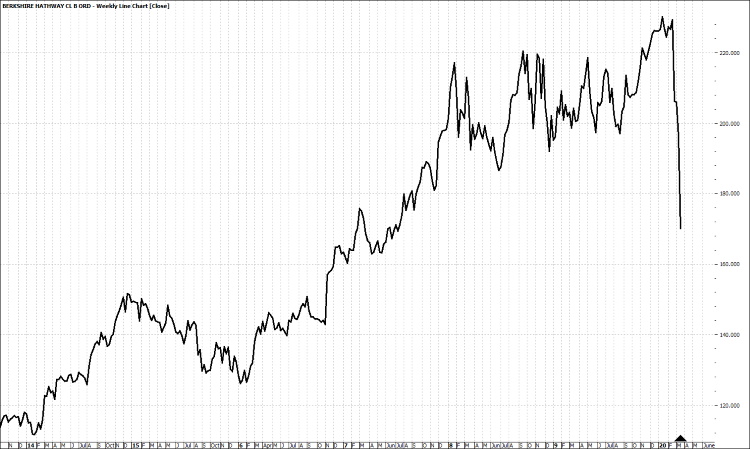
Figure 1 BRK,B Weekly Line Chart 3/20/2020
As you can see, Warren’s account was now back to where it was back in 2017 as, very quickly, all his market gains were wiped away in the panic selling of the last few weeks. At the end of 2019, Berkshire’s stock market portfolio was $248 billion. By March 23, the value of Berkshire’s share of the top 10 publicly traded holdings was down by as much as $83 billion.
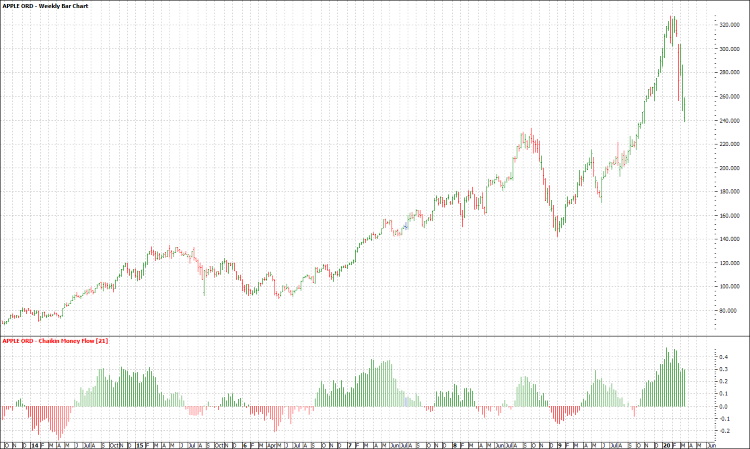
Berkshire’s stakes in Apple (Nasdaq: AAPL), Coca-Cola (NYSE: KO) and Delta (NYSE: DAL) fell by an average of 43% between February 20 and midday on March 23. Berkshire took a $27 billion hit on its Apple stock alone. Delta’s shares fell by an astonishing 63%.
The value of Berkshire’s Bank of America (NYSE: BAC) stock fell by $15 billion.
Now, here is a second chart from Macrotrends.net, taken the same day, which shows the growth of revenues happening inside Warren’s account.
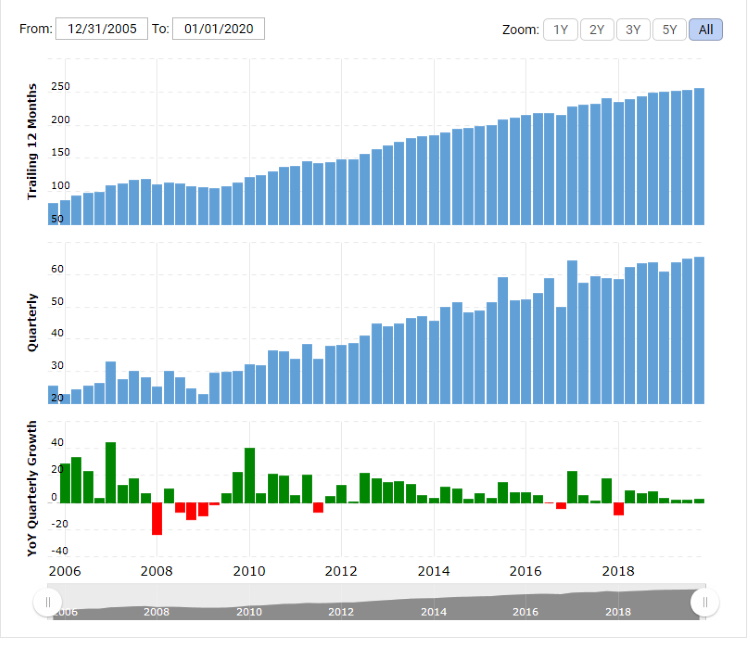
Figure 2 Berkshire Hathaway Gross Revenue 12/31/2005 – 12/31/2019
The question, as an investor, is which chart is more important to you?
Warren Buffett began his investing career using value-based criteria to purchase any and everything that was “on-sale” with the intent of quickly unloading them for a capital gain. According to the book “The Snowball: Warren Buffett and the Business of Life” (which is available as a free PDF if you search hard enough!), this strategy worked well until it didn’t, which becomes very frustrating when you’re trying to make a living trading the market.
Over time, with the help of his long-time partner Charlie Munger, Buffett discovered the advantages of investing in outstanding businesses like See’s Candy and Coca-Cola, businesses with durable, competitive economics—a moat—and rational, honest management. Companies that rewarded shareholders with a steady and often increasing stream of distributions, either through the “management fees” he took from the businesses he fully owned, or the dividend distributions from those he was just heavily invested in.
In the latest Berkshire Hathaway letter to shareholders, which we faithfully read every year, we see that in 2019, Berkshire’s top 10 holdings paid the company $3.8 billion in dividends. Of those 10, Apple, Bank of America, Coca-Cola, and Wells Fargo (NYSE: WFC) accounted for three-quarters of that $3.8 billion.
In 2019, Berkshire received a total of $15.6 billion in dividends and distributions, which accounts for 65% of its operating earnings. It repurchased $4.9 billion of its stock, all paid for from the dividends it receives.
Critics who point out that Berkshire (NYSE: BRK.A, BRK.B) shares have underperformed the S&P 500 over the last 5 years are sadly missing the point. As stated above, Berkshire Hathaway is first and foremost Buffett’s investment account, similar to our IRA’s, 401K’s and the like, and; he uses his investment strategy to provide for his annual income as well as pay for all of the people and services he now requires to manage such a large “account.”
In other words, Buffett doesn’t have to sell shares of Berkshire Hathaway for cash to pay his bills, instead he relies on the distributions from the investments within the account to do so and he is one of the best at doing this. He has effectively insulated himself from the volatility that we just experienced. In fact, he took advantage of the situation, buying 976,000 shares of Delta Airlines that other panicked investors were more than happy to sell to him.
Buffett actually has two full time portfolio managers on his payroll, Todd Combs and Ted Weschler and many of the new investment selections are made by these two individuals as they are free to manage billions of dollars’ worth of capital without much oversight by Mr. Buffett nor by Charlie Munger.
So as long as Buffett’s personal and business objectives are being met (and as you can imagine, the two are quite tightly intertwined), we doubt that he gives much thought to what the market has done to his net worth or whether he really beats the market indices on any given day, or even any given year.
Much of the investing world is reeling right now from the shock of the coronavirus-induced sell-off. Yet we’re betting Buffett is thanking his lucky stars.
Which brings us back to our view on investing and growing wealth. Cash flow is king, we simply can’t spend a rate of return. Therefore, we must look to using cash flow to manage our retirement income. If we are invested in a well-diversified portfolio of income-producing investments, including an allocation of stocks that have historically increased their dividends on a regular basis, and are planning on living off of distributions from that portfolio, a market sell-off shouldn’t mean anything other than that those distributions/dividends just became more valuable in what is now an ultra-low interest rate environment.
In his book “Get Rich with Dividends.” Income Strategist Marc Lichtenfeld discusses how a bear market can be your “best friend.”
“If you are investing for the long term and reinvesting dividends, your dividends can now buy shares 30% cheaper than they could last month – and in some cases, even more than 30%.
As I’m fond of saying, that means your dividends buy more shares, which generate more dividends, which buy more shares, which generate more dividends and so on…”
As much as it hurts to look at, we really should not care if the principal is up 20% or down 20%. And, if you are still reinvesting your dividends, as many of us are, you’re suddenly enjoying an even higher yield with every dollar reinvested, and remember that those reinvestments are occurring all the time without the need for additional funds being transferred to your account.
Does this mean that we totally ignore growth or speculative opportunity stocks? Of course not, even Buffett owns a few stocks that pay no dividend at all including Amazon (NASDAQ: AMZN), Charter Communications (NASDAQ: CHTR), Verisign (NASDAQ: VRSN), Davita (NYSE: DVA), United Continental (NASDAQ: UAL), and a few other smaller positions.
But, if these stocks do not pay a dividend, he must rely completely on their price action in order to benefit from these investments. Quarters like this last one are reminders of why we don’t want that to represent the largest component of our strategy.
We understand that this philosophy can be frustrating to some, especially to those who receive the seemingly non-stop barrage of emails from “legendary” traders and hedge fund managers whom we’ve never heard of, promising:
“3 Techniques to Help You Capture the Trades of a Lifetime”
“How to Potentially Double Your Net Worth”
“The Stock of the Century – Buy This Stock RIGHT NOW!”
Our challenge is the day to day monotony of holding good companies and having the distributions automatically reinvested as they come in. We have no hot stock to talk about at the club, or chatting with the neighbors (six feet apart, of course!), and usually no explosive market gains over short periods of time. Instead we have a slow, boring grind higher and higher of investment income, almost like watching paint dry, that still doesn’t fully shield our account balances from the type of volatility that we saw this quarter.
This is, of course, the reason why we send a projected cash flow report each quarter along with a traditional performance report. We believe that over time, the two reports provide proper perspective in reviewing the progress toward your personal financial goals.
With that, let us look more in depth at what shook the markets this quarter as well as a look as to what may keep them in a state of volatility through the year.
Coronavirus / The Economy; The Mandated Recession
A few months ago, no one had ever heard of coronavirus. But now, it is the only thing people are talking about, our kids and grandkids will talk about the “Great Coronavirus Shutdown” the way that our parents and grandparents spoke of the great depression.
The U.S. government, along with the governments of almost all afflicted countries in Europe and Asia, determined that the only way to slow this pandemic was to severely restrict movement and economic activity even though that meant they would trigger a recession. School classes, and theaters are closed and sporting events, conventions and concerts throughout the U.S. are being canceled. The business and vacation travel industry has been shuttered. The Summer Olympics have been postponed.
People have sold stocks en masse, Costco’s are still getting picked clean (especially for toilet paper), and the Fed has made dramatic moves including cutting rates basically down to zero.
We won’t waste ink presenting the current numbers to you, first, because by the time you read this they will have changed, and; secondly, we know that you are very informed and as up-to-date as we are on matters like this.
We continue to struggle with both the reporting of data as well as the projections that have been published. Only history will tell if this is an overreaction or prudent crisis management.
By late February, China, where this all started, had already started ramping back up their manufacturing and technology sectors as, if we can believe them, the spread of the virus is now “under control.” Were they caving to economic pressure, or did the virus run its course due to the extreme measures taken? Several articles we have read stated that instead of trying to enforce anything nationwide, the Chinese started isolating pockets of high concentration versus low concentration thus allowing the low concentration areas to begin a path back to economic normalcy.
Here in the U.S., we are still maintaining a one-policy-for-all nationwide approach with nearly every state at some level of “stay at home” orders, even though the data shows that currently 80% of total cases and new cases are concentrated in 10 States (50% of total cases are located in New York and New Jersey). By comparison, our home state of Wisconsin has only reported 1,351 total cases, and even our temporary home state of California is reporting ½ the cases of New jersey, mostly concentrated in the major urban area of Los Angeles and San Francisco.
One of the few positives that we have seen just recently is that the number of recovered / discharged cases have now exceeded deaths in the U.S. This has been an early indicator in most of the countries that are now starting to resume “normal” activities (if you can believe them).
The other thing that is too soon to tell will be the economic fallout from a government-forced recession. We really have nothing historically to go on.
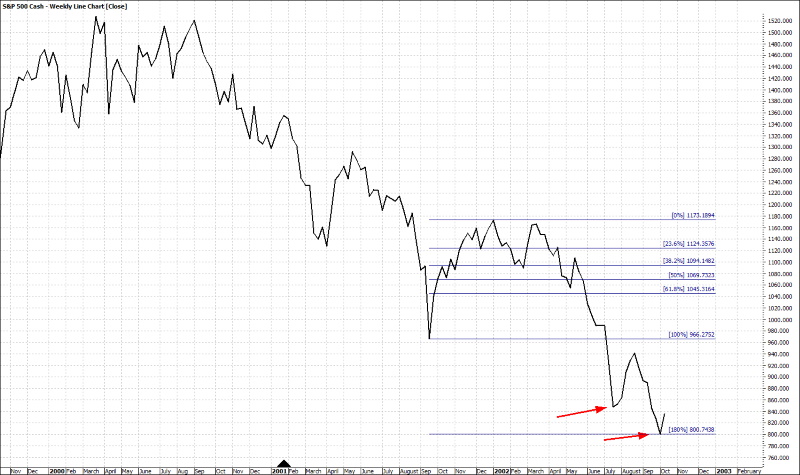
The Crash of 1929
By almost every measure, the stock market crash of 1929 was the biggest and most devastating crash in world history.
It occurred after nearly 10 years of economic expansion from 1919-1929 (the Roaring Twenties). This was a decade of steady, dramatic growth that created a sense of irrational exuberance among investors who were happy to pay high prices for stocks and leverage those investments by borrowing money to make them.
By August of 1929, word was getting out that times were changing. Unemployment was rising. Economic growth was slowing. Stocks were overpriced, and Wall Street was hugely overleveraged.
On October 24, the market dropped. It dropped again on the 28th. And by the 29th (Black Tuesday), the Dow had dropped 24.8%. On Black Tuesday, a record 16 million shares were traded on the New York Stock Exchange in one day. Investors, many of whom had put everything into stocks, collectively lost billions of dollars.
Twelve years of worldwide depression followed, and the U.S. economy didn’t recover until after World War II.
The Crash of 1987
Like the crash of 1929, the crash of 1987 occurred after a long-running bull market.
On October 19 (Black Monday), the Dow dropped 22.6%, and, in percentage terms, it’s the biggest one-day drop ever.
Theories behind the reasons for the crash included a slowdown in the U.S. economy, a drop in oil prices, and escalating tensions between the U.S. and Iran. But the financial reasons were similar to those of the crash of 1929: speculators paying crazy prices for overpriced stocks and purchasing junk bonds leveraged mostly through margin accounts.
On top of that, something new was happening: computerized trading. It made selling easier and faster and accelerated the sell-off.
But unlike the crash of 1929, Black Monday didn’t result in an economic recession. In fact, the market began strengthening almost immediately and led to a 12-year bull run.
The Dot-Com Bust of 1999-2000
In the 1990s, access to the internet started to shape people’s lives. Easy access to online retailers, such as AOL, Pets.com, Webvan.com, Geocities, and Globe.com, helped drive online growth. It also gave investors a huge opportunity to make money.
Shares of these companies rose dramatically. In most cases, prices soared far beyond intrinsic values.
In March 2000, some of these companies started folding, and investors shed tech stocks at a rapid pace. The tech-focused Nasdaq fell from 5,000 in early 2001 to just 1,000 by 2002. Paper-gains, many of which were made with borrowed money, as investors flocked to buy any stock that had “.com” in their name were wiped out.
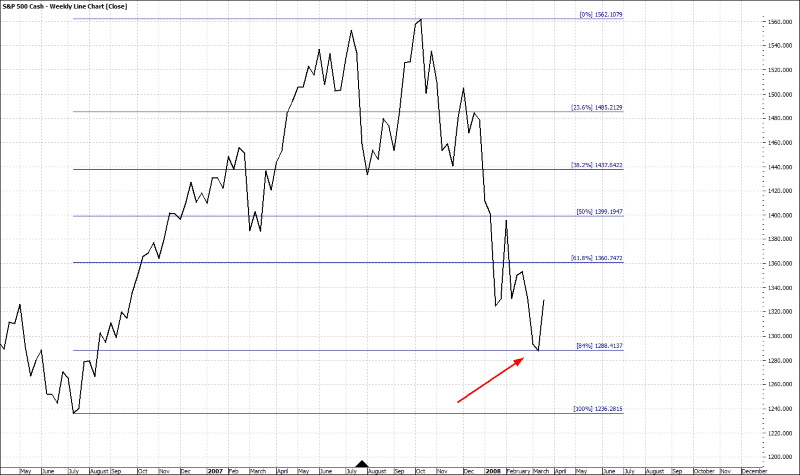
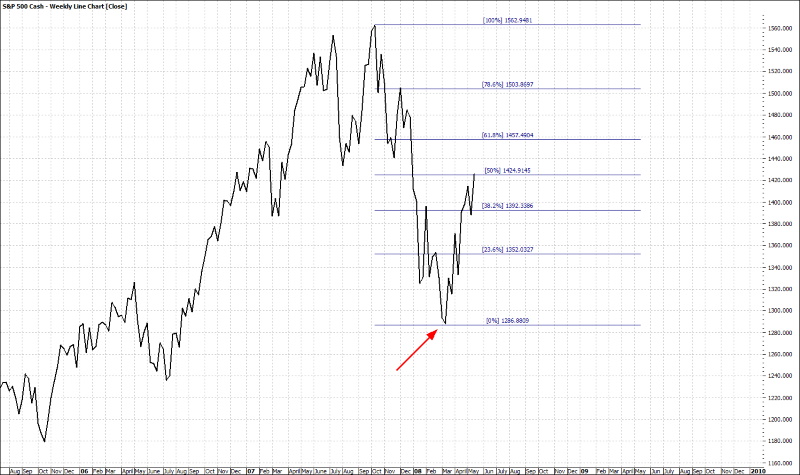
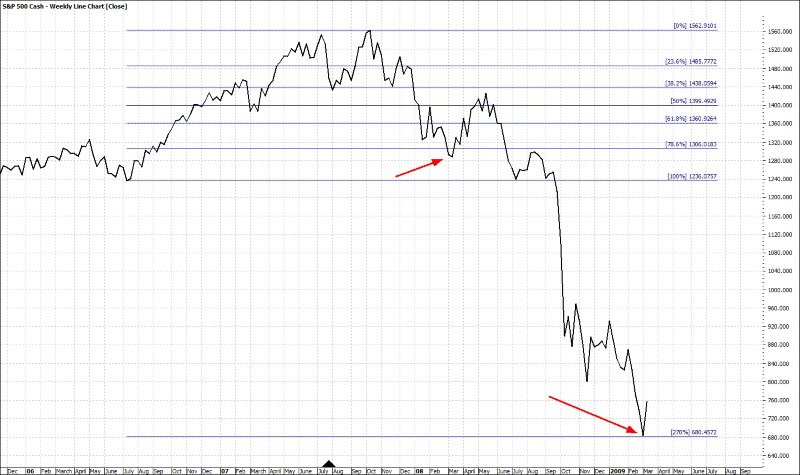
The “Great Recession” Stock Market Crash of 2008/2009
Besides the crash of 1929, the crash of 2008 was in many respects the most serious financial collapse of the last 100 years. Many investors don’t realize how close the U.S. financial sector came to completely unravelling.
Like every crash mentioned, this one followed a long-term bull market (from 2002 to 2007). Also like the others, it was instigated by speculation. Not so much by speculation in conventional stocks, but by the widespread use of mortgage-backed securities in the housing sector.
These products, which were sold by financial institutions to investors, pension funds, and banks declined in value as housing prices receded.
And we all remember what followed. The bursting of the U.S. housing bubble and Lehman Brothers’ collapse nearly crushed the world’s financial system and resulted in a damaged housing market, business failures, and a wounded global economy.
But none of the four major stock market crashes permanently damaged the U.S. economy. In every case, the markets climbed back up and then went on to new highs.
The duration of those downturns varied. The 1929 crash was the slowest to recover at 10 to 12 years. (Depending on how it is measured.) It took seven years for the market to fully recover from the crash of 2008. And the crash of 1987 began recovering after a few months. Even where full recovery took years, the upward trend began in months or just a few years.
All of those crashes happened because of a combination of economic imbalances, flaws in the banking and financial sectors, a period of manic investing that brought market values to unrealistic heights, and panic. In other words, they were caused by economic and financial crises.
The current crash was precipitated by a health crisis. In stock market language, that’s considered an event-based crash.
Past health scares have shocked the market, too. In 2013, for example, the MERS outbreak caused the market to drop by 6%. And in 2003, the SARS outbreak caused a worldwide panic, taking the market down by 14%. But both of these event-driven crashes were followed quickly by a surge back to past highs and then beyond.
The real risk here, is that, unlike our response to these prior events, deliberately shutting down the economy may create a financial crisis that never would have happened had the response been more measured. If, like China (if we can believe them), other countries can start ramping up after two months and not suffer a second wave of infections, confidence can be restored, and we can start moving to a phase of restoration.
However, if China sees a sudden increase in caseloads (and actually reports them) requiring a second shut down, it will likely mean an extended shut down here in the U.S. rendering all assumptions useless.
Of course, even in the best-case scenario for the virus, we have other issues that we need to keep an eye on.
Oil
March 8, 2020 – (Bloomberg) Friday’s gathering of oil ministers from the Organization of the Petroleum Exporting Countries and their international allies broke up in disarray. The collapse of talks reveals deep divisions over how to deal with the slump in oil demand triggered by the spread of the Covid-19 virus.
According to the article referenced above (and several others), Saudi Arabia demanded that Russia share in a proposed reduction of a further 1.5 million barrels a day, insisting that OPEC wouldn’t reduce supply without the support of non-members. Russia refused.
The meeting was not just about making a further output cut. It was also meant to ratify an extension of the current agreement between the 20 nations to remove as much as 2.1 million barrels a day of oil from the market. That deal, reached in December, expired at the end of March, leaving members free to pump as much as they wish from April 1.
In response to the failure to agree on output cutbacks, state-owned oil monopoly Saudi Aramco, slashed its price for its flagship Arab Light crude by the most in 20 years. This was interpreted as a signal that it may try to push as many barrels into the market as possible. On that news, oil markets dropped precipitously, sending crude oil futures down to the high-twenty / low thirty dollar per barrel price range.
One reason posited for Russia refusing to play ball may be disagreement over how best to deal with a sudden sharp, but temporary, drop in oil demand. By allowing oil prices to fall, the Russians may be hoping to spur demand. It’s difficult for us to see lower prices having much impact on consumption though, when factories are closed, airlines are slashing flights, and roads are emptying.
Cheap oil won’t ease fears of the Covid-19 virus. But it may encourage countries like China and India to build up their strategic stockpiles. Both are creating buffers along similar lines to the U.S. Strategic Petroleum Reserve to protect themselves from any future supply disruptions. China already seems to be pouring vast amounts of crude into storage tanks and underground caverns.
But there is also a bigger geopolitical dimension to Russia’s withdrawal from the output-cutting pact, just as there was to its joining. Participation served President Putin’s ambitions to rebuild Russia’s influence in the Middle East. Withdrawal is aimed at punishing the U.S. for its repeated attacks on Russia’s energy interests through sanctions, which have stifled Arctic offshore exploration and shale development, prevented the completion of a gas pipeline to Europe under the Baltic Sea, and targeted the Venezuelan business of Russia’s state-oil producer Rosneft.
Since the initial shock, we have seen prices continue to fall to a low of $19.95/barrel as the virus-crisis and price war continue.
Now some are suggesting that Saudi Arabia and Russia are trying to kill off the US oil shale industry with a price war in an attempt to take back control of the oil markets. Will it work?
Saudi Arabia led OPEC in a war on shale in 2014, when it introduced the pump-at-will policy. It failed then, capitulating as oil prices collapsed a year later. But U.S. producers from Exxon Mobil Corp. to Continental Resources Inc. are already being hammered by a drop in demand and now may be a more auspicious time to launch an attack.
Even if it fails again, Russia intends to make sure that U.S. oil companies share the pain of the collapse in oil demand. Saudi Arabia appears willing to help it. The next few months could get ugly. While many oil producers learned their lessons from the last oil war, many of them are still too leveraged to make operations work at these price levels.
A string of failures would also hit the High-Yield Bond markets as much of their debt is rated below investment grade. Which brings us to our next concern.
Bond Markets
Going into the third week of March, the financial system was facing turbulence in the debt market with corporate and municipal bonds selling off in dramatic fashion. The federal Reserve managed to reverse the sell-off by announcing that they would provide a backstop for everything even to the point of direct purchases.
Now, the question is whether or not these actions will be enough to keep the market from selling off again. We don’t have an answer to that because the situation keeps unfolding in real time and is dependent on the issues raised earlier. What we do know is that central banks around the world have signaled that they will do anything and everything to keep the markets propped up, which includes the unlimited printing of money. Which takes us to our final, catch-all concern
The Aftermath
After seeing the initial policies extended until the end of April, we still have no answer as to when we will be allowed to go to a movie or eat in a restaurant (even the public beaches are closed). Neither do we know what the short or long-term impacts will be.
While we will be flying soon again, we don’t think we’ll be booking the Disney Cruise we had planned for the kids. So, we do not expect the recovery will be evenly distributed across every sector of the economy.
Will the federal Reserve’s actions finally induce higher inflation?
Back in 2009, we read and wrote about how all of the Fed intervention would produce Zimbabwe-like inflation, John Mauldin’s book “End Game” was always close at hand, fully dog-eared for quick reference as economic data poured in daily, weekly and monthly. A decade later, none of those prognostications came to fruition. Will this time be different?
Negative Interest Rates
Last week, the yields on the 1-month and 3-month Treasury Bills actually turned negative. Now if you’re borrowing money to buy a house or finance a car, low or even negative interest rates can be a great thing! It means you don’t have to pay as much in interest for financing whatever it is you buy.
But if you’re on the other side of that transaction, putting your wealth into a savings account or a money market fund, negative interest rates can be devastating. Because negative rates can deplete your savings while you’re doing the “smart” thing and setting money aside for later.
When you sell stocks in your brokerage account, your brokerage typically puts the cash from these sales into a money market fund. These funds invest in short-term treasury bills. And during normal times, these treasury bills pay you interest on the extra cash in your account.
But in today’s environment many more investment accounts are plowing more money into these money market funds, and institutional investors are also investing in short-term treasury bills. In some cases, these institutions are legally required to park their cash in these treasury bills, regardless of what price they must pay for the bills.
When this happens, all the buying pressure pushes the price of these treasury bills higher, and in a perverse twist of fate, prices for these bills actually rise above the amount that you’ll receive when the bills mature. In other words, you’re paying MORE to buy the bills than you’ll receive back from the government. So, you’re guaranteeing a loss when you invest in these bills or the money market funds that your brokerage puts your savings into.
Treasury bill rates also affect other interest rates that are important to savers, such as savings accounts and certificates of deposits (CDs).
If this situation persists, and we have no reason to believe that it won’t given the tantrums the market throws anytime the Fed tries to reverse the trend and raise rates, we will have to figure out exactly how your short-term and contingency savings should be invested.
Office Space
Talking not about the movie but the asset. After a month of “stay at home” my wife and the CFO of Sun Bum are beginning to need additional office space versus the current telecommuting situation. While there will always be a need for face to face interaction, much of our “cubicle time” really doesn’t need to be done in an office cubicle.
While this is a very small sampling, it is certainly something to look out for in the future. Having already seen what Amazon did to the suburban malls, we can’t help but wonder if another seismic shift could be on the horizon in the commercial office space market.
Of course, this is not all gloom and doom. We have already seen the speed at which biotech companies were able to shift resources to the virus. We could see many great opportunities appear in the entire health care value chain because of what is happening today in labs and hospitals. Along the same line as the office space issue, college students, along with their parents are realizing that they don’t have to actually be on campus in order to take many college classes. Could the on-line business degree become the norm instead of a snarky water cooler comment?
We could also see a resurgence in US manufacturing as people become willing to pay a little more for goods produced here, which could help rebuild the middle-class. There certainly seems to be a building political will to bring pharmaceutical manufacturing, at least, back to our own country.
All this is to say that, while things are always changing, all is not lost. This latest crisis will bring new winners and losers. It is our job to identify those trends as early as we can and then find the best investments that fit our investment income bias and put our capital to work, even if that means temporarily holding a little more cash during times like these.
As always, it is a great pleasure working with you! Please do not hesitate to call or email with any questions, concerns, or ideas you have and we will do our best to provide the answers and guidance you seek.
Read More