Why We’re Still not “All-In”
Everybody is asking if it is safe to get back in the market or, at very least, to add new money to the market.
The real answer, of course is that it depends on both your individual situation, and the purpose of the money you are investing. If you are a trader, then the answer is based on your particular strategy. If you are a long-term investor, then the answer should be based on the fundamental qualities of the holdings in your portfolio. If you are reinvesting your dividends, then you are possibly even sad that the market reversed so sharply before you could accumulate more shares.
Still it makes for interesting Zoom conversations as we muddle through the shut down and stay at home orders, we find ourselves in.
The truth is that no one, despite all the proclamations to the contrary can perfectly time the market and we would be wary of anyone claiming they can. What we can do is look at history and derive some possibilities based on what has been observed under similar conditions.
We prefer to look at more recent histories since the crowds trading those markets are likely made up of many of the people trading this current market.
One note before we get started, we use the concept of retracements when analyzing market moves, this differs from gains and losses in one very specific way. A retracement is a countertrend move that follows the path of (retraces) a portion of the previous trend.
For example, if we buy a stock at $50 per share and the stock price rises to $100, we have a 100% gain of $50 per share. If the stock then falls to a price of $75 per share, it has fallen 25% [($100 – $75) / $100}, however it has retraced 50% [$25 / ($100 – $50)]. See the difference?
Dot Com Bubble Bear Market
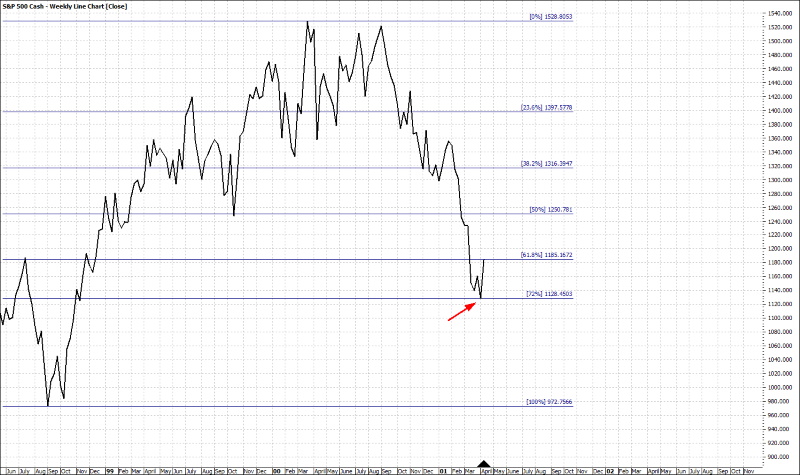
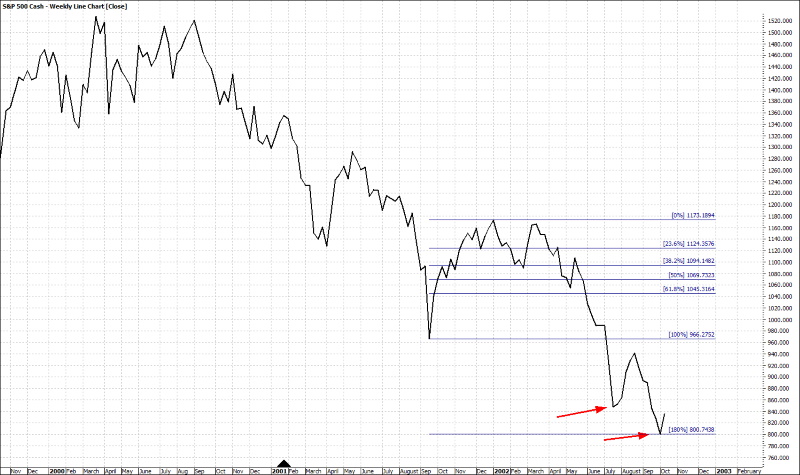
In April of 2001, the S&P retraced 72% from the most recent high reached after the pullback associated with the Long-Term Capital Partners collapse.
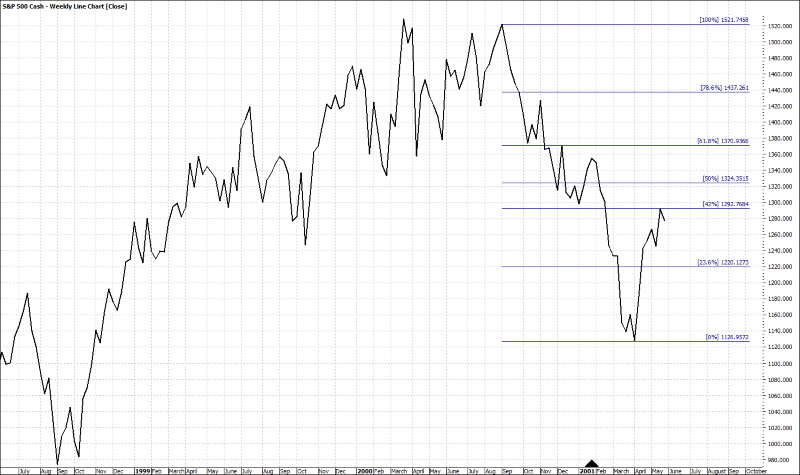
By late May, the market bounced back, with a retracement of the downward trend of approximately 40%, looking like it was signaling an “all-clear”, but it wasn’t…
The market reversed course and fell past the previous low to the 964 level by September 2001.
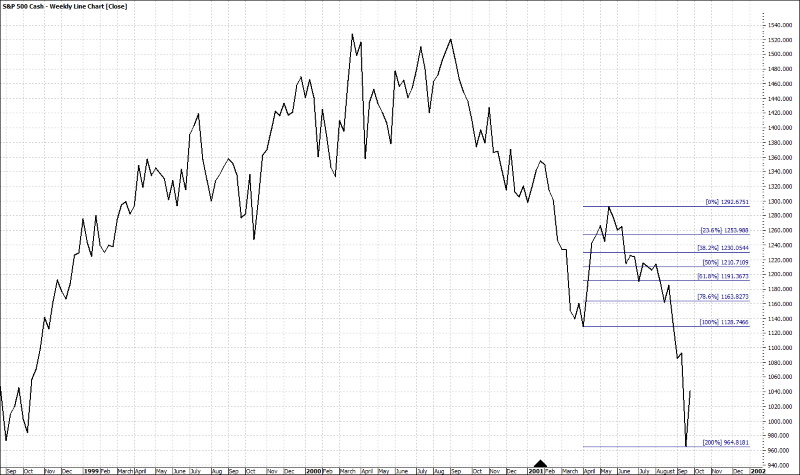
By December of 2001, the market had once again bounced more than 60% off the lows and, after testing the 1100 level, looked like it was poised for a run up:
Instead, once again the market reversed and headed back down hitting another false bottom in July 2002 before settling finally in September of 2002, falling nearly 50% from the high reached in March of 2000.
Housing Bubble Bear Market
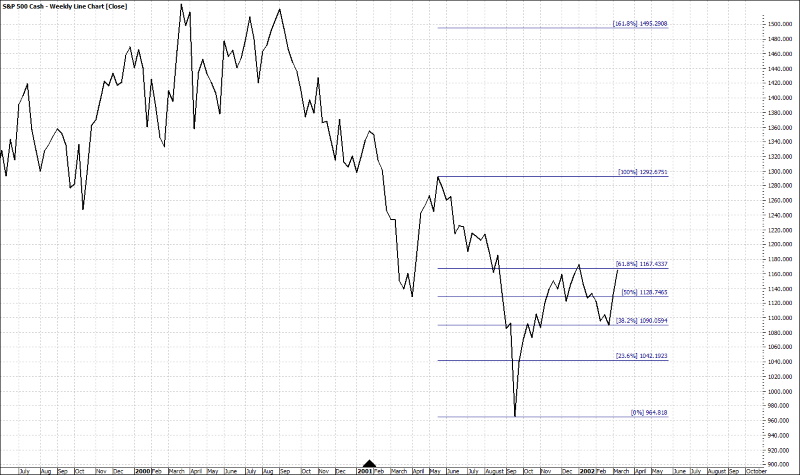
In March 2008, the S&P retraced 36% from the previous high of 1562 after an uptrend that had lasted about five years:
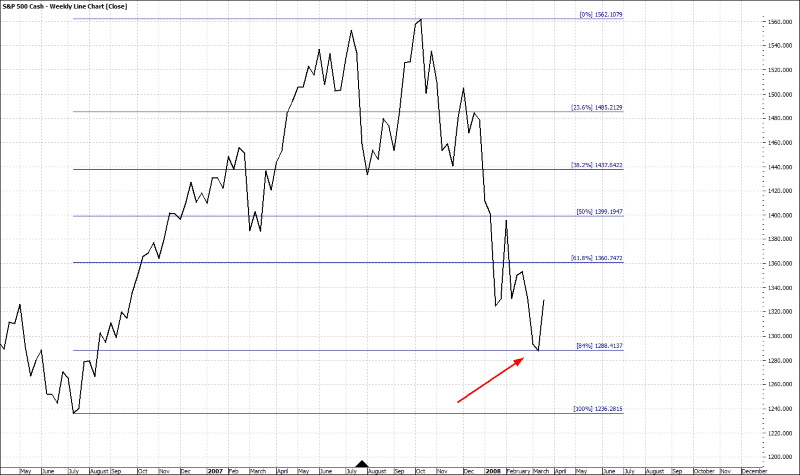
Within a couple of months, the market retraced 50% back up from the sell-off’s lows to the 1424 level …
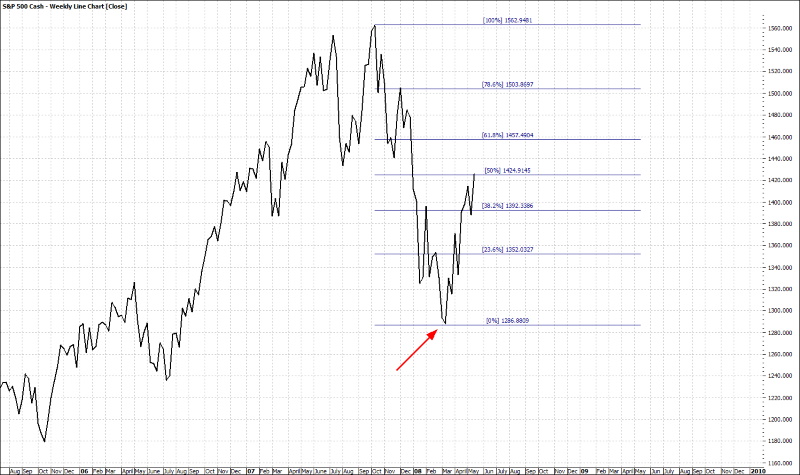
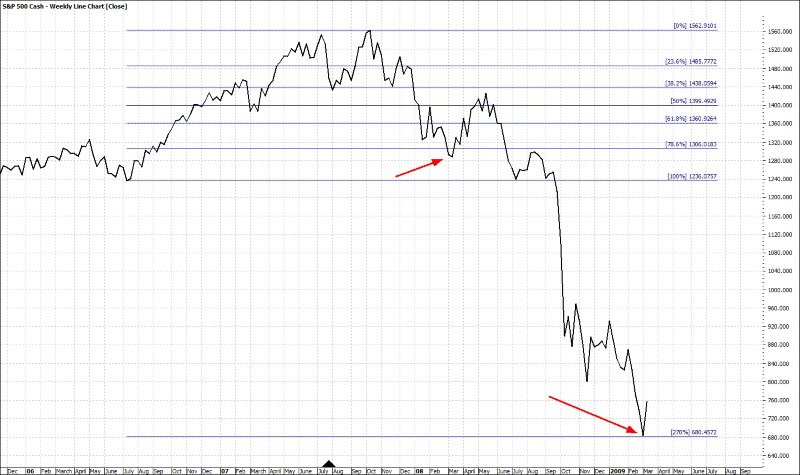
…only to quickly reverse and head forcefully down to the March 2009 lows of around 670; a drop of nearly 892 points or 57%:
Which brings us to today
While the markets have come back strong since the historic February / March plunge that erased 32% off the market from it’s all-time highs. However, the upward retracement is well within the range that we would expect for any countertrend, or “Bear Market Rally” based on what we have observed during the previous two bear Markets.
In addition, there are still too many things we do not know yet regarding the virus as well the economy and individual businesses.
The circumstances around the recent Bear markets are all different, this certainly is the first time we have ever seen a government-mandated recession and it is hopefully the last. However, the short-term trading patterns we observe seem to be similar enough to at least make one pause. In the long-term, the markets reward good businesses, in the short-term, it is based on herd-like fear and greed, exasperated today by the algo-trading systems that tend to exaggerate daily moves in both directions.
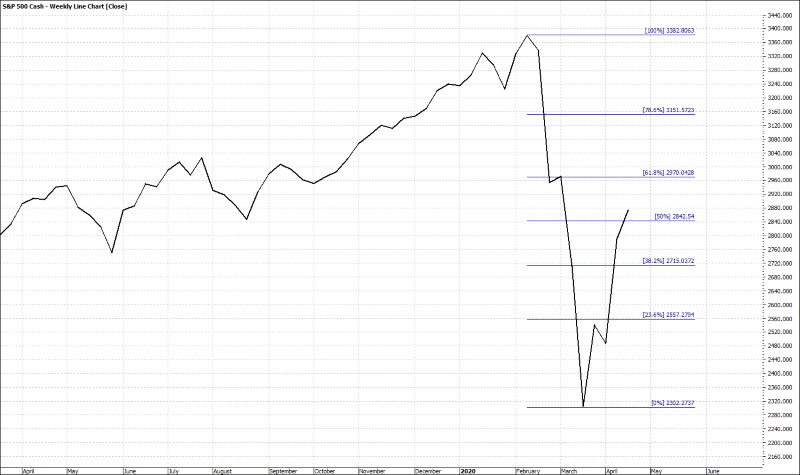
Until we see that counter-trend close and hold above the 3000 level, we would expect to see more down-side movement before this is all over.

