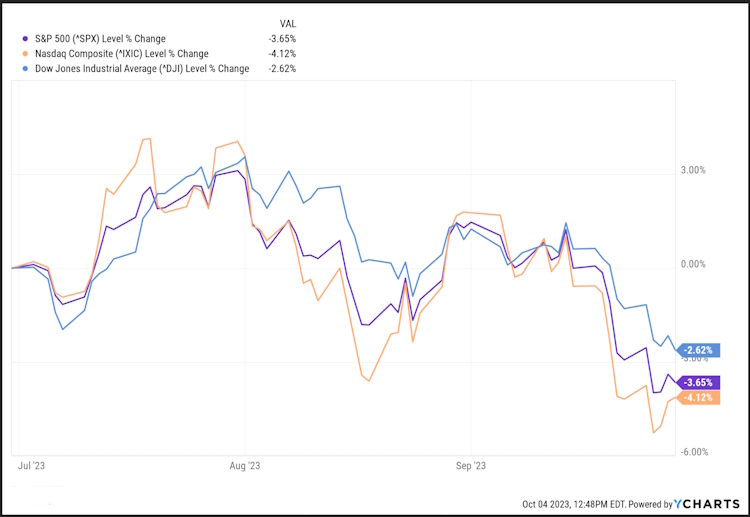
The third quarter saw the major indices give back some gains from the first half of the year with the S&P 500 falling about 3.6%, the Dow Jones dropping 2.6%, and the Nasdaq shedding 4.1%.
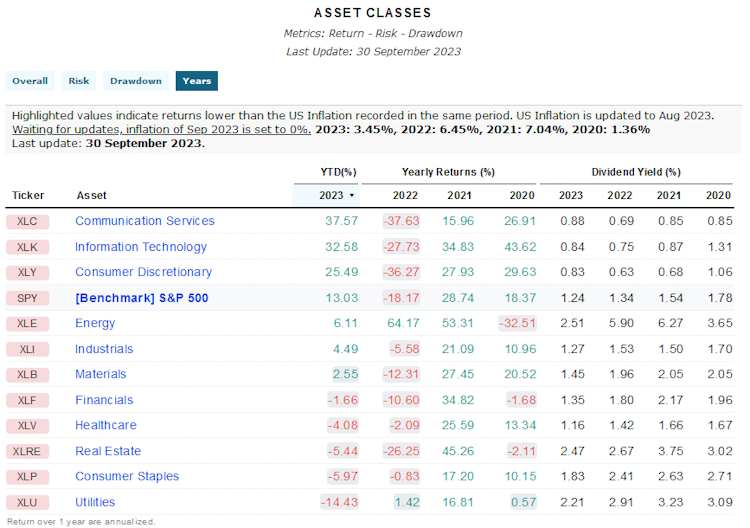
Looking at the S&P 500 sectors as represented by tradeable ETF’s, we can see how uneven the returns are so far this year, especially when compared to 2021 when we could find an up-trending stock using the Wall Street Journal and a dart.
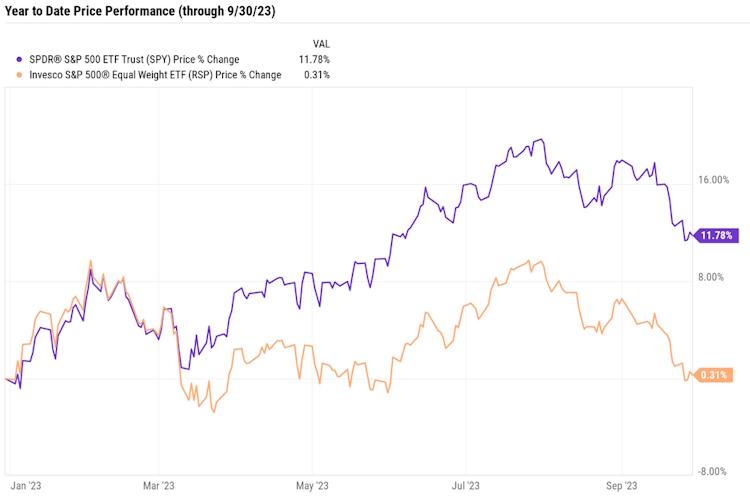
The S&P 500 Equal Weight Index – which holds an equal percentage weight (or equal dollar amount if you prefer) of each stock in the S&P 500 – briefly dipped into the red. As of the end of the quarter it was up 0.27% on the year. That means that if you had bought an equal dollar amount of each stock in the S&P 500 at the beginning of the year, you’d be about flat on a price basis. In the charts that follow, we’ve used the SPDR S&P 500 ETF and the Invesco S&P 500 Equal Weight ETF to represent the two indexes.
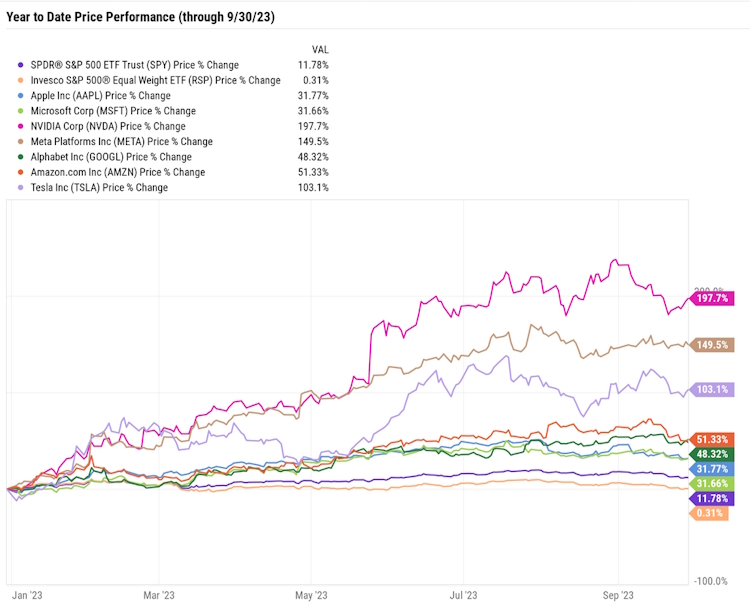
The overall market has been dominated by the “Magnificent Seven” tech companies since March – also referred to as the “S&P 7.” This includes Apple (AAPL), Microsoft (MSFT), Alphabet (GOOGL), Amazon (AMZN), Nvidia (NVDA), Meta Platforms (META), and Tesla (TSLA). All have huge market caps, and together they account for 27.3% of the S&P 500.
The artificial-intelligence (“AI”) boom led these tech-heavy companies in a massive rally through July.
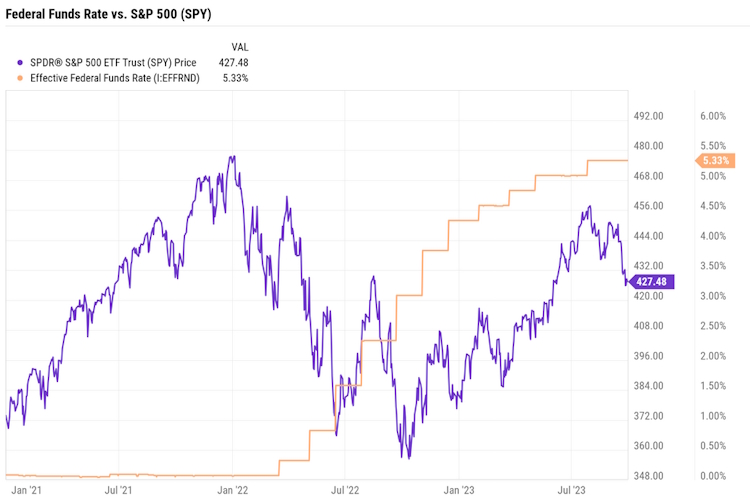
Bond yields have continued to surge as the Federal Reserve hints that rates could inch higher and that any rate cuts are not likely anytime soon.
On a fundamental basis, forty-five (roughly nine percent) companies in the S&P 500 index provided positive earnings per share guidance for the second quarter – the highest number since third quarter 2021. However, overall the S&P 500 companies reported a 4.1% decline in earnings year over year. This marks the third straight year over year decrease for the index. The top growth sector (as measured by earnings growth, not stock price) was Consumer Discretionary at 54%.
Looking at the most recent inflation data, the consumer price index (CPI) saw year-over-year gains of 3.0% in June, 3.2% in July, and 3.7% in August.
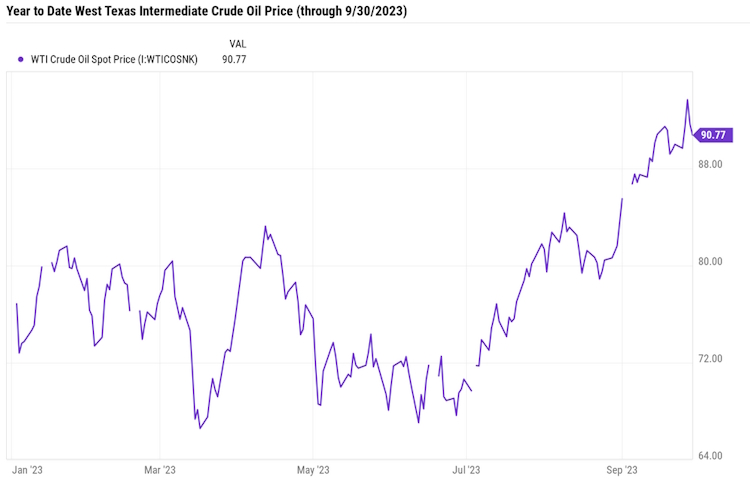
Oil, as measured by West Texas Intermediate Crude (WTI) rose above $90 per barrel in September after dipping below $70 in the first half of the year.
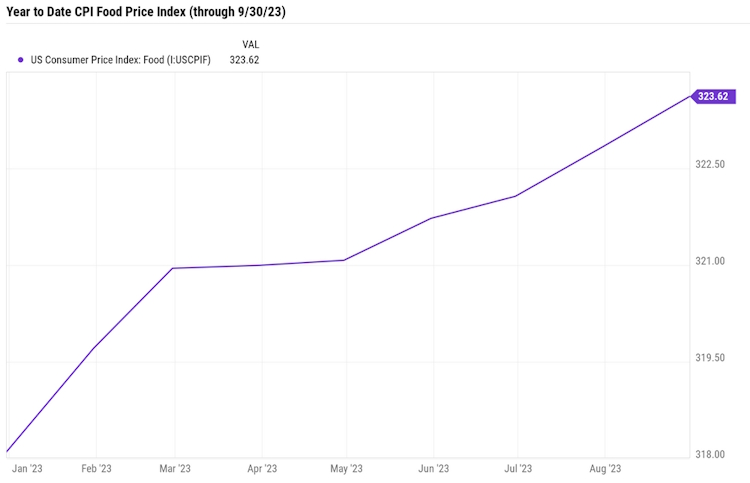
Food price increases also started accelerating in the 3rd Quarter.
Housing Affordability as measured by the US Composite Housing Affordability Index is at the current level of 92.70, down from 101.80 last quarter and down from 98.80 one year ago. Notably, the index is also at a new ten-year low.
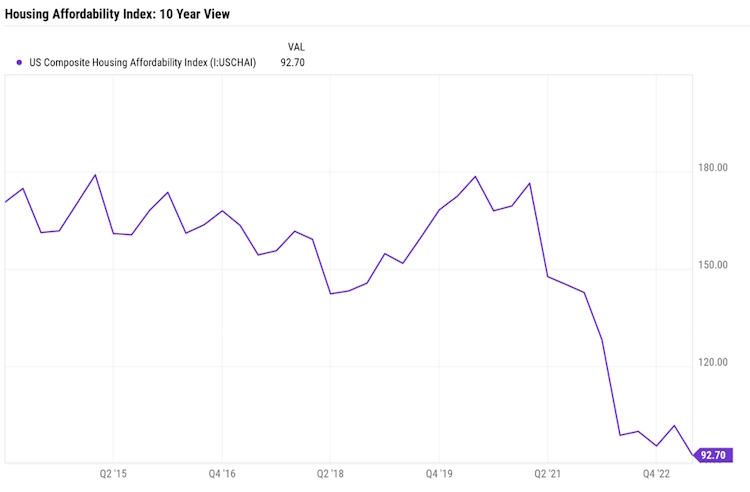
The index uses the value of 100 to represent the position of someone earning a population’s median income, with values above 100 indicating that housing is affordable and values below 100 indicating housing is unaffordable.
Of course, “professional economists” ignore the CPI headline data and look at CPI core (excluding food and energy) and super-core (excluding food, energy, and housing), which only makes sense if you can live without food, energy, and shelter. The truth is Americans spend most of their money on food, gasoline, home cooling/heating, and housing. Americans don’t pay for ‘super-core’ CPI. They pay headline CPI every time they go to the store or the gas station. A new analysis from Moody’s Analytics found consumers are spending $709 more on everyday goods in July compared to two years ago. One-third of all U.S. households spent more than 30% of their income on housing in 2021, according to recently released data from Harvard’s Joint Center for Housing Studies.
The “good news” is that the Fed’s most favored Inflation metric, the Personal Consumer Expenditures (PCE) Index, is registering inflation at 3.48% compared to 3.40% last month and 6.52% last year. The US Core PCE Price Index, which, like the Core CPI, also strips out food and energy, is up 3.88% year over year compared to
4.29% last month and 5.21% last year. It’s also the lowest since September 2021. That might be enough to reduce expectations the Fed will hike rates in November and ignite a short-term rally heading into the end of the year. So, the final quarter of 2023 could, through the Fed’s action on rates in November, be a tell-tale sign of what is to come for investors in 2024.
Inflation, Interest Rates, and the National Debt (The Song Remains the Same)
This headline says it all:
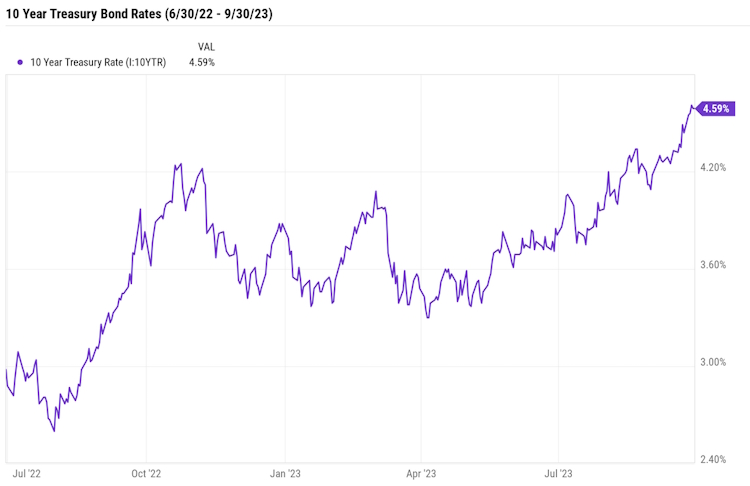
“Treasury yields near highest levels in more than a decade after hawkish Fed projections” and with that, the markets recalibrated again.
The Fed paused their rate increases for the second time this year. However, as has been the case before, it was Chairman Powell’s comments and the reaction of Treasury Bonds that set off a bond market decline. Looking at the chart below, on September 20th, the day of the announcement, the 10 Year Treasury Bond was sitting at a yield of 4.35%. Since then, the yield has climbed quickly to a 15-year high of 4.61% just before the end of the quarter and is now sitting above 4.70% and is most likely heading to 5.00% sooner rather than later.
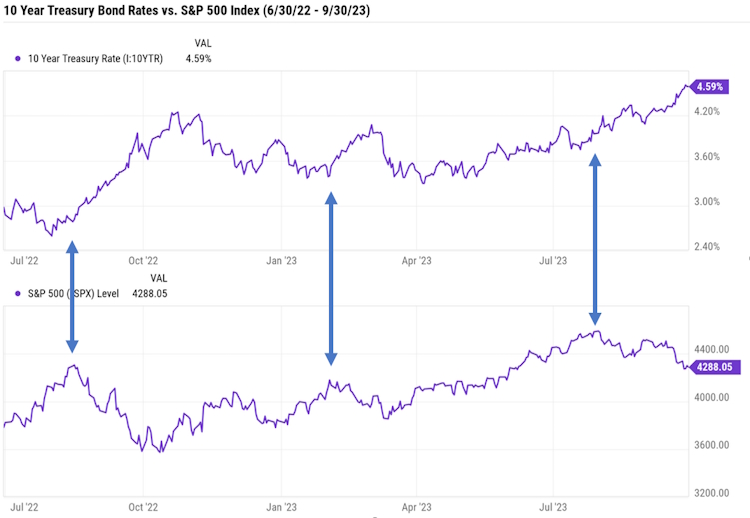
If we compare a chart of the S&P 500 for the same period, we get a striking visual of how sensitive the stock market is to interest rates, even on a daily basis (Note that last year’s stock market downtrend “bottomed” in October of 2022).
We all have “old sayings” that we like to bring out when the time is appropriate:
“A fool and his money are soon parted.”
“Don’t go broke trying to look rich.”
“All that glitters is not gold.”
There’s a saying in economics which we think is appropriate for the current environment:
“Once the inflation genie is out of the bottle, it’s hard to put it back in.”
The late 1960’s and 1970’s saw the inflation genie come out in full force. It was not until the Federal Reserve board, led by Paul Volcker, raised the federal funds rate aggressively that it was finally put back in the bottle. The Fed funds rate averaged 11.2% in 1979 and peaked at 20% in June of 1981. The prime rate rose to 21.5% in 1981 as well, which helped lead to the 1980–1982 recession and a national unemployment rate of over 10%.
The government bailed out Chrysler, and there were deep cutbacks at Ford after they suffered a $1.5 billion loss. At the time that loss was the largest ever by an American corporation (until Chrysler reported a $1.7 billion loss not long after). For perspective, Ford is now predicting a $3 billion operating loss for their Electric Vehicle operation in 2023 alone after a more than a $2.1 billion operating loss recorded in 2022.
The inflation we are experiencing today began as a “transitory” supply chain issue. It soon became enduring as government energy policies discouraged investment thereby driving up energy prices which impacted the cost of nearly everything. Eventually, you would expect these cost increases to decelerate either from a lessening of demand or by the introduction of lower cost alternatives.
In the meantime, however, another shoe is dropping, wage push inflation.
According to the Bureau of Labor Statistics, compensation costs (wages, salaries, and benefits) for civilian workers increased 4.5 percent for the 12-month period ending in June 2023 and increased 5.1 percent in June 2022. Other categories likewise showed increases of 3.5 to 5.5 percent.
More recently:
In August UPS workers ratified a labor deal that would, at the time, make full-time UPS delivery drivers the highest paid in the U.S.
Airline pilots have approved labor contracts this year with pay raises ranging from 34% to 40% over four years.
The UAW is currently on strike against all three of the major unionized car makers, also asking for wage increases of 40% over the life of the contract.
And in Hollywood, the Writers Guild of America approved an agreement that raises pay and future residual earnings between 3.5% and 5%.
Few can blame these people for seeking pay increases as, just like the rest of us, they are struggling with a much-increased cost of living.
But these increases are way above the Fed’s target rate of 2% annual inflation and will soon start driving up the cost of goods and services even more. According to some studies, labor costs can account for as much as 70% of total business costs; this includes employee wages, benefits, payroll, and other related taxes.
These costs, of course, are passed on to consumers, a group that includes UPS drivers, autoworkers, pilots, and screenwriters. Hopefully, you see where this is going. We may end up with a cycle of higher prices driving higher wages driving higher prices, much like we saw in the 1970’s.
Eventually, this situation will be dealt with. On the monetary side, the Fed may raise interest rates to the point of driving the economy into a deep and extended recession. On the fiscal side, the government could reduce the constraints on energy policies, bringing down costs which would eventually flow through the rest of the supply chain. Finally, businesses will find solutions such as replacing labor with automation, enhanced by AI technology, and outsourcing means of production to lower cost companies located in or outside our country.
Based on what we have seen so far, we do not think it is likely that the Fed will drive up the funds rate much further from here, even though it would be effective in eventually driving down the rate of inflation. The Fed would surely be blamed for the pain and misery an eventual recession would cause. We do not think the political will exists to accept that. We are, therefore, inclined to believe that, instead of continuing to raise rates, they are more likely to leave rates where they are for longer than most people expect.
But even though we may see a pause in the Fed funds rate, that does not mean that we will not see interest rates continue to climb. While the Fed funds rate is a key driver for everything else, there are other rates that could continue to climb even after a Fed pause.
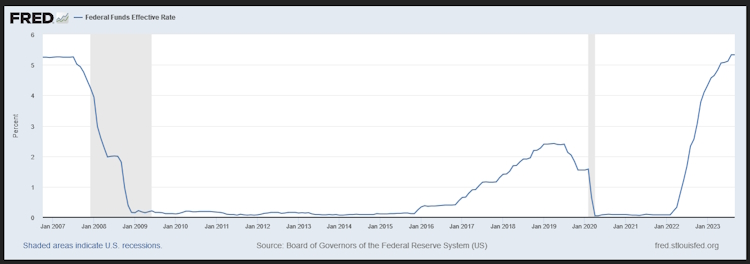
The prime rate is the interest rate that banks charge their corporate customers with the best credit profile. It is based on the Fed funds rate, but set by the banks, usually around 2.5% to 3% higher than the Fed funds rate. The prime rate is usually the basis for setting interest rates for mortgages, credit cards, and home equity lines of credit. Since each bank can charge its own prime rate, the published prime rate is the average rate banks charge. Both the Federal funds rate and the prime rate are market determined interest rates. In other words, they are determined through the interaction between supply and demand in their respective credit markets.
As shown below, the 30-year fixed mortgage rate is already well above levels just before and during the financial crisis even though the Fed Funds rate is not.
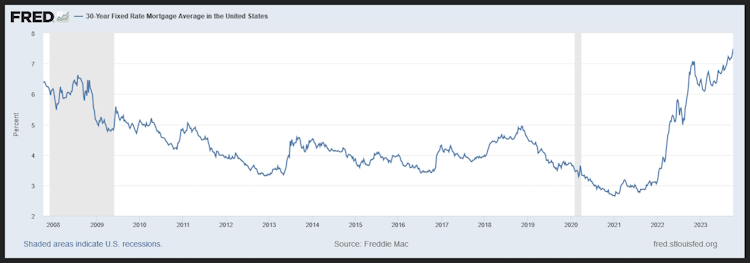
Mortgage rates directly impact the housing market which, as mentioned earlier, has now become unaffordable for the average person.
It’s also possible that Treasury yields could go much higher, particularly on 10-Year Treasury bonds.
It should be no secret that the US government has been running a budget deficit for decades. Those deficits must be funded by issuing debt in the form of Treasury bonds.
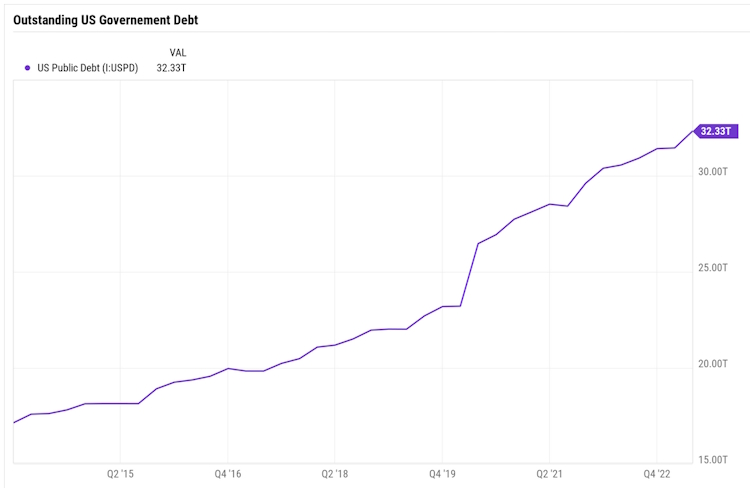
Up to now, the government has not had a problem selling those Treasury bonds. Most of our trade partners were more than happy to buy Treasuries with the dollars they received by exporting products to us. Over the past 20 years, Japan and China have owned more US Treasury bonds than any other foreign nations.
In fact, according to the US Treasury Department, in the year 2000, $1.7 trillion, or 18%, of total US government debt, was foreign-owned. By 2014, those figures had grown to $7.7 trillion and 34% — the highest percentage in US history. This made sense as the US possesses the only bond market capable of handling such large inflows of cash and was also considered to be the safest place to invest.
However, geopolitics is rapidly changing the situation. Because of actual economic sanctions or threats of sanctions, many countries are reducing or are no longer buying our debt. Investors from Russia, China, Saudi Arabia, and Indonesia sharply reduced their holdings of US Treasuries over the last several years due to sanctions and short-term capital needs, among other reasons. With fewer willing buyers and ever-increasing government spending, the interest rates on these bonds will likely have to increase simply by the law of supply and demand.
This also leads us to wonder what happens if there are not enough buyers, even at much higher interest rate levels. The last decade has seen increasing action by the Federal Reserve particularly in response to Covid policies over the last three years.
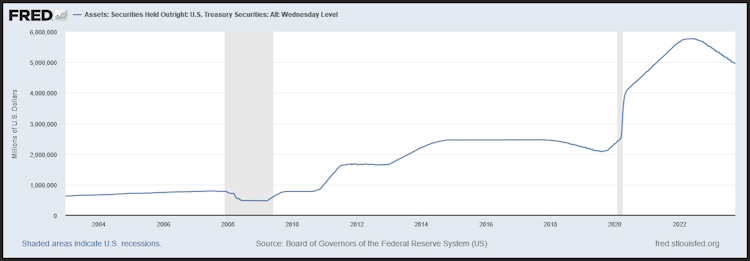
Has the Federal Reserve been pushed into becoming the “Lender of Last Resort” for the US government? This was never the intent, nor is it in its charter, but given the seemingly endless revolving door between Wall Street, the Fed, and the US Treasury, we believe that, regardless of original intent, the Fed is more likely to become a willing participant by funding the government debt than the government is likely to return to pre-pandemic spending levels.
In our Q1 2021 Letter, we gave a brief explanation of Modern Monetary Theory. Whether we like it or not, we may soon find that we are the guinea pigs in a grand experiment of that theory.
To summarize, higher interest rates impact the market in two different ways. Initially, they increase the cost of borrowing for businesses.
That makes it difficult to maintain operations and fund future growth. This hurts both promising companies with innovative products and services as well as questionable businesses that can only survive in a low-interest rate environment. Already, there have been over 120 major bankruptcies in the U.S. this year. And global data shows that troubled bonds and loans have increased substantially since 2021, suggesting that a significant number of companies may face challenges ahead in repaying their debts.
As interest rates rise, they compete with equities for investment dollars and can lead to a mild or even severe sell-off as larger investors keep their cash on the sidelines to collect that higher rate of interest.
While we can always hope for a return to some level of fiscal sanity, the more prudent approach is to accept that the situation will probably get worse before it is forced to get better and to position our investments accordingly. The best investments in a high-interest rate environment are companies with strong balance sheets and the pricing power to maintain their margins and cash flow. While not all such companies pay dividends, many of them do and at an increasing rate, allowing us to construct allocations that target both growth and income while still maintaining a conservative approach.
China and the BRICS+
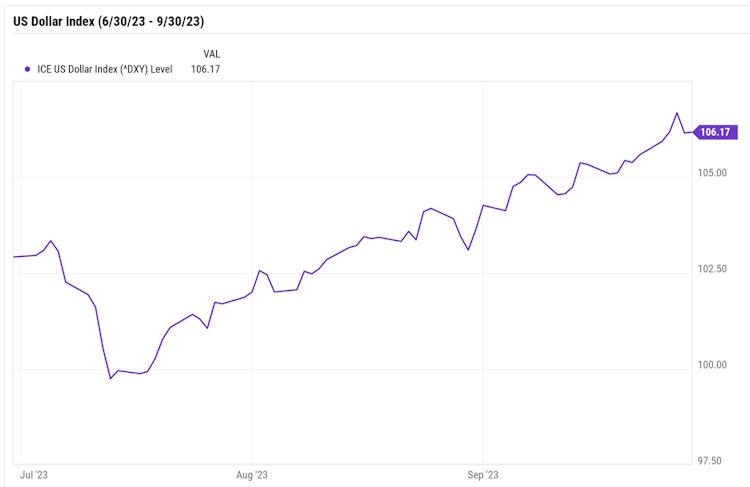
Despite all the build-up prior to the BRICS+ Summit, the meeting did not result in the crash of the US dollar, and in fact, the dollar index has risen since then.
However, the meeting was not without consequence. The group voted to expand the membership of BRICS for the first time since 2010. Saudi Arabia, the United Arab Emirates, Egypt, Argentina, Ethiopia, and Iran were all admitted to membership effective January 1, 2024.
Saudi Arabia is the key player in the so-called “petrodollar” arrangement forged by the Nixon administration nearly 50 years ago, agreeing to price their oil in dollars and getting other OPEC nations to do the same. In return, Washington agreed to protect Saudi Arabia and its allies against foreign invaders and domestic rebellions. From 1974 until last year, anyone who wanted to buy oil needed dollars and the dollar became the dominant global exchange currency for the modern world.
Could the dollar lose its reserve currency status? Most “experts” think not, but we’re in uncharted territory. The “BRICS + 6” are striving to increase their influence in areas long neglected by the West, namely Latin America and Africa along with the Persian Gulf countries. All these areas are rich in energy and resources necessary to fuel a modern economy. Should they prove successful, they will certainly exert more influence on the world stage than they’ve been able to in the past.
Of course, much of this is contingent on China being able to rise to economic dominance, which appears to be more in doubt every day.
What was once a nation driven by agriculture turned into one of the greatest economic development case studies in history. China’s economy grew from about 10% the size of the U.S. economy in 1978 to nearly 75% today. For years, it has been one of the fastest-growing economies in the world.
However, the same factors that helped its economy grow also led to a huge pile of debt. As of the first quarter of this year, China’s debt was more than 250% of its GDP.
The International Monetary Fund expects China to fall below 4% GDP growth in the coming years. That’s less than half of its tally for most of the past four decades.
Capital Economics believes China’s average GDP growth has already slowed to 3% and will fall to around 2% by 2030.
Carnegie Endowment for International Peace thinks China’s annual GDP growth is unlikely to exceed 2% to 3% for many years unless there’s a substantial increase in the growth rate of consumption.
The policies that propelled China into a global powerhouse yesterday are simply not working now.
A recent post at Visual Capitalist indicates how bad things are…
In July, the urban youth unemployment rate reached 21.3%, the highest ever recorded in the country, leading the National Bureau of Statistics of China to suspend future releases.
Exports fell by 14.5% in July, marking the third straight month of declines, and hitting lows not seen since February 2020.
The consumer price index moved into deflationary territory for the first time since 2021, with prices falling 3% year-over-year.
The yuan fell to a 16-year low against the U.S. dollar on August 16, 2023 in offshore trading
It’s no wonder that consumer confidence has plunged so low. At least we think so: the Chinese government stopped publishing that too.

In his zeal for achieving global supremacy, it could very well be that Xi has simply taken his eye off of the economy, assuming that it would just manage itself, or it could be that centrally planned economies simply don’t work. Regardless, it does not appear that China is positioned to lead the BRICS+ to an overthrow of the economic world order at the moment. At the risk of repeating ourselves, historically, the go-to remedy for a faltering economy is war.
We believe that countries like India and Suadi Arabia are hedging their bets, looking to benefit from a post-globalist world of dueling economic factions. Interestingly, both countries, along with Brazil, are now members of the G20 as well as the BRICS and all attended the G20 Summit held in September.
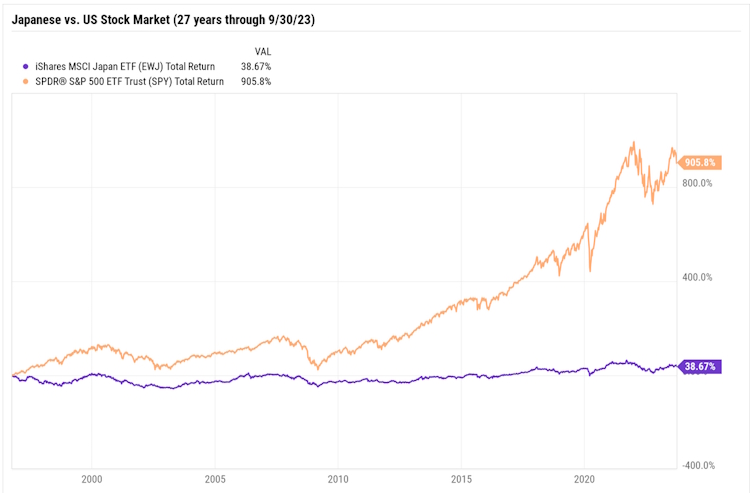
In the long run, the world economy will shift and contort, economies will rise and fall, and the leader will constantly face challengers for supremacy. In the 1980’s and 1990’s it was Japan that looked like it was going to take over the economic world, before their markets collapsed and left them dealing with decades of negative economic growth.
Now China is showing signs of the same type of potential collapse and with a much more authoritarian government, only time will tell where that will lead. In the meantime, other countries such as India will likely position themselves to fill any void left by China’s missteps.
Commercial Real Estate
As this topic is closer to home and will likely have a larger impact on domestic monetary and fiscal policies, we have spent a lot of time studying the situation.
The bad news is that commercial office buildings in the large metropolitan cities like Los Angeles, San Francisco, Chicago, and New York are operating well below capacity and as a result are losing value. We have seen estimates of as much as $250 billion in expected write-downs over the next few years.
The good news is that all other areas of commercial real estate, including regional office space, industrial space, and data centers are holding up very well. So, we are not likely to see a 2008 type meltdown resulting from the glut of office space. The bad news is that the large commercial real estate holdings are not evenly distributed across the banking industry, meaning that we could see more, even several more, bank failures in the coming year. This could raise fears about a possible “contagion” effect resulting in short-term selloffs in both the financial sector and the broader market.
However, if we are correct that these selloffs will be short-term in nature, then they will be buying opportunities to purchase good businesses as described earlier. They would also benefit from dividend reinvestment strategies that are still in the accumulation phase. If we keep ourselves out of situations where we must sell holdings to pay our bills, we should be able to come out of this period, however long it may be, in a better position than we were going in.
As always, we welcome your phone calls and emails. We are always investigating different strategies as well as individual investment opportunities and won’t hesitate to incorporate them into the mix if we are confident that they will be beneficial to our clients in the long run. Our business is not to sell subscriptions based on the hyped-up investment theme of the day, but to allocate your investment dollars responsibly and in line with your individual aspirations. Hopefully, the difference between the two approaches will become clear over time.

