Second Quarter 2023
After months of sideways movement, the S&P 500 finally broke through resistance and ended the quarter up 8.3% at the 4350 level. The Nasdaq ended up 12.8% while the Dow Jones Industrials, which led the “Big Three” Indices in 2022, closed up 3.4%.
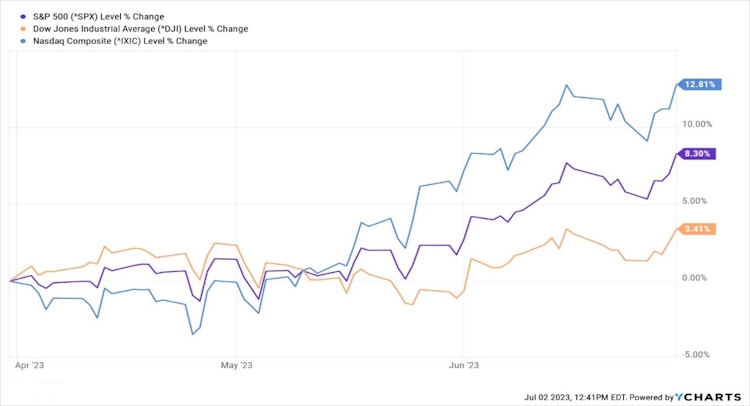
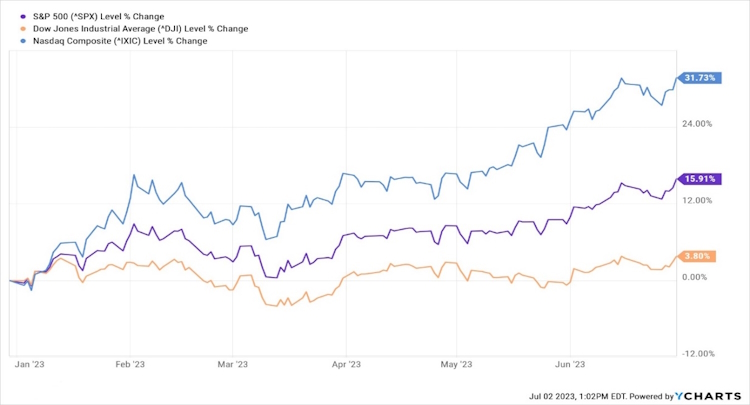
So far this year, the Nasdaq is up 31.7%, followed by the S&P with a 15.9% gain, while the Dow is up a mere 3.8%.
The disparity between the three indices provides a hint as to what has really been happening so far this year. We tend to check on what “the stock market” is doing to get a feel for our individual investments. We ourselves look at our own assets under management, the sum total of all our accounts, each week relative to the market’s performance and we would expect to see AUM rise and fall with the overall market. But, as you will see below, the performance of the major indexes doesn’t always match up with every individual sector or company.
Most of the S&P and Nasdaq gains so far this year have been driven by just seven companies – Apple, Amazon (AMZN), Alphabet (GOOGL), Meta Platforms (META), Microsoft (MSFT), Nvidia (NVDA), and Tesla (TSLA). This is clearly seen when looking at the chart below showing the Cap-Weighted S&P 500 index (in which each company is weighted in accordance with its market capitalization and is the one that it always reported) versus the S&P 500 Equal Weighted Index (where, as the name suggests, each company is given an equal weight regardless of market capitalization).
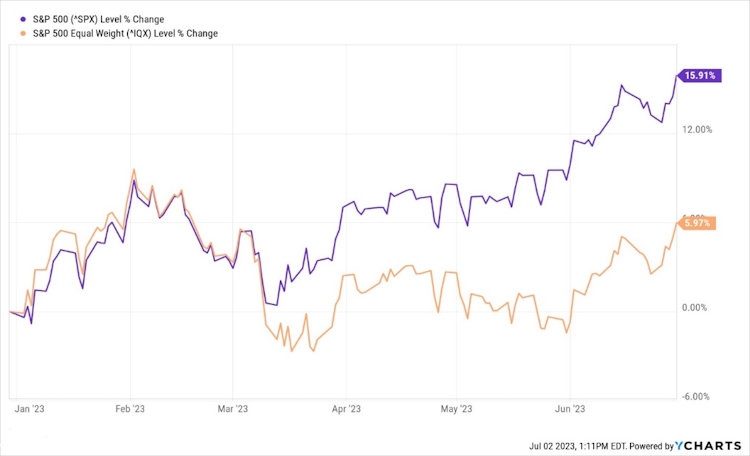
As these “Magnificent 7″ mega-cap tech stocks drove the S&P 500 from 3,00 to 4,200, after the “Silicon Valley Bank weekend” (more on that below) in March, the other 493 stocks stayed relatively flat until mid-June, providing evidence that everything doesn’t go up or down at the same time. However, we have rarely seen such a divergence in performance as we have seen this year, especially this last quarter.
So, the good news is, we didn’t miss the rally, it’s only getting started. While most accounts contain shares of the seven tech leaders, the concentrations may have been too low to match the index moves. While we incessantly preach that cash flow, not stock price, is the main driver of wealth and a secure retirement, we understand that it still feels nice to see your account values increase over time. We expect to see that play out in the second half, although not without ongoing volatility.
Looking into the next quarter, one thing to keep an eye on is the rollout of the FedNow service. FedNow is NOT a new digital currency aimed at replacing the dollar. FedNow is the Federal Reserve’s new instant payment service that will enable customers at participating banks and credit unions to send and receive money within seconds, 24/7 every day. We will be able to complete payments or transfers on weekends, holidays and after banks’ business hours, which isn’t the case for standard online transfers such as the commonly used Automated Clearing House Network (ACH).
FedNow will enable participating banks to offer instantly available funds and real-time payments to their customers. Two uses for FedNow at its launch include bill payments and account-to-account transfers. Being able to send money instantly could be helpful, especially if you’re on a tight budget and susceptible to late payment fees. You could pay right when a bill is due and receive immediate confirmation that a payment is accepted. FedNow will be available to all banks and credit unions, but there’s no current requirement for them to join.
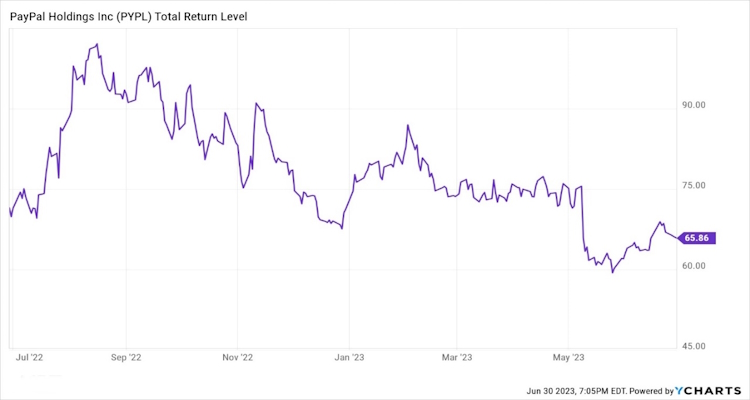
While we see this new capability as being positive, any issues during the rollout could cause short-term panic across the financial markets. It may also become a threat to consumer-facing services like Paypal and Zelle (owned by seven of the largest US banks).
The Economy
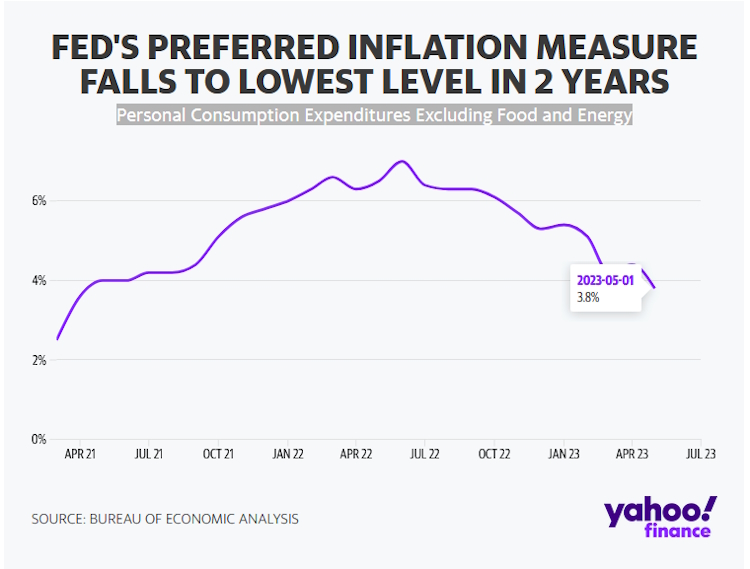
The “big” news was that the Personal Consumption Expenditures Excluding Food and Energy Index, the Fed’s preferred inflation gauge, dropped last month to its lowest level since April 2021, pulled down by lower gas prices and slower-rising food costs.
From Yahoo Finance:
last month’s progress in easing overall inflation was tempered by an elevated reading of “core” prices, a category that excludes volatile food and energy costs. The increase underscored the Fed’s belief that it will need to keep raising interest rates to conquer high inflation.
Core prices rose 4.6% in May from a year earlier, down slightly from the annual increase of 4.7% in April. It was the fifth straight month that the core figure was either 4.6% or 4.7% — a sign that the Fed’s streak of 10 rate hikes over the past 15 months hasn’t subdued all categories of prices. From April to May, core prices increased 0.3%, a pace that, if it lasts, would keep inflation well above the Fed’s 2% target.
Per the New York Fed, total household debt rose by $148 billion, or 0.9 percent, to $17.05 trillion in the first quarter of 2023, according to the latest Quarterly Report on Household Debt and Credit. Mortgage balances climbed by $121 billion and stood at $12.04 trillion at the end of March. Auto loan and student loan balances also increased to $1.56 trillion and $1.60 trillion, respectively, but credit card balances were flat at $986 billion. This could partially explain why personal spending only increased by 0.1 percent in May 2023, compared to a 0.6 percent gain in April (income tax refunds?). Perhaps spending limits are getting maxed out.
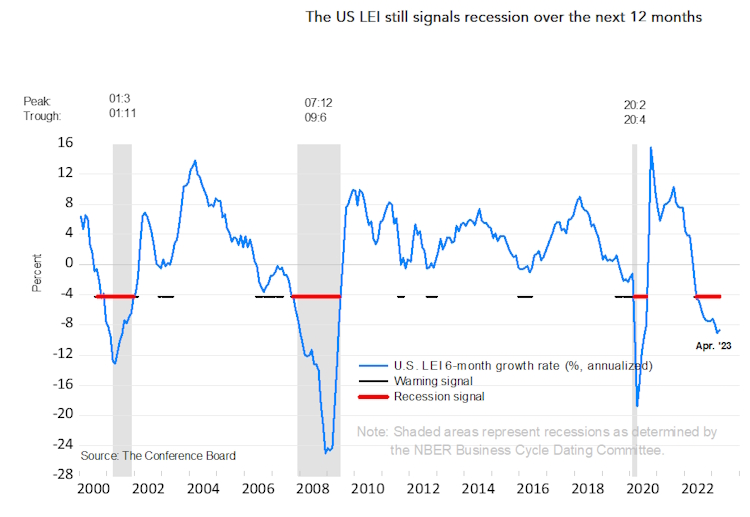
The Conference Board Leading Economic Index® (LEI) for the U.S. declined by 0.7 percent in May 2023 to 106.7 (2016=100), following a decline of 0.6 percent in April. The LEI is down 4.3 percent over the six-month period between November 2022 and May 2023—a steeper rate of decline than its 3.8 percent contraction over the previous six months from May to November 2022. They also revised their Q2 GDP forecast from negative to slight growth, and project that the US economy will contract over the Q3 2023 to Q1 2024 period.
This may come as a surprise to those who track GDP as the government’s third estimate was revised up notably to a 2% annualized advance in the first quarter.
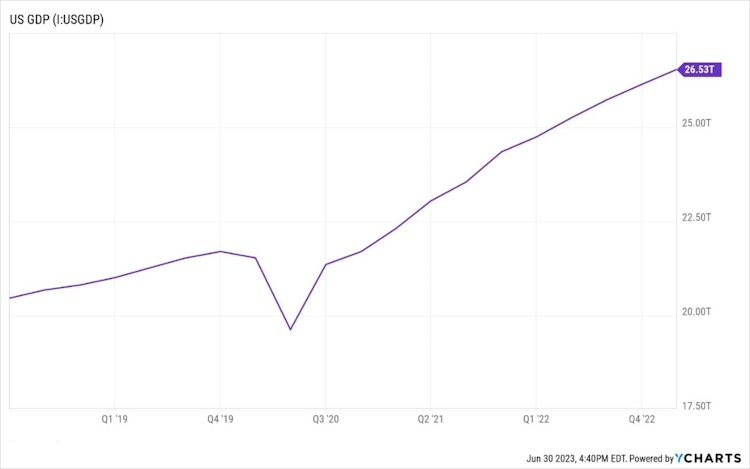
However, there are two factors to consider. The first is that GDP measures the monetary value of final goods and services—that is, those that are bought by the final user—in a given period of time. But because GDP is collected at current, or nominal, prices, one cannot compare two periods without making adjustments for inflation. To discount the impact of inflation, we need to look at Real GDP, doing so gives us a different story.
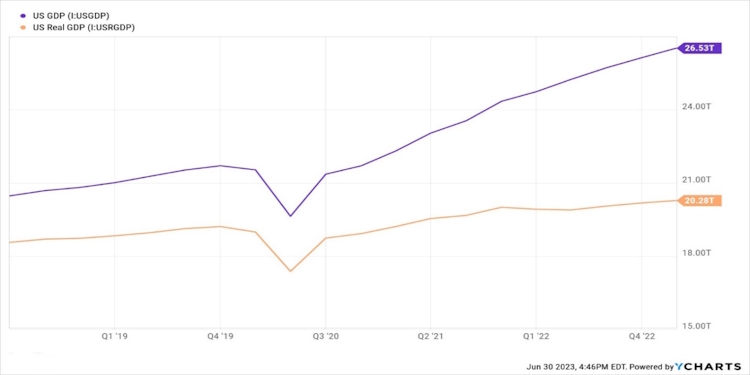
As you can see, when we account for inflation, true economic growth is trending at a far lower rate than the headline numbers would have us believe. Second, since the end of World War II, the U.S. government’s share of expenditures as a percentage of GDP has steadily increased, and as the government’s contribution increases, it becomes harder to use GDP as a measure for the real economy because in good times and especially in bad, the government doesn’t stop spending money. Between the American Rescue Plan Act ($1.9 Trillion), the Inflation Reduction Act ($700 Billion), and the Omnibus spending bill ($1.65 Trillion), there’s plenty of government cash to paper over a slowdown in personal spending.
Labor Force Participation continues to remain below pre-Covid levels and substantially below its peak in early 2000.
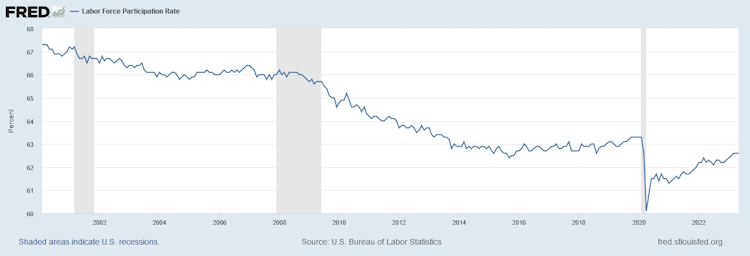
This drop in the workforce remains a mystery to us as, especially with rising prices, we would expect more people needing to work in order to make ends meet. The US Chamber of Commerce put out a study in June where they took a deeper look into the data behind the labor force gap. They found not one, but several factors contributing to the low participation rate.
Twenty-seven percent of non-working adults indicated that the need to be home and care for children or other family members has made the return to work difficult or impossible. More than a quarter (28%) indicated that they have been ill, and their health has taken priority overlooking for work. Along those same lines, the study also revealed some are still concerned about COVID-19 at work while others said that the pay for what they were being asked to do was too low, while others were more focused on acquiring new skills and education before re-entering the job market.
Additionally, women are participating in the labor force at the lowest rate since the 1970s. In the spring of 2020, 3.5 million mothers left their job, driving the labor force participation rate for working moms from around 70% to 55%. 23% of women cited others in the family making enough money that working full-time is not as critical as the reason they have not re-entered the workforce. However, high inflation is driving down savings accounts, necessitating the need for many to return to the workforce.
Another stumbling block is that workers need reliable childcare. The government reaction to Covid forced many childcare providers to close or scale down: between February and April 2020, the industry lost 370,600 jobs — 95% of which were held by women. So, employers are caught in a chicken and egg cycle that makes recovery slow and financially difficult.
Finally, there is the issue of teen employment, once a staple of our working-class culture. According to a study by the Hamilton Project and Brookings Institution, the share of teens participating in the labor force peaked 40 years ago and has declined ever since. In 1979, nearly 60% of American teenagers were employed, an all-time high. Today, just over one-third, or 35%, of teens between the ages of 16 and 19 are part of the workforce.
The current Labor Force Participation Rate is essentially back to where it was in the late 1970’s, the beginning of the dual-income family model. Whether this is a sign of a shift back to the one-income family, or something else, is yet to be seen. In the meantime, businesses will have to deal with ongoing labor shortages either through the creation of more efficient processes, greater investment in automation wherever it is cost effective to do so, or continued out-sourcing to emerging economies with cheap and plentiful labor. Companies that navigate this proficiently will create greater competitive advantages in the marketplace.
While we look at Labor Force Participation, the Federal Reserve prefers to look at the Unemployment Rate, which seems to have leveled off to pre-Covid percentages and gives the illusion of a tight labor market.
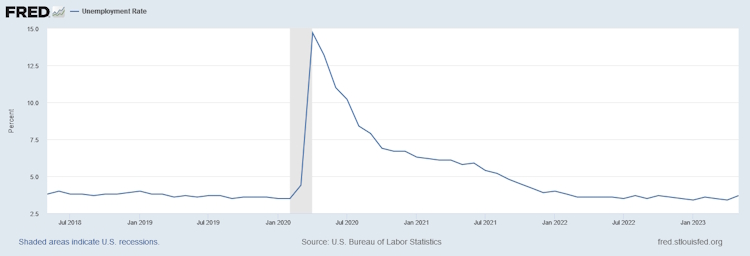
Using this metric allows the fed to justify additional rate hikes. In their latest economic forecast, which is released each quarter, central bank officials project interest rates will peak at 5.6% by year-end, 50 basis points higher than the previous projection and suggesting two more 25-basis-point rate hikes after this short pause.
Rate hikes, of course, increase borrowing costs for businesses trying to scale up capacity. These headwinds will have a negative impact on growth and will favor the larger, established companies in those industries that are more capital intensive such as manufacturing and energy. It will also negatively impact poorly capitalized start-ups, many of them in the technology sector. This is not necessarily a bad situation. In recent years, many companies not worthy of investment were brought public via IPO’s as venture capitalists took advantage of near-zero interest rates to keep those companies going long enough to cash out with big gains.
In the age of 24-hour news, email, and social media, it is a lot easier to sell a bad business with a good story to an impatient public hoping to buy the next Apple, Google, Tesla, or Facebook before the price goes vertical.
Mania is the enemy of the individual investor who thinks 100% gains are commonplace. In truth, a good idea is one thing, implementation is another, and profiting still another. Sometimes the ideas with the most sex appeal make the worst investments.
Whether the promised additional rate hikes are enough to pull us into a technical recession or not is of little consequence in the long term, especially when we are focusing on using investments as vehicles to deliver cash flow. In the short term, stock prices will drop during a recession, but recessions don’t last forever and the prices of well-run companies (and lately, some poorly run, but well-connected companies) have always recovered and eventually surpassed their previous levels.
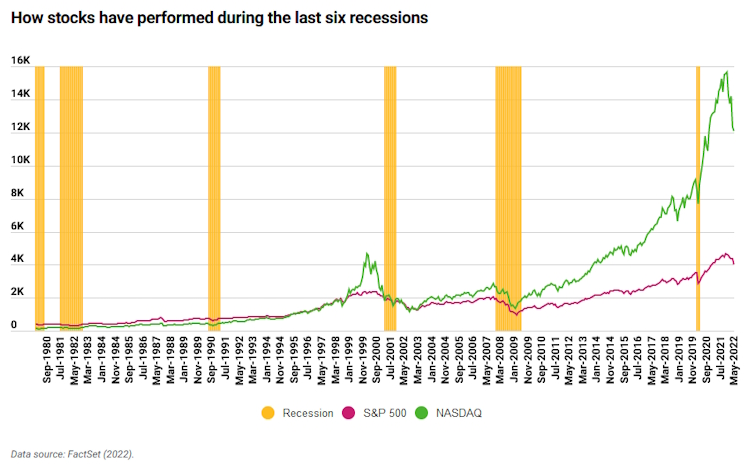
In between, the market gives opportunities to load up on great companies either through dividend reinvestment or fresh capital.
What does concern us are those potential seismic events that could potentially produce long-term harm. Here’s what’s at the top of our list.
The Banking Crisis
To be honest, we were expecting the market to at least test the December or October lows following the collapse of Silicon Valley Bank (SVB) in March. This was based on comments made by Treasury Secretary Yellen on Sunday, March 13, that while the collapse of Silicon Valley Bank, “is clearly a concern”, a federal bailout was not on the table.
Then, before the financial press even had time to dissect and report on Yellen’s morning commentary, US regulators rolled out emergency measures Sunday evening to stem potential contagion from the collapse of Silicon Valley Bank. The measures included ensuring that depositors with the failed bank would have access to all their money, not just the $250K guaranteed by the FDIC, on Monday morning.
The announcement came as a second bank, Signature Bank, was closed on Sunday by regulators. Depositors in Signature were also made whole.
More significantly, the announced actions included a measure allowing banks to borrow essentially unlimited amounts from the Federal Reserve for the next year, as long as the loans are matched by safe government securities. The idea is that banks can meet withdrawal demands without having to sell government bonds that have fallen in value over the last year as interest rates have risen. In turn, it is hoped the increased bank liquidity will short-circuit the type of bank runs that doomed Silicon Valley and Signature banks.
Below is a chart of the S&P 500 versus SVB Financial Group, the listed security for Silicon Valley Bank. Note how the market reverses direction almost immediately after the government’s actions.
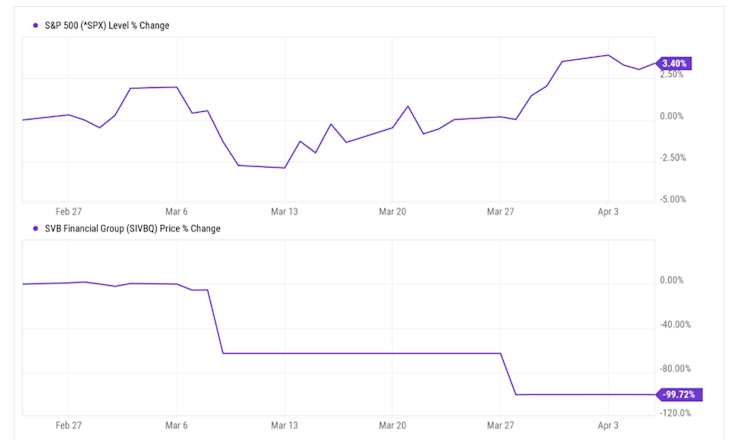
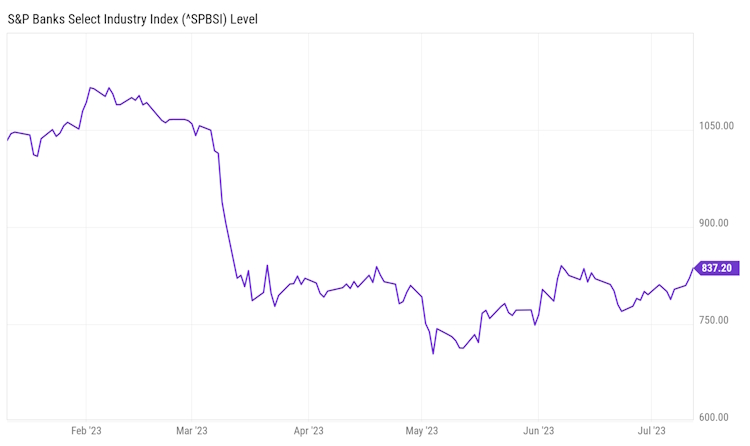
Without this government action, the entire bank sector was at risk of a meltdown. After the failures of Silicon Valley and Signature banks, the market was tested by the collapse of First Republic Bank on May 1st. The swift resolution of that event provided confidence that any further bank problems could be contained and the turmoil in the banking sector had abated. The bank index bottomed out within days and has begun recovering, albeit modestly.
Nonetheless, according to Weiss Ratings, there are currently 683 banks with a rating score of D or E which means that “these institutions currently demonstrate significant weaknesses which could negatively impact depositors or creditors. In an unfavorable economic environment, these weaknesses could be magnified.”
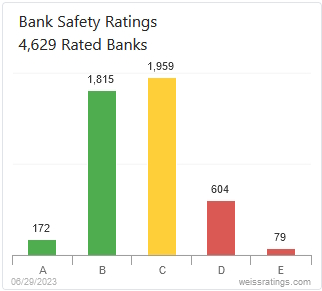
Additionally, the Federal Deposit Insurance Corporation maintains a Problem Bank List based on measures of a bank’s capital adequacy, asset quality, management, earnings, liquidity, and sensitivity on a scale of 1 to 5, with 5 being the worst. The latest available data on the number of FDIC-insured institutions on the “Problem Bank” list which is comprised of banks with an overall rating of 4 or 5 is for the year-end 2022. According to the FDIC’s reports, the number of problem banks at that point was 39. Assuming that Silicon Valley, Signature, and First Republic were on that list implies that 36 banks are likely considered troubled. If more bank failures materialize the sector would likely see further price weakness.
Commercial Real Estate
One of the issues that could put pressure on banks is the commercial real estate market.
Commercial real estate vacancy rates in the US are at an all-time high, with 12.9% of office space being vacant in the first quarter of 2023, according to CoStar Group. Much of the vacancies are in major US cities.
Office vacancy rates across the country stand at a record 19.1%, with Chicago, Houston, and San Francisco running above 20%, according to Jones Lang LaSalle (JLL). Seattle’s vacancy rate rose 3.8% over the past 12 months to 19.53%, with a sublease vacancy rate of 4.3%, the third highest among major markets (source is again JLL).
New York City’s office vacancy rate hit a record 16.1% in the first quarter of 2023, representing more than 76 million square feet with Manhattan’s skyscrapers hovering around the 50% occupancy mark. The industrial vacancy rate for the Outer Boroughs recorded an uptick of 20 bps from the previous quarter to 4.2%. 2 Remote work is killing Manhattan’s commercial real estate market, with a study estimating that lower tenant demand due to remote work may cut 28%, or $456 billion, off the value of offices across the US, and about 10% of that would be in New York City alone.1
Shopping center giant Westfield confirmed that the company and partner Brookfield Properties earlier this month stopped making payments on a $558 million loan securing the San Francisco Centre property, less than a week after Park Hotels & Resorts announced it had handed two prominent hotels back to the bank. The real estate investment trust said it was abandoning the Hilton San Francisco Union Square and Parc 55, saying the city’s streets are unsafe and expressing doubts about the area’s ability to recover. Some analysts have forecast a dim future for city centers, likening the crisis to the slow death of many American shopping malls.
More than two-thirds of all commercial real estate loans are held by small- and medium-size banks, prompting concern that regional banks might be unable to withstand a wave of defaults if landlords cannot pay off loans.
Global Conflicts
The Russia / Ukraine war has now extended beyond 500 days, in a report updated in May from the Kiel Institute for the World Economy, since the war began, the U.S. has directed more than $75 billion in assistance to Ukraine, which includes humanitarian, financial, and military support. The report notes a large amount of assets coming out of the US arsenal which will eventually have to be replaced by equivalent, or even more advanced, weaponry, systems, and equipment. This is great for the aerospace and defense industries. However, the longer this continues, the greater the chances of escalation with weapons that can reach anywhere in the world.
China
As we have stated previously, a weakened opponent is often more dangerous. China’s economic recovery showed signs of weakening in May, with a slowdown in growth observed in both industrial output and retail sales. To stimulate the economy, the People’s Bank of China recently lowered the interest rate on its one-year policy loans by 10 basis points to 2.65%. The country’s economy is facing several challenges, including low business and consumer confidence, a sluggish property market, and a decline in global demand for exports.
According to World Bank data, approximately 42.9 per cent of China’s total population still lives in extreme poverty. If the economic growth that drove President Xi to power begins to falter beyond his ability to maintain public confidence, he may be inclined to create even greater conflicts outside his borders as a means of distraction. Right now, the prevailing sentiment is that China is the rising superpower ready to overtake the US in global reach and influence. Anything less than that would be an embarrassment and we can only speculate how far he is willing to go to avoid a change in perceptions.
BRICS+ (Brazil, Russia, India, China, South Africa, plus…)

Bangladesh, Algeria, Argentina, Egypt, Iran, Saudi Arabia, the UAE, Nigeria, and Syria are the latest group of countries that are now expressing their desire to sign up for BRICs+ membership.
These are among the most populous nations in the world (Nigeria, Egypt, and Bangladesh) and several of them have significant natural resources including Nigeria (oil), Algeria (natural gas), and South Africa (minerals).
The BRICS+ next annual leaders’ summit conference is scheduled for August 22–24. Their desire to ditch the dollar for international trade in goods and services has been made abundantly clear. Announcements of bilateral and multilateral agreements among countries to trade for goods and services in currencies other than the U.S. dollar are on the increase since the US placed sanctions on Russia in response to the Ukraine invasion. Russia and China are far down the road in terms of using their respective currencies for bilateral trade. China and Brazil have agreed to accept each other’s currency for goods and services traded between them. China is now Brazil’s largest trading partner.
This has not been lost on the US and, on June 7th, the House Financial Services Committee held a hearing called “Dollar Dominance: Preserving the U.S. Dollar’s Status as the Global Reserve Currency.” And at a recent financial summit in France, Treasury Secretary Yellen directly pushed back on comments made by Brazil’s President Luiz Inacio Lula da Silva and South Africa’s President Cyril Ramaphosa regarding the role of the dollar as the world’s reserve currency.
We are sure that the West is already preparing counter measures and any further moves by the BRICS+ beyond what has already happened will surely get a reaction. Regardless of what they may do, any volatility in the value of the US dollar could roil markets and worsen our economic conditions. One thing we believe is that any reaction by central bankers and governments will be focused on preserving their power and status regardless of the impact on the average citizen.
As a country, we have not managed our finances well, especially over the period since 2008 with a debt to GDP ratio rising over 120%. If every dime we made was put toward paying down our debts, we could not take it to zero in a single year. Another recent study emphasized the idea that increasing debt beyond 100% of GDP does not enhance economic growth and may actually have the opposite effect, and while we may be in better shape than the rest of the world, we will not come out of an economic conflict unscathed.
US Debt to GDP Ratio
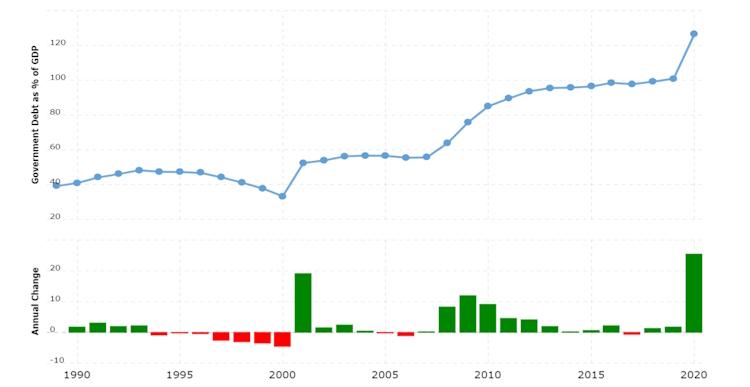
Source: World Bank
We will be paying close attention to events as they unfold in the second half of the year.
Again, thank you for being our clients and allowing us to work with you in attaining your financial goals. The purpose of our letter is to briefly explain what has happened in the last three months and more importantly, look forward to what is currently happening and to try to help you make sense of the world from a financial perspective.
When we see opportunities, we will shift our holdings to take advantage of them. We also adjust as risks arise, but always with a long-term view in mind. Personal financial success looks different to everyone, but in all cases, it is best managed as a marathon and not a sprint.
As always, we enjoy your questions and comments, whether through emails or phone calls so please do not hesitate to connect with us as questions or concerns arise.

