September Swoon
After a seemingly endless run up in prices, the market finally started to pull back at the end of the 3rd Quarter:
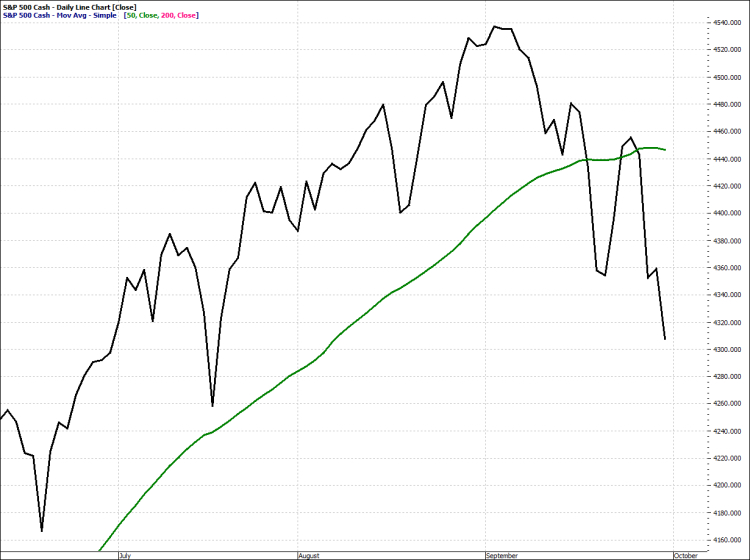
S&P 500 Q3 – 2021 Price Chart
The green line on the chart is the 50-day moving average which is a common technical indicator used by traders to determine potential changes in price direction.
While this chart looks a little frightening with its depiction of a broken upward trend, it is always wise to zoom out and put things in the proper context.
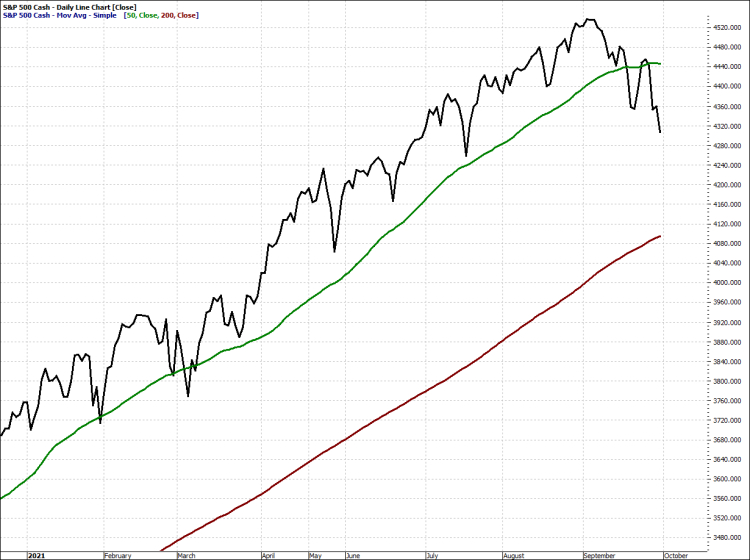
S&P 500 YTD Price Chart
In addition to the green 50-day moving average, this chart also brings the red 200-day moving average into view. As you can see, while the index is trading below the 50-day line, it is nowhere near trading below the 200-day line.
Most importantly, it is a long way from the legendary “Death Cross” where the green 50-day line crosses below the red 200 day line.
Sticking with a technical perspective, historical data indicates that once a new bull market has been confirmed (which happened on August 18th of last year when the S&P 500 Index had recovered from its March 23rd, 2020 bear market low point, and achieved a new record price), the longest time period on record (going back to 1950) before the beginning of another bear market was 7.44 years, with an average beginning of 2.44 years.
We are just over one year since the point of the new bull market confirmation so we would be bucking history if a new bear market were to start so soon.
Additionally, history shows that there has usually been at least one 10%+ correction (and often several) between the end of one bear market and the start of another. On average, a little over one-year elapses from bear market end to a correction of 10%. The first such correction in the current bull market was completed just under one year ago on September 24th. Since then, we haven’t had a 5% correction in the S&P 500 until this September, making this one of the longest streaks ever without a correction.
Sticking with history (in this case the past 45 years), which we acknowledge is no guarantee of the future, we know that September has historically been the worst-performing month in the market, as we see in this chart from theancientbabylonians.com
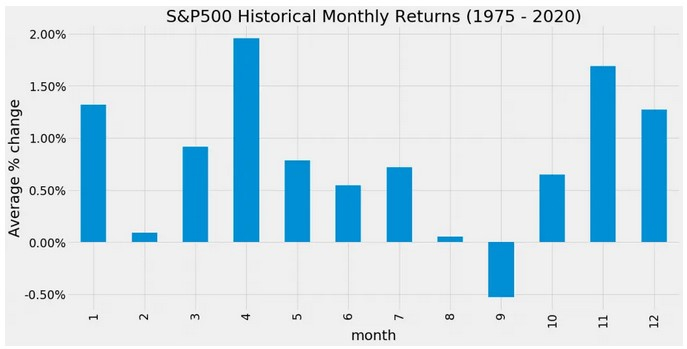
In fact, looking at this chart, one could argue that September would be the best month for putting new money to work in the market. We have not done any analysis on how this would work as a strategy, but perhaps we will explore it in one of our future Market Insights posts.
To summarize, it’s not unusual to see at least one, if not multiple, 5 – 10% corrections during a Bull market and certainly less unusual to see them occur around the September timeframe.
Beyond technical or historical reasons for the pullback are the usual suspects that we’ve been discussing:
- The Fed
- The economy
- Inflation
- China / geopolitical
Reasons for the Pullback: The Fed
Let us say this right up front, we don’t think the Federal Reserve’s support for the economy is going away anytime soon. Though we do not have a direct line to Chairman Powell or any other of the voting Fed Governors, we can look around and know that, if the Fed were to take away the stimulus punch bowl, the party would come to a crashing halt. From Greenspan to Bernanke and from Yellen to Powell, the Central Bank continues to paint themselves into an economic corner. Escape from that corner will likely be messy.
None of the Fed governors want to go down in history as having brought down the US economy, so they will continue to kick the can down the road for as long as possible.
We hate sounding like a broken record, but we believe that the Fed not only wants, but needs inflation. It doesn’t take a Harvard economist to know that the U.S. is well beyond its ability to ever pay down the government debt with real economic growth. Therefore, the only course the Fed has is to drive inflation to reduce the real value of the government debt.
The trick is to thread the needle: allowing the reemergence of higher inflation without causing a panic by letting it rise too high, too fast. Higher interest rates depress economic growth and can ultimately bring down inflation, as we saw in the 1980’s, so it would be a direct hindrance to any attempt to increase the rate of inflation.
That does not mean that the Fed will not adjust based on economic conditions strengthening or weakening to maintain some semblance of credibility.
Since 2009, the Fed has been purchasing treasuries and mortgage-backed securities in a process known as “Quantitative Easing” or “QE” for short. By buying U.S. government debt and mortgage-backed securities, the Fed reduces the supply of these bonds in the market, causing other buyers to bid up the prices of the remaining supply, which then lowers their yield, thus keeping interest rates low.
Low government interest rates also impact other interest rates such as corporate bonds and mortgages which, in theory, entices individuals to borrow for mortgages or car loans and businesses to borrow for new equipment which ultimately could improve hiring. Low rates are also associated with higher asset prices (inflation) which increases the perceived wealth of households and encourages more spending. This is known as the “wealth effect.”
Currently, the Fed is buying $120 billion worth of Treasuries and mortgage-backed securities every month.
Those purchases were an emergency measure intended to keep borrowing costs low during the pandemic caused recession of last year. The chart below illustrates how quickly the Fed ramped up its purchases of Treasury securities and its purchases of mortgage-backed securities, as shown in green when the COVID-19 virus started hurting major parts of the economy.
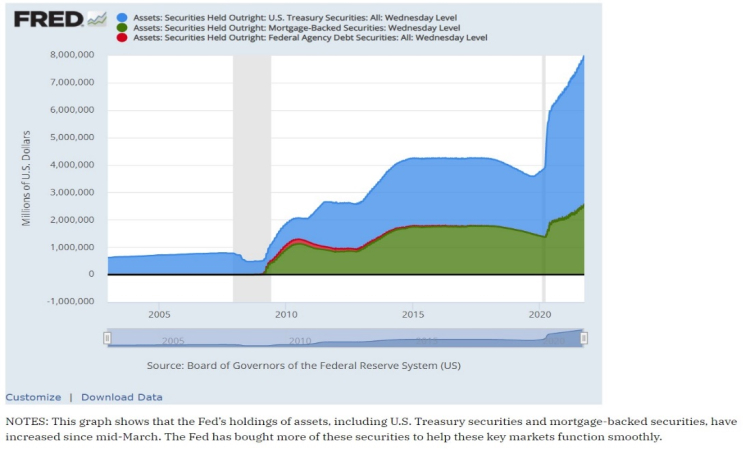
These actions were intended to convey to the public that the Fed stood ready to backstop important parts of the financial system. It has resulted in an increase in the Fed’s debt holdings to nearly $8 trillion.
So, in a policy announcement made on Wednesday, September 23rd, the central bank said it would begin tapering its government bond and mortgage-backed securities purchasing program.
Investors have been waiting for the taper comment for quite some time as the economy began to open up. The worst-case scenario would have been the commencement of a tapering program immediately, signaling the withdrawal of stimulus. But since it made no such commitment, investors can feel confident the central bank will keep policy accommodative for now, which should continue to support the upward trend in U.S. stocks.
Chairman Powell stated that employment could meet the Fed’s progress test as soon as the next meeting. The implication is a taper announcement could happen at one of the two remaining 2021 policy meetings in either November or December.
Powell went on to say that the central bank could complete its asset purchases sometime around the middle of next year. He said there is broad support on the policy committee for the timing and pace of tapering. The statement indicates those purchases would be diminished by $12 billion per month if it were to begin next month and end next August. Wall Street’s worst-case scenario has been $30 billion per month.
Lastly, Powell said the timing and pace of the coming reduction in asset purchases will not be meant to signal when an interest-rate hike is coming. That will have a more difficult and stringent test. A rate hike will not happen until labor market conditions have reached maximum employment and inflation is on track to exceed 2% for some time.
The central bank believes the economy is headed back on the right path. The Fed believes its emergency measures have been a success.
They rescued the financial system from collapse and have helped boost economic output which is on its way to surpassing 2019 levels and therefore, the economy no longer needs emergency measures and hence the wind-down of stimulus measures.
We want to reiterate that tapering does not mean raising short-term rates.
It also does not mean the end of asset purchases by the Fed, but rather a reversion to pre-pandemic levels. Reduced bond buying could raise yields on 10-year Treasury bonds back up to the 2% range over time.
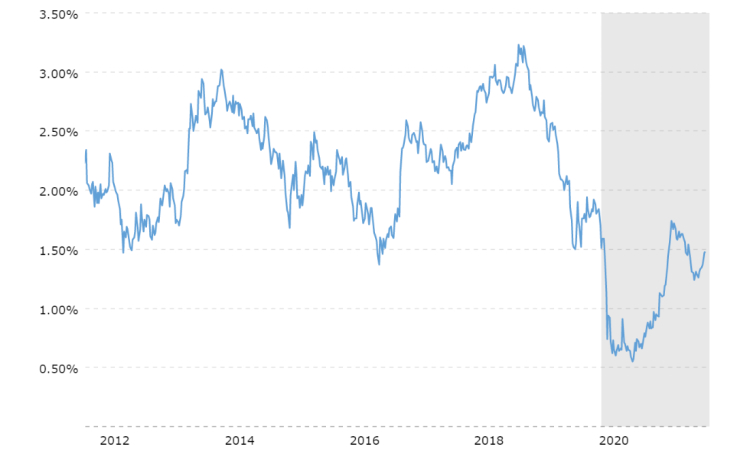
10 Year Treasury Rate
Source: Macrotrends.com
A move up from current levels could produce short-term stock market volatility as the “rates are rising” meme starts to permeate the collective consciousness. But 2% is a far cry from “high” interest rates. We expect that a rise back to 2% should be offset by continued economic and earnings growth, so we do not anticipate it causing a change in the overall market trend.
Reasons for the Pullback: Inflation
The Fed continues to assert that inflation is transitory. It expects that as temporary supply-chain constraints are worked out, inventories are replenished, and supply becomes more readily available, costs will adjust accordingly. Although in recent congressional testimony, Chairman Powell indicated that it may take “a little bit longer” for the adjustments to finally take place.
Last quarter, we talked about how inflation was hitting multi-decade highs in several categories.
Many of the price rises were caused by an imbalance of supply and demand instead of a real decline in the purchasing power of the U.S. dollar. As prices accelerated (like used cars, housing, and labor prices), interest rates started to soar. The benchmark interest rate hit 1.75% earlier this year.
Many investors started to fear that interest rates would rise alongside prices. But instead, as shown in the chart below, they actually turned lower with 10-year government bonds falling back to 1.35%. and U.S. 30-year mortgage rates hitting all-time lows early this year, below 3%. Today, mortgage rates are hovering around 3% which still makes it a great time to refinance if you haven’t yet.
So, we have a divergence between the reported rate of inflation and interest rates, which we know cannot last in the long term.
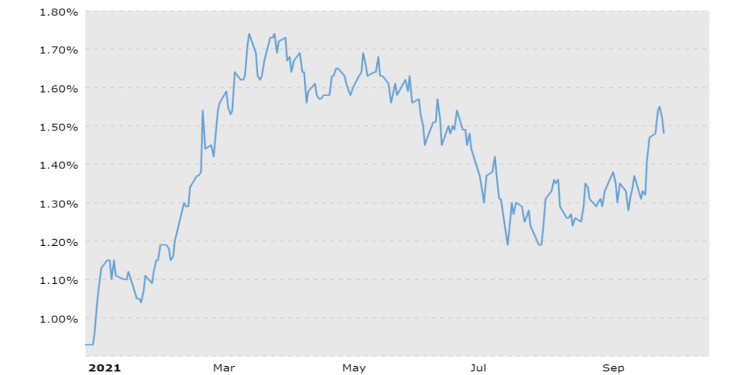
10 Year Treasury Rate Year to Date
Source: Macrotrends.com
The question is, which do we trust, interest rates or inflation, as an indicator of the future?
The Consumer Price Index (CPI) and Producer Price Index (PPI) track prices paid over a certain period. But they are backward looking in nature and tend to tell us “what was” as opposed to “what’s next.” Interest rates, on the other hand, represent the collective beliefs behind the real time investment of trillions of dollars. So, interest rates can serve as a “forecast” of inflation and the economy.
Interest rates had been falling despite record-setting inflation numbers. They’ve crept back up to around 1.5% today but are still below the peak of earlier this year.
The market appears to be telling us that these high inflation rates won’t last for long.
Are there risks? Yes! As we wrote last quarter, the administration made several moves to reduce the production of domestic oil and natural gas which has driven the price of oil above $75 per barrel (as measured by West Texas Intermediate) causing gasoline prices to increase around 42%! Natural gas (used in both the production of electricity as well as for home heating) has also seen its price increase above $6 per BTU. This will result in home heating bill sticker shock as we head into the winter season.
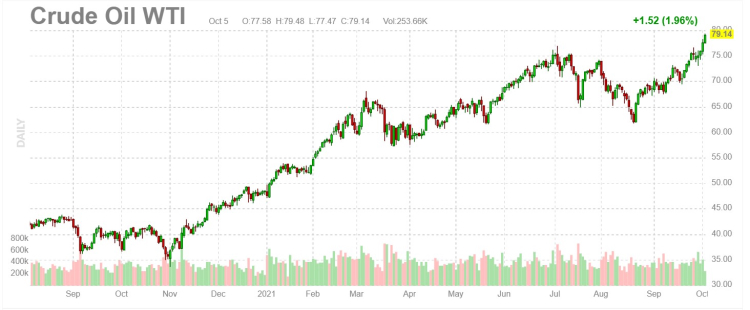
Source: Finviz.com
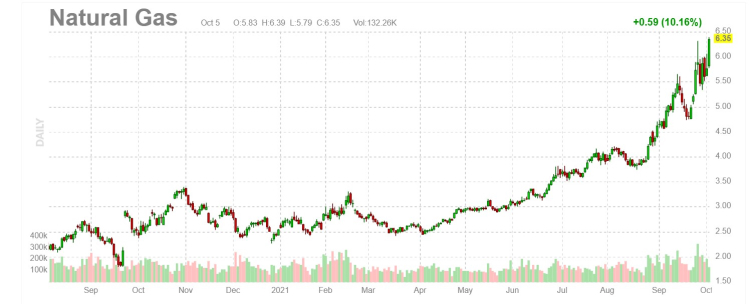
Source: Finviz.com
These moves by the administration appear to be a deliberate effort to raise energy prices to the point where alternative means of electric power generation become more competitive. The increased costs directly impact middle- and lower-income populations (a de facto regressive tax) and will produce a drag on economic growth as discretionary dollars are diverted to pay for higher gasoline, heating, and lighting bills.
Moreover, higher energy costs will hurt corporate profits outside of the oil industry and delay hiring and business expansion for both large and small firms. And lest we forget, byproducts from the refining process are used in a variety of applications including cosmetics, pharmaceuticals, plastics, clothing, rubber, and even the humble candle.

We might be looking at a version of the “stagflation” experienced in the 1970’s where higher prices coincide with a stagnating economy
This is something to keep an eye on as the economy continues to reopen. Major banks have already lowered their growth projections for 2022 so they seem to be reacting to the things we are seeing.
Reasons for the Pullback: China
Developments in China concern us much more than anything else at this moment. We’ve been reading articles from several trusted sources and when we try to connect the dots, we find a potential threat to global markets.
We’ll start with the headlines and then dig deeper, peeling away at the onion if you will.
Up until a couple months ago, hardly anyone had ever heard of the Chinese property company Evergrande. Now all eyes are on Evergrande, as the company appears to be on the verge of a financial collapse which could threaten to take the global financial system down with it.

Evergrande owns over 1,300 real estate developments throughout China worth more than $352.5 billion. According to Bloomberg, it generated $73.5 billion in revenue last year and is on track to generate just over $79 billion this year.
However, China Evergrande recently expanded into non-traditional business lines as sales growth in its core business slowed. Some of its new ventures include electric vehicles, bottled water, and insurance. As a result, its debt load swelled from $25.1 billion in 2014 to $110.6 billion today. And its total liabilities are estimated to be around $306.3 billion.
Last year, the Chinese government introduced regulatory limits on debt ratios. Evergrande is reportedly working to meet those requirements by the end of 2022 by selling assets and spinning off business units to pay down its debt. But twice in the last two weeks, the company announced it’s struggling to meet its goals and floated the possibility of defaulting on its debt.
The company revealed making late payments on commercial paper obligations back in June, according to Reuters. And with the recent statement about a lack of progress reducing debt, investors are worried about the potential fallout should the company default. It’s estimated that over 250 banks and non-financial institutions hold loans made to Evergrande.
Regulators are said to have approved a renegotiation of payment deadlines by Evergrande with its creditors. This suggests they’re worried about the company’s ability to meet its obligations. And if it fails to do so, it could have a domino effect on China’s debt and property markets. Those bond and loan investors could be facing write-downs unless the government bails them out.
However, the state-run media outlet Global Times, which is known for being the mouthpiece of the hardliners in Beijing, have warned Evergrande not to expect a government bailout. The tabloid said Evergrande shouldn’t assume it’s too big to fail.
Evergrande employs around 200,000 people and reportedly hires another 3.8 million annually for different projects. If Evergrande fails, it won’t be the only player in China’s financial system to do so. All the institutions involved will take a hit. They’ll all have less money available to lend because their balance sheets will deteriorate.
On October 5th, a second developer missed a bond payment. A firm called Fantasia Holdings did not repay $206 million in principal of a bond that matured on Monday. Additionally, it’s reported that Fantasia did not pay a separate debt of $108 million that was also due on Monday. Ratings agencies have downgraded Fantasia and a third Chinese developer, Sinic Holdings, over risks from their deteriorating cash flow situations.
According to Fitch Ratings, Sinic is likely to default on its $246 million offshore dollar-denominated bond due October 18. Furthermore, Sinic’s local subsidiaries reportedly have already failed to make $38.7 million in interest payments on two onshore yuan-denominated bonds that were due September 18.
Why is this important? The real estate sector in China accounts for as much as 15% of China’s gross domestic product (GDP).
While it seems like a domestic problem for China, it’s never that simple. As the world’s second-largest economy, China produces many of the goods consumed elsewhere and it also imports plenty of items. In 2019, exports totaled $2.57 trillion while imports totaled $1.58 trillion.
As financial analyst Jim Rickards points out, China has kept its growth engine humming all these years mostly through investment instead of through rising consumption by its citizens.
Investment is fine if it is directed at long-term growth projects that produce a positive expected return and help the broader economy grow as well. But that’s not what China has done.
About half of China’s investment in the past 15 years has been wasted on “ghost cities”, often referred to as Potemkin Cities after their famous Russian precursor, white elephant transportation facilities, and other prestige projects that look good superficially but that don’t produce enough revenue or efficiencies to pay for themselves. Much of this investment was financed with debt. If the project itself is not revenue producing, then the associated debt cannot be repaid and will go into default. This is what we are starting to see now.
If this situation slows demand from China for trade, it’s sure to impact the economic growth picture across the globe.
The situation will hurt domestic demand in China for all types of goods. With world stock markets dominated by algorithmic trading, its highly likely market volatility will increase (perhaps precipitously) if headlines start to indicate that the Chinese economic miracle was no miracle at all but rather mostly smoke and mirrors.
Looking Forward
It’s impossible to accurately predict the future. The world is changing rapidly. Some changes are quite remarkable while others are downright frightening. Using a variety of sources, we sift through volumes of information and opinions to identify major economic trends.
We then try to identify the investing themes that will allow us to succeed over the long term within the range of possibilities that we identify. It is always important to remember that while history doesn’t necessarily repeat, the past can provide clues to future developments.
While the names of the best companies to invest in have changed over the past 100 years, the characteristics of a company that can survive world wars, trade wars, inflation, and market crashes, have remained consistent over time.
By looking at our investments as businesses, instead of symbols flashing across the bottom of a television screen, we can identify strengths and weaknesses that can impact a company’s ability to navigate the economic waters and act accordingly. While it may not be as exciting as a trade that doubles in just a couple of months, we believe that a primary focus on well-run companies that continue to increase revenues and cash flow and reward investors with growing dividends is the best approach to building long term wealth.

