Fourth Quarter 2018 Market Review

Q4 2018 –Will we have a recession in 2019?

We love the holiday season as it gives us time to visit with family and friends and step away from the market for a while, unless of course we have a market like we saw in this fourth quarter and people realize what we do for a living. With headlines like:

“U.S. stocks post worst year in a decade as the S&P 500 falls more than 6 percent in 2018”

“The S&P 500 and Dow fell for the first time in three years, while the Nasdaq snapped a six-year winning streak.”

“Major stock indexes posted their worst yearly performances since the financial crisis.”

“The Dow and S&P 500 record their worst December performance since 1931 and their biggest monthly loss since February 2009.”

We found ourselves pulled aside and being asked for investment advice or our opinion in hushed voices while celebration went on around us.

In fact, the S&P 500 and Dow Jones Industrial Average were down 6.2 percent and 5.6 percent, respectively, for 2018 which are their biggest annual losses since 2008. The Nasdaq Composite lost 3.9 percent in 2018, its worst year in a decade as well. However, these losses are not in the same ballpark as those recorded in 2008, when the S&P and the Dow fell 38.5 percent and 33.8 percent, respectively, and the NASDAQ dropped 40 percent.

For the fourth quarter, the S&P 500 and NASDAQ fell 13.97 percent and 17.5 percent, respectively, their worst quarterly performances since the fourth quarter of 2008. The Dow notched its worst period since the first quarter of 2009, falling nearly 12 percent.

A sizable chunk of this quarter’s losses occurred in December. The indexes all dropped at least 8.7 percent for the month. Traders on television and in the news had trouble pinpointing the cause of the extreme volatility: the S&P 500 was down more than 20 percent from its record high on an intraday basis on Christmas Eve, briefly meeting the requirement for a bear market, and then roared back the next session. The Dow jumped more than 1,000 points on Dec. 26 for its biggest ever single day point gain. The consensus seems to be building to chalking up December’s volatility to computer-driven trading.

Likely reasons given for the sell-off include:

  1. Concerns of an economic slowdown
  2. Fears the Federal Reserve might be making a monetary policy mistake
  3. Worries over ongoing trade negotiations between China and the U.S.

We’ll address each of these ideas below.

Reading the headlines and listening to the commentary during the December decline, you would have been led to think that the bottom had fallen out of the U.S. economy and that we were on the brink of the next Great Depression. We do not believe either to be the case. Before we provide our reasoning, let us first make sure that we are using these words properly instead of provocatively as many media sources tend to do.

The standard definition of a recession is two or more consecutive quarters of declining GDP. Since a depression is understood to be something worse than a recession, many people think it must mean an extra-long period and deeper level of decline. But that is not the definition of an economic depression.

Possibly the best definition ever offered came from John Maynard Keynes in his 1936 classic, The General Theory of Employment, Interest and Money. Keynes said a depression is “a chronic condition of subnormal activity for a considerable period without any marked tendency towards recovery or towards complete collapse.”

Keynes did not refer to declining GDP; he talked about “subnormal” activity. In other words, it’s entirely possible to have growth in a depression. The problem is that the growth is below trend. It is weak growth that does not do the job of providing enough jobs or allow a government to stay ahead of the national debt.

According to the website Trading Economics, the GDP Growth Rate in the United States averaged 3.22 percent from 1947, the end of the Great Depression, until 2018. However, according to the website Statista, the average real GDP growth from 2000, when we were in the middle of the dot.com crash, until 2017, the last annual datapoint we have to examine, was 1.97%.

Over the first three quarters of 2018, US GDP advanced at an average rate of 3.3%. If growth in the fourth quarter continues at or near that rate, one could argue that, by Keynes definition at least, we might just be emerging from an eighteen-year depression.

This does not, however, mean that the market will continue to rise unabated. As we can see the chart below of the S&P 500 from 2000 to 2018, in both 2011 (1.6% GDP growth) and 2015 (2.9% GDP growth) the stock market temporarily swooned despite continued economic growth. Again in 2018, the stock market reminded us that, in the short term, it can have a mind of its own.

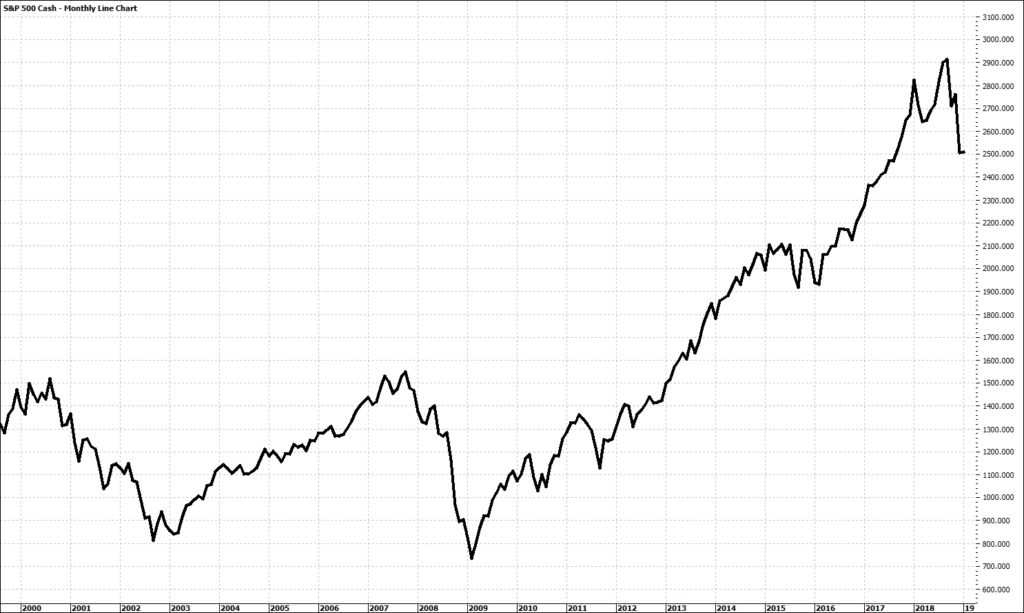
S&P 500 Monthly Chart 2000 to 2018

Interest Rates are Still Key

Despite what you may be hearing during your ride home, seeing on the news, or reading in your news feed, the Federal Reserve’s interest rate policy is still the number one issue driving the markets. In December, the policymakers raised the central bank’s benchmark borrowing interest rate to 2.5%. This was the fourth rate hike of 2018. Previously, they had only raised the rate four times since December 2015.

In a press conference following the December meeting, Jerome Powell also noted that rates this year were raised more times than expected because the economy was stronger and healthier than anticipated. But the Fed went on to lower its expectation for gross-domestic-product growth in 2019 by 0.2 percentage points to 2.3 percent.

Low interest rates have been the key ingredient in the almost 10-year-old market uptrend we have experienced since 2009 and the prospect of rising rates is if it makes other investments look more appealing, it makes price appreciation-driven growth much harder to come by. Recall that it was immediately after the January 2018 meeting when the Fed announced their plan for three rate increases that the market immediately experienced a two-week sell-off.

In addition to the rate hike and the projection of at least two more increases in 2019, Chairman Powell also stated that the Fed’s quantitative tightening would continue at its current pace. Quantitative tightening is the reversal of the quantitative easing policy the Federal Reserve, along with several other central banks, engaged in after the near financial collapse of 2008.

Quantitative easing is the process whereby central banks essentially create money by depositing money at private banks and other financial institutions and then buying securities from them, with the money remaining in those institutions. The intention, the central banks hope, is that this money will be loaned out to corporations and consumers in order to spur business activity.

In reversing the process, the central bank sells securities back to the financial institutions, thus draining money from the amount that the banks have on hand. That reduces the amount of money they have to lend, which, again, other things being equal, should raise the cost of money to borrowers, or interest rates.

In the U.S., the Fed ended its asset purchases in 2014 but continued to reinvest interest payments and the proceeds of matured bonds into new securities, leaving the size of its portfolio mostly unchanged. On June 14, 2017, the Fed announced it will begin reducing its portfolio holdings as the U.S. economy has finally shown sustained growth. The current pace is running off as much as $50 billion of the Fed’s bond portfolio each month. However, like QE before it, QT has never been done before, especially on such a massive scale. This worries many investors because the likely effect is that it will raise the cost of borrowing and reduce asset prices.

The impact of the rate increase and the chairman’s comments afterward started the reversal that wiped out the gains of 2018.

Some pundits have claimed that the Fed needs to raise rates so as to have more “ammo” to respond to the next slowdown. To that, our response is that it would seem rather foolish if, in the act of preparing for the next slowdown, the Fed’s actions directly cause one. Additionally, given the recession discussion above, we would point to how ineffective the Fed’s past accommodative policy (low interest rates plus quantitative easing) was for the economy.

We believe that individual stocks and the broader markets are driven primarily by corporate earnings and interest rates and so we would expect the volatility in the market to continue to rise and fall with every Fed statement and speech.

To punctuate this point, as we sit here writing this, the market is now up over 3% today “after the Federal Reserve chairman, Jerome H. Powell, said the central bank’s approach to monetary policy would remain flexible in the face of market turbulence and signs that the global economy is slowing.” – Source: Marketwatch

One last comment about market volatility, while causality is difficult to prove, we do believe this volatility is being driven mostly by computers.

According to an article this week in the Wall Street Journal, about 85 percent of all trading is controlled by computers. And I don’t mean that humans use computers to make the trades, I mean the computers are monitoring trading activity, market data and even political rhetoric and then making instantaneous decisions on what and how much to buy or sell. As the WSJ article put it, the volatility we’ve been seeing in the stock market is being driven mostly on autopilot.

This explains the speed with which these swings in the market are happening. Whereas a human might wait to make a move, perhaps being intimidated by the impact a big purchase or sale would have on the markets, computers are programmed to act the instant the market changes.

It is impossible to know how the stock market would have reacted over the last month if humans were still in charge. But the thought is that losses that occurred in a day may previously have taken a week, or month, etc.
The other thing speeding up trading is that the majority of the remaining 15 percent of investors who make their own trades trust the computers. When the computers start selling one thing heavily, these investors tend to jump on board, moving together like a herd.

Economists are having a tough time interpreting market volatility because of the computers. They can’t tell if the market is showing us the reality of the global economy to come, or if computers are simply amplifying normal “year-end nervousness.”

Regarding China and Trade

We believe that with news channels running 24 hours per day, they have an ongoing need to find something new and interesting to explain market activity. The trade war with China has been a favorite go-to explanation ever since President Trump announced tariffs on Chinese steel exports and other goods coming into the U.S.
First, let’s examine the facts as we know them:

According to the financial website, The Balance, in 2017, (the date of the most recent data available) U.S. exports to China were only $130 billion while imports from China were $506 billion.

The United States imported from China $77 billion in computers and accessories, $70 billion in cell phones, and $54 billion in apparel and footwear. A lot of these imports are from U.S. manufacturers that send raw materials or components to China for low-cost assembly. Once shipped back to the United States, they are considered imports.

China imported from America $16 billion in commercial aircraft, $12 billion in soybeans, and $10 billion in autos.
According to the World Bank, in 2017, Chinese exports were $2.3 trillion and accounted for 18.48% of China’s GDP, which was approximately $12 trillion in 2017. For the United States, total exports were $1.5 trillion, representing 7.94% of our GDP.

So, doing some very simple math, adding a 25% tariff to Chinese imports would represent a $126 billion tax hike to the over $19 trillion U.S. economy. While certainly not insignificant, it does not seem as important as the 46% increase in the prime rate of interest since 2016.

As far as which side has leverage in the negotiations is concerned, in 2017 China accounted for approximately 9% of our total exports while we represented nearly 22% of theirs. So, while certain multi-national businesses may be hurt in the short-run, as we saw with Apple, it is pretty clear that other than slightly higher prices for computers, cell phones, apparel and footwear, our economy is not very sensitive to any possible Chinese retaliatory measure. Additionally, many other countries would be more than capable of absorbing the demand for these goods, should the current situation drag on and the multi-nationals choose to relocate their operations in order to reduce cost.

While we don’t like making predictions, given the constant table pounding by the large U.S. companies, we believe that we will probably end up with another last minute New-NAFTA-like deal with better terms than we had before, but still with less than the President desires (a tariff-free world). Of course, post-deal enforcement is another issue.

In any event, we expect 2019 to be a very interesting year!

Read More

Third Quarter 2018 Market Review

Q3 2018 – How Long will the party last?

The stock market has many old sayings, from “buy the rumor and sell the news” to ”as goes January, so goes the year.” And let’s not forget this memorable one: “Bulls make money. Bears make money. Pigs get slaughtered.”

But one old saw from Wall Street that you probably heard recently is “sell in May and go away.” It means that you should sell your stocks in May, and come back to the market in the fall, specifically in November.

According to the folks at the Fiscal Times: “The full quote dates to 1930s London, when stock traders would tell each other to “sell in May and go away, stay away till St. Leger Day.”

St. Leger Day is dedicated to the St. Leger Stakes, the final leg of the British version of the Triple Crown in horse racing that’s held each year in late September.

Basically, English traders wanted to enjoy a long vacation—and ended up altering stock market behavior in the process.

Why? Because stocks have historically underperformed between May through October, compared to returns seen from November through April. Since 1950, the Dow Jones industrial average has returned an average of only 0.3 percent during the May to October period, compared with an average gain of 7.5 percent between November and April, according to the Stock Trader’s Almanac. A less-pronounced “sell in May” effect is present in the Standard & Poor’s 500-stock index as well.”

However, in the past 6 years from 2012 through 2017, following this strategy would have made you miss gains ranging from just 0.27% to 12.99% in the DJIA. And in 2018, while we haven’t yet reached the start of November, the stock market rewarded those who stayed invested with the DJIA returning 10.64% through the end of September. During that same period, the S&P 500 and NASDAQ Composite were up 10.98% and 14.42%, respectively.

It is interesting to note that, in a turn-about from recent history, this past quarter saw the Dow Jones Industrial Average (+9.6%) and S&P 500 (+7.70%) outperform the technology heavy NASDAQ Composite (+7.4%). This was a result of weakness in some of the FAANG stocks (Facebook, Amazon, Apple, Netflix, and Google) that have been propelling the markets, especially the NASDAQ, higher for so long,

Bonds returned 0.08% in the quarter as measured by the S&P U.S. Aggregate Bond Index. This index includes U.S. treasuries, quasi-governments, corporates, taxable municipal bonds, foreign agency, supranational, federal agency, and non-U.S. debentures, covered bonds, and residential mortgage pass-throughs. Commodities returned -2.08% based on the Dow Jones Commodity Index.

As we sifted through the news, two themes kept popping up as the major equity indices set new all-time highs

  1. How long can the longest running bull market in history continue, and;
  2. Which marijuana stocks will create the next generation of millionaires?

We will address these two items first before updating the real issues that concern us.

Welcome to the Longest Bull Market in Wall Street History

That was actually the title of an article posted on MarketWatch on August 22nd, along with the obligatory table of “Bull Markets Since WWII” showing that “Since March 9, 2009, which marked the low of the financial crisis and which many consider the birth date of the current bull market, the S&P 500 SPX…has advanced 320%, the Dow Jones Industrial Average DJIA…has risen 290% and the NASDAQ COMP…has soared 520%.”

But there is a problem with this article: there is no hard and fast definition of what constitutes a bull market or when it begins. As a writer at “The Reformed Broker” points out:

“It’s become likely that we are in a secular bull market for stocks. We do not measure secular bull markets from the bear market low of the prior cycle. The 1982-2000 secular bull market is measured from the day in 1982 when stocks finally took out their 1966 high. It had been a 16 year secular bear market until closing above those highs, and stocks never looked back. We do not date that bull market from the lows of 1973-1974 that were the nadir of the prior bear. Nor should we use 2009 as our starting point for the current bull market. 2009 was merely the cycle low of the prior bear, not the starting point of the current bull.”

So, according to the analysis by The Reformed Broker, the current bull market is actually only three years old, not seven and, if it were to end today, only three other bull markets measured this way would have shorter durations. This viewpoint should be solace for investors who find reason to worry about the age of the current bull market, despite the axiom that bull markets don’t die of old age.

Pot Stocks Continue to Go “Higher”

Just like bitcoin and other cryptocurrencies last fall, “pot stocks” are now skyrocketing as the general public has suddenly become enamored with the possibility of explosive profit potential within this new industry.

On September 19, Tilray (TLRY), a Canadian medical marijuana company, rose more than 50% in a single trading session. At one point, its shares had more than doubled in just a few days. It’s currently valued at roughly 500 times sales, about 300 times book value, and around 800 times its negative earnings before interest, taxes, depreciation, and amortization (“EBITDA”). It has a market cap of roughly $14 billion and sales of less than $21 million. No business anywhere, in our opinion, is worth such valuations.

If you recall, last year there were a dozen companies that reaped rewards by putting “bitcoin” or “blockchain” in their name. Long Island Iced Tea Corp. rocketed 458% after changing their name to Long Blockchain Corp.

The Tilray example is part of the wider bubble in marijuana-related stocks. The number of cannabis news stories recently overtook the number of cryptocurrency news stories, according to data compiled by Bloomberg.

It is apparent that the crypto mania that gripped the investment world last year has now been replaced by a manic demand for marijuana related stocks.

Of course, it goes well beyond crypto and marijuana. From the housing bubble in 2008, to the dot com bubble in 2000, Gold in the 1970’s all the way back to the tulip bubble of the 1700’s, humans have always had a tendency to be gripped by investment manias.

Manias like these don’t end well for most of those involved. Parabolic rallies are typically followed by huge declines of 50%… 80%… or more. That’s exactly what’s happened to bitcoin and other “cryptos” over the past several months. And we expect pot stocks will eventually suffer a similar fate.

The aftermath however, can present buying opportunities for the patient investor who is willing to accept that the fast money has already been made. Amazon, after all, was trading for $40 per share as late as December of 2004, long after the market had started to recover from the “dot-com” bust.

We believe that if we continue to analyze the universe of stocks for those companies with better than average sales, earnings and profit margins, marijuana companies with solid long term potential may eventually make it to our screens. In the meantime, we are happy to watch from the sidelines.

Trade (Wars)

On the trade front, Mexico, Canada, and the U.S. reached a new trade agreement. Most opinion makers seem to think the new accord is better than NAFTA. The market breathed a sigh of relief.

Earlier in July President Trump and Jean-Claude Juncker, the chief of the EU’s executive arm, the European Commission, held a joint press conference in which both leaders promised to work towards zero tariffs on non-auto industrial goods; to reduce barriers and increase trade in services, chemicals, pharmaceuticals, medical products, and soybeans.

They also agreed to reform the WTO and that the European Union will buy more liquefied natural gas from the United States. Perhaps most importantly, they agreed to refrain from imposing new tariffs on one another while they work together on these issues.

While this agreement sounds promising, it should be noted that nothing specific was established or signed and as Goldman Sachs put it:

“The lack of specifics in today’s U.S.-EU announcement raises the possibility that the negotiations could falter at a later stage, as U.S.-China negotiations did earlier this year.”

Hopefully, with an agreement with Mexico and Canada completed (although not approved yet by the congress), momentum will build toward reaching an agreement with the EU which would then put pressure on China to possibly rethink their current strategy.

Each agreement which takes away the implementation or threat of tariffs will be positive for the market and, hopefully, beneficial for US companies most impacted by these agreements.

Currency

Interestingly, the dollar has appreciated sharply this year despite the various “trade wars” referenced above. Coincidentally with the US imposing tariffs on Chinese solar panels and washing machines on January 22nd, the dollar began a sharp run higher.

A rising dollar makes imports cheaper which could, at least for those imports priced in foreign currencies, offset to some degree the inflationary impact of tariffs.

North Korea

Talks with North Korea continue as both sides jockey for a win-win outcome that makes neither side look like they surrendered. This is a situation that has been festering since the 1950’s so a quick solution, like the Mexico and Canadian Trade agreement, would seem highly unlikely. However, it is promising that both the North and South have continued to work towards a de-escalation of border tensions and we haven’t seen a North Korean missile test since November of 2017.

Federal Reserve Policy

In our Q2 letter, regarding the Federal Reserve Bank’s policies on interest rates, we wrote: “We see these Fed moves as the #1 driver of the overall volatility in the market for several reasons:….”

Our opinion has not changed, interest rates not only impact consumer spending decisions about homes, autos and luxury items, but they also impact business investment as well. Businesses typically finance their large capital expenditures with debt so an increase in interest rates will either increase the cost of the expenditure or curtail spending altogether. Either way, neither is good for the continued private sector economic growth that we need for both higher wage growth and a larger workforce.

Since August 20, the yield on the 10 Year Treasury has leapt from 2.83 to 3.22 on October 1st. This is not an insignificant move and signals a dramatic increase in borrowing costs which eventually make their way into the economy. For those of you wondering, the ten-year yield was 3.43 on January 1, 2008.

We have written before that the Fed feels that they need higher interest rates in order for the Fed to “reload” in advance of the next economic downturn. It is our opinion that they should have started this back in 2010 at a much more gradual pace to reach a “neutral stance”. In the Fed’s terms, those are rates that are neither accommodative nor restrictive to economic growth.

We readily admit that we have no idea as to when rates reach a level of neutrality, which is why we will never be nominated to serve at the Fed. We only observe that historically it appears the Fed didn’t know what level neutral was either and only found out when it went too far and sent the economy into a contraction. Motivations driving the Fed aside, the speed and magnitude of further rate increases demand ongoing attention.

One last comment on interest rates is in order. A lot has been made in the press recently of the yield spread between 10 and 2-year maturity Treasury bonds. Over the last 30-40 years, when this spread went negative, meaning that short term (2 year) yields were higher than mid-term yields (10 year), a recession followed in fairly, short order. While this spread is still positive, it is quite close to going negative. If, as it has in the past, this foreshadows an imminent recession, then it’s time to be extra cautious on the stock market as well.

Trade negotiations, geo-politics (short of nuclear war) and even election cycles will continue to create volatility shocks in the market. However, we believe that the biggest threat to the market remains the Fed’s monetary policy. In a recent article posted on MarketWatch, researchers calculated that stocks have suffered around $1.5 trillion in losses following speeches from the Fed’s Chairman Jerome Powell.

Powell has hosted three news conferences this year following meetings of the rate-setting Federal Open Market Committee. which were followed by an average decline of 0.44 percentage points in the S&P 500. Other talks and speeches have resulted in an average fall of 0.40 percentage points, with losses coming in five of the past nine prominent speeches or Congressional testimonies Powell has delivered.

The stock market knows that, over the long term, it is the economy that drives growth in sales and earnings and that sales and earnings growth ultimately drive long term performance in equities.

We believe it is our role to continue to identify those companies who can thrive in different economic conditions and buy them when they are trading t a favorable price. Watching business fundamentals instead of charts, newsletters, or headlines, we expect to be rewarded over the long term with less volatility and better sustainability.

Read More