Dot Plots, Debt and Dollars
Let us start 2022 with wishes to you for a New Year that is filled with hope and happiness.
2021 provided a wild ride, whether it be in stocks, real estate, the economy, Covid, or quite frankly, anything else. It was all wild. Overall, markets finished the year the way they started, near record territory. However, the ride was anything but smooth as volatility raised its head with every new headline. We saw a series of sharp selloffs in the S&P 500 throughout the year, followed by strong rebounds. This pattern created problems for many short-term trading strategies as sales were triggered by the initial drops which caused them to miss the subsequent surges higher in the following days and weeks.
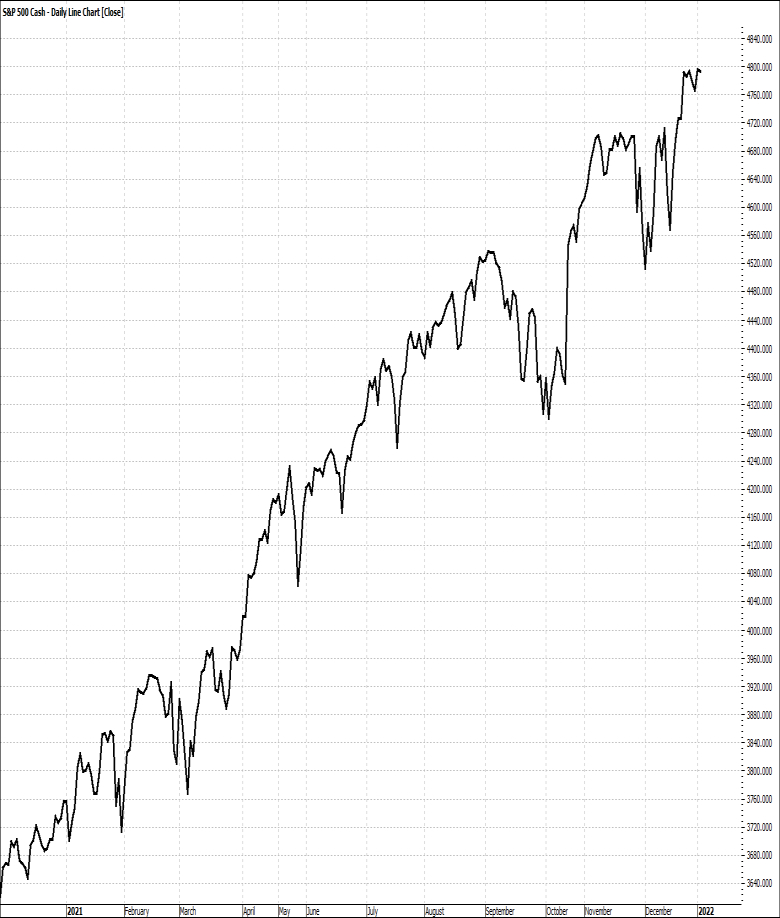
S&P 500 Daily Chart 2021
The tech-heavy NASDAQ Composite, was even more volatile and unlike the S&P, did not finish the year at a new high, although the performance was still quite strong.
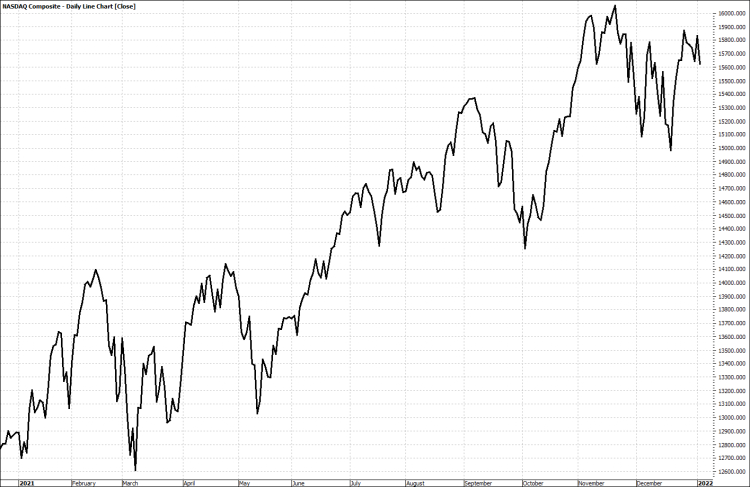
NASDAQ Composite Index Daily Chart 2021
For the year, the best performing sectors were led by Energy, Real Estate and Technology. Energy leadership was not surprising given the rise in oil and natural gas prices. The real estate market has been on fire over the past year and a half or so, and clearly this sector has benefitted from it. Low supply and increased demand put a twist on the market but has enabled real estate companies to produce more revenue. Unlike other years, the technology sector did not come out on top, and ended up third behind energy and real estate as fears of rising interest rates triggered multiple selloffs throughout the year.
The worst performing sectors were Utilities, Consumer Staples, Industrials and perhaps counter-intuitively, Biotechnology.
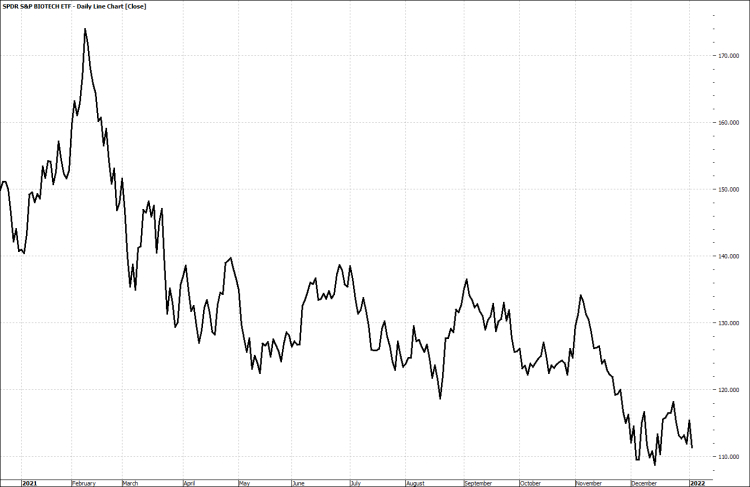
SPDR S&P 500 Biotechnology ETF (XBI)
In the case of the first three sectors, the key factors to their performance are inflation and interest rate worries along with previous over-valuations relative to the other sectors, particularly energy and real estate.
Regarding Biotech, analyst Marc Lichtenfeld put it very succinctly in a recent post.
“There is no other way to put it. Biotech stunk in 2021.Other than a brief jump at the beginning of the year, the sector was rotten for the next 10 months, underperforming the S&P 500 by a stunning 41 percentage points.”
Biotech had a big year in 2020 as the entire world was focused on the sector and its work in COVID-19. However, markets often revert to the mean, swinging strongly in one direction, then back in the opposite direction soon after.
For example, the long-term average annual price appreciation of the broad market is only about 8%. But markets usually don’t rise 8% in a year, 9% the next, 7% the following year. They’ll jump 20% one year, drop 11% the following, rise 15% the next, etc.
As a long-term investment, biotech companies still possess potentially large catalysts, with opportunities for major breakthroughs in the treatment of cancer, Alzheimer’s and arthritis. Any news about clinical trial data, FDA approvals, or acquisitions can push a stock up 50% to 100% in one day. But in the short-term you can have a year like 2021 where, unless your name was Pfizer or Moderna, you watched the value of these holdings drop precipitously.
Looking forward to 2022, the headwinds are still the same although some of the uncertainty has lifted as we will review below.
All Eyes Still on the Fed
Many clients have questioned how the markets can still be going up when it seems that everything around us is falling apart. We admit that at one time in our investing lives, we asked the same questions, but over time, those questions have been answered. And while we may not like those answers, we must choose to either accept them or move on to a different line of work.
Wall Street, as with many big industries, is a cynical business. They cling bitterly to their rules, based on long held beliefs and will act accordingly in ways that often seem illogical.
In the case of the economy, interest rates, and the stock market, economic growth should in general be good news for the stock market, and it should also generally mean upward pressure on interest rates. A weak economy should be the opposite. However, those are long term factors, and as we have experienced since the 2008 – 2009 bear market, Wall Street also welcomes interest rate cuts and dislikes interest rate hikes.
We have commented, almost to the point of excess, that the Fed under Janet Yellen should have started raising interest rates back in 2013 after the S&P 500 recovered its previous price levels. With an annual increase in rates of less than 1% per year, we could have easily been back to around 4% by the end of 2019. But in a world where we save bankrupt businesses from bankruptcy, watch Federal Reserve Officials rotate jobs between the reserve bank, corporate banks, and the Treasury, and “everything is political”, the Fed punted. It used inflation, specifically the lack thereof, as an excuse to keep rates lower, longer than most economists would have imagined.
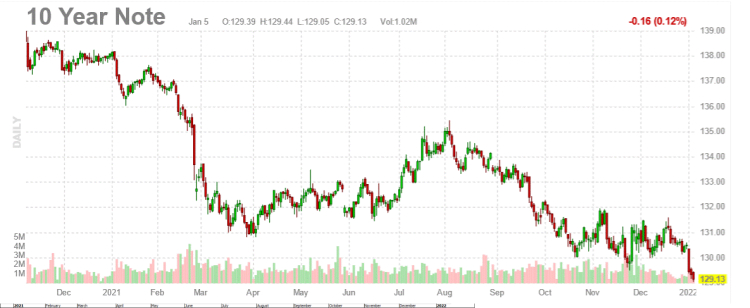
But now rising inflation has become a hot topic and has forced the Fed to start delivering on its intentions for higher interest rates. After months of whispering about an end the massive purchases of Treasury bonds and mortgage-backed securities it’s been making to shore up the economy during the pandemic, they started tapering in November 2021 by scaling back total purchases by $15 billion a month, from $120 billion to $105 billion. The Fed decided to double the pace at which it tapers on December 15th. Rather than $15 billion amount, the Fed will henceforth reduce purchases by $30 billion every month. At that pace it will no longer be purchasing new assets by early 2022.
While these are not direct hikes in interest rates, the actions reduce the demand for these securities which means that their prices should drop which increases the yields on them.
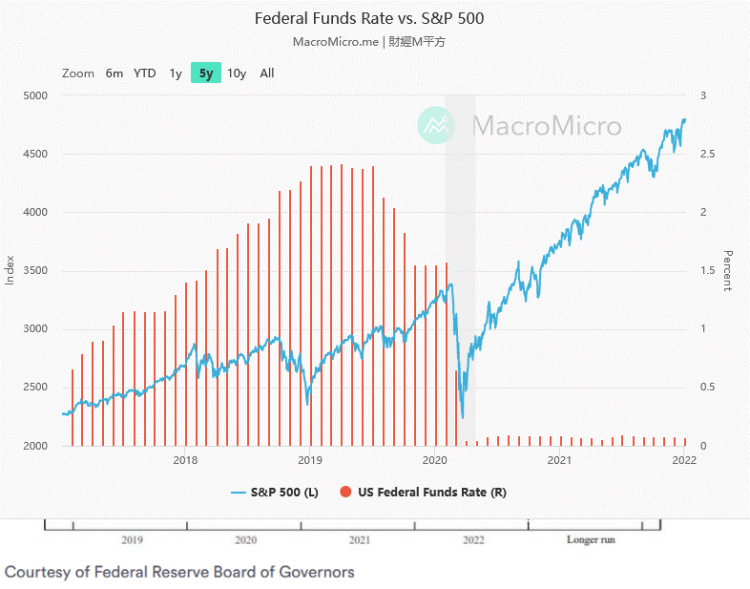
We see this reflected in the futures market which reflects pricing:
A term that we expect to get bandied about a lot this year is the “Dot-Plot”. The dot plot is a chart that records each Fed official’s forecast for the central bank’s key short-term interest rate.
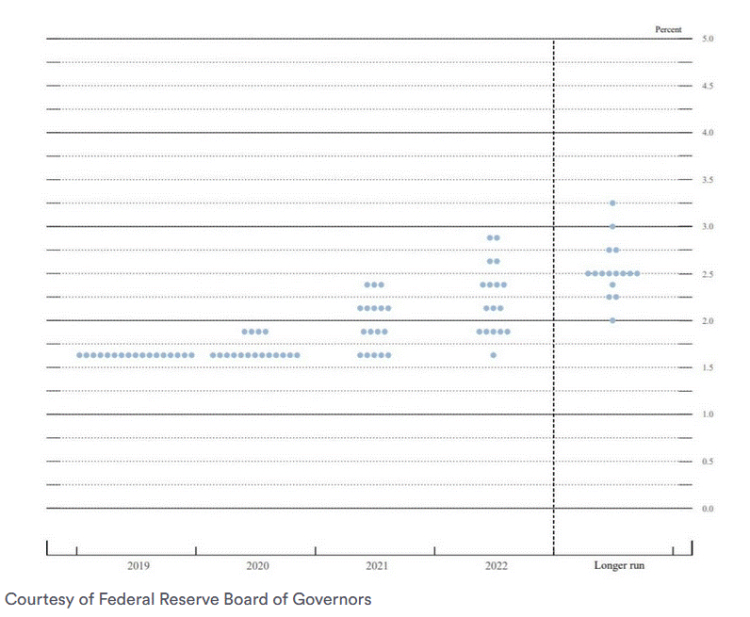
On the Y-axis is the Fed Funds rate, and on the X-axis is the year for which the officials gave their forecast.
The dots reflect what each U.S. central banker thinks will be the appropriate midpoint of the fed funds rate at the end of each calendar year, should the economy evolve as they expect. Officials also provide a dot for three years into the future, as well as a dot for the longer run.
Each dot represents one Fed official – from Powell to Governor Lael Brainard, from New York Fed President John Williams to St. Louis Fed President James Bullard. Of course, it’s all kept anonymous, and no one knows which official is which dot.
With interest rate hikes officially on the table, the dot plot will become a topic of conversation as economists, analysist and pundits try to interpret the graphs and predict the Fed’s next move, probably before each meeting. If you are interested in learning more about the dot plot, you can find a good article here.
While the Fed originally spoke of three actual rate hikes of 0.25% in 2022 during their December meeting, recent statements by several members have hinted at now only seeking two. Sadly, we must still look at the situation not based on logic, but on the environment we live in today.
2022 is an election year and current polling is not being kind to the current administration. Given the reaction by the market the last time the Fed started to raise rates more aggressively, we don’t think it would be helpful to the current administration politically to have a broad sell-off occur before the mid-terms in November. Remember, the current Treasury Secretary used to sit in the same chair held by Jerome Powell.
We would be surprised to see any rate hikes before November, and at least one of us is predicting no hikes at all this year.
But what if we are wrong and we see two or three hikes in 2022? In researching for this letter, we came across a study by Bill Madden & Sandy Totten for Russell Investments which found that U.S. equities did well when rates rose slowly (i.e., less than 1% per year), but not so well if rates rose rapidly. So, if the Fed limits each rate hike to .25%, the markets should behave in 2022.
One caveat though, their study was done well before the emergence of algorithmic trading systems that now dominate daily market movements. Remember that these systems do not trade on fundamentals, most scan headlines and use artificial intelligence to quickly adjust their positions in anticipation of the expected market reaction. Unfortunately, their trade adjustments often become the expected market reaction. So, while the conclusions of the Russell Investment study could very well be still valid on an annualized basis, the daily, weekly, and even monthly volatility will more likely be exaggerated.
Economically things are improving, but we are still nowhere near a stable economy that could handle an aggressive Fed policy without causing more disruptions. Plus, as we have stated before, the Fed needs inflation in order to manage the massive debt we have accumulated. For further reading about this, we refer you to our Q2 2021 letter which you can find posted on the Suminvest.com website under the insights tab.
China
When it comes to bringing down the world economy, no other country besides the U.S. has the ability to disrupt as much as China.
Whether it is disrupting domestic manufacturing, predatory investment activities, or failure to contain an infectious virus, very few years have gone by where China has not made the news. By nearly all measures, China has become a global superpower in this century. It has the largest population in the world, it has the second largest economy after the United States, and the third largest supply of nuclear weapons after Russia and the U.S. This means that the actions of the Chinese government can have tremendous impacts on the global economy.
Unlike Russia, which became a superpower in 1949 when it detonated its first atomic bomb, China became a superpower through engagement with the West, particularly the United States and Western Europe. Our leadership truly, if not naively, believed that if we increased trade, promoted cultural exchange, and opened up our universities to Chinese students, that the government of China would eventually become more western style, probably more like the E.U. than the U.S., and the world would flourish in a new environment of peace and prosperity. Spurred on by the prospects of a new market with a billion customers, large multi-national companies climbed over themselves to invest in China, very often signing away protections they would demand from other countries.
However, many in the west are waking up to the fact that things have not quite worked out as we envisioned. China has grown rich by accessing western technology through one-sided trade and joint venture deals, adopting our manufacturing systems, and becoming exporter to the world. They took advantage of our desire to buy cheap stuff and lazy corporate leadership who found it easier to outsource production overseas than to lower costs through technology and innovation. Instead of becoming more like the West, China has recently appeared to be even more Communist, more ideological, and more threatening than any time in our lifetimes.
However, being a superpower does not guarantee economic success. Many of us still remember when the Soviet Union collapsed in 1991, not as a result of military actions, but due to the massive economic mess that centrally planned countries seem to inevitably create.
Because of their trading relationships with the West, China is in a much better position economically than the Soviet Union ever was. But they still face a host of problems including excessive debt, collapsing real estate markets, and a looming demographic problem caused by years of their one-child policy which created a gender imbalance in their population because of a cultural preference for boys.
In addition, the Chinese growth “miracle” primarily funded by western corporations like Nike, Apple, and many others, seems to be leveling off as countries like Malaysia, India, Vietnam and Indonesia are copying China’s strategies and thereby displacing it as the world’s low-cost manufacturer. As a result, China’s economic growth is hitting a wall.
Last quarter we introduced Evergrande as a potential catalyst for a China-induced financial pandemic. As of this writing, the situation continues to deteriorate. In late December Evergrande was said to have missed another deadline to pay back coupon payments on its bonds. As a result, Fitch Ratings downgraded China Evergrande and its subsidiaries to “restricted default,” meaning that the giant real estate developer has failed to meet its latest financial obligations.
In what could only be described as an act of desperation, the developer recently asked employees to lend it money (which it hasn’t paid back). The company has been hit with a salvo of lawsuits from creditors and its shares have plunged more than 80% year to date. Companies up and down the Evergrande supply chain are not getting paid.
We do not expect Evergrande to explode into a “Lehman moment” like we experienced in 2008. The government will do its best to contain the collapse through media manipulation, forced bank write-offs of the bad debt, bankruptcy of many Evergrande suppliers, and even some high-profile arrests of Evergrande executives. The table is already being set as on January 4th it was reported that trading in Evergrande’s shares was halted following a report that the Danzhou government asked the company to tear down 39 “illegal buildings.”
But as with anything so intertwined both throughout the Chinese economy as well as the global economy, eventually shockwaves will be felt at the multi-national level. Evergrande isn’t the only Chinese development company downgraded by Fitch. The ratings agency recently placed a “restricted default” label on Kaisa Group Holdings (HK: 1638), after it neglected to pay its bondholders $400 million.
Additionally, for many years as part of their fabled “Belt and Road” initiative, China’s lenders have scoured the developing world for new borrowers, in part to help the country gain strategic leverage in regions that felt neglected by the West. Several countries in Africa, Asia and Latin America are deeply in hock to Chinese banks and many of those loans could become toxic, too. A recent example of this was the Hambantota Port Development Project in Sri Lanka where, after struggling for years to make payments, the Sri Lankan government handed over both the port and 15000 acres of land around it to China for a period of 99 years.
This may have been a strategic move toward more global power and influence by the Chinese government. But, as we remind our clients all the time, cashflow is king and non-performing assets will eventually serve as anchors on a sinking ship. Each day we scan our news feeds for more clues as to what is really happening. We are seeing a lot of activity by the People’s Bank of China, which is part of the government, not “independent” like our Federal Reserve, through which they are frequently injecting and also withdrawing billions of dollars from their financial system in order to stabilize liquidity needs. Additionally, we are seeing some headlines on Chinese central bank policy remaining accommodative and reiterating its plan to take actions to stabilize the economy in 2022, which likely means more stimulus is on the way. All of which brings us to the next financial headwind.
Evergrande is just part of a much bigger problem. As we mentioned earlier, China has a huge debt problem. China’s total debt to gross domestic product (GDP) exceeds 322%, with a credit imbalance of over $52.6 trillion in banking assets:
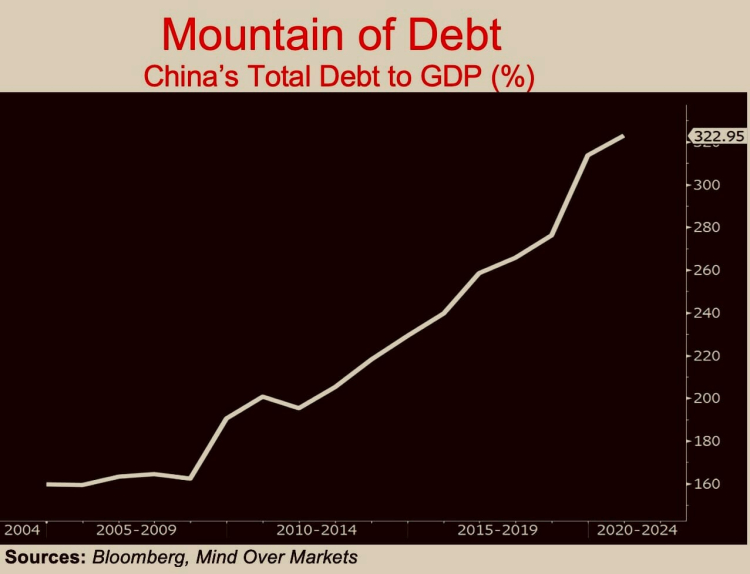
For perspective, the U.S. Debt to GDP ratio is “only” in the high 120’s. As we have mentioned before, historically at ratios above 90%, additional debt produces negative returns. Meaning that each new dollar borrowed will produce less than a dollar of growth. We have experienced this here in the U.S. which is still one of the most capital efficient economies in the world, so imagine what must really be happening with the Chinese economy.
While some may look at the situation in China and breathe a sigh of relief that we might see the end of the “Chinese Miracle” (which was really not a miracle but an economic case study in growth from a massive third world economy to a modern day, low-cost export economy). It is important to understand the major geo-political consequences of a weakened super-power.
During the Sixth Plenary Session of the 19th Central Committee of the CCP on November 10, 2021, the CCP Central Committee passed a “historical resolution” elevating President Xi Jinging to the same stature as Mao Zedong and Deng Xiaoping and essentially making him “President for Life.”
Our reading of history tells us that dictatorships can be tolerable in the best of times and terrible when things go bad. We already have seen the end of Hong Kong’s democracy over the past two years, their resolve to reclaim Taiwan as part of the mainland and their claims to the entire South China Sea. This has all been part of a long-standing plan to be the lone power in the Western Pacific and South Asia.
So far, as their economic power has been rising, they have been able to engage in a “nudge, but don’t shove” approach designed to keep the West at ease regarding their ambitions. However, what happens when your economic power begins to stagnate, or even decline?
If that’s the case, and they realize it, then they may choose to become more aggressive in their pursuit of regional dominance. After all, nothing can rally a population during a period of economic malaise like some good old fashioned foreign intervention. With the perceived weakness and war-weariness of the United States after last August’s events in Afghanistan, they just might think that now is the best time to move.
Is a shooting war inevitable? Probably not, but desperate times often lead to desperate measures and President Xi has a lot on the line. This will be something that we will be tracking throughout the year.
Inflation
While this subject really belongs in the Fed discussion, we know that it has developed a life of its own lately so we will address it separately.
Based on the latest Personal Consumer Expenditures data, which is the Fed’s preferred measure of inflation, it looks like the rise in price increases may be starting to stabilize.
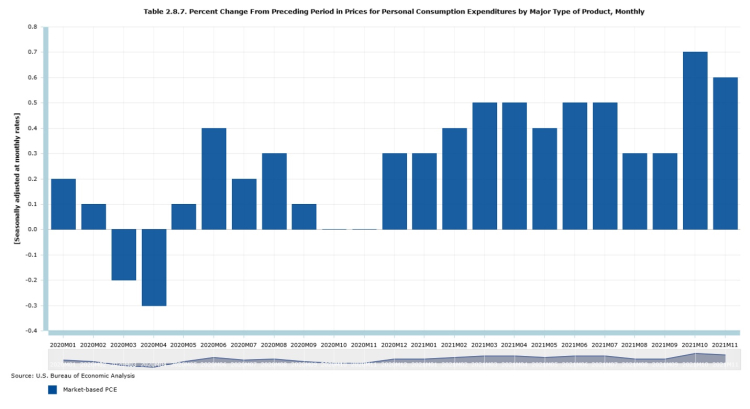
Note that we are not saying that prices are dropping, we are saying that the prices we are paying are not increasing as fast as before and that they may begin to rise at a smaller rate heading into 2022.
Unfortunately, this means that prices are still rising and the increases we have experienced are not going to recede. The key reason for this is our energy policy which has driven oil back up to the high $70’s with many experts whispering about breaking $100 by 2023.
As we discussed in our previous letter, oil and natural gas are the backbone of our economy, providing not only heat and transportation fuel, but also the raw materials for almost everything we touch, including the computer I am typing this letter on. Energy production has been hard hit, especially in the last 12 months causing prices to rise as economic activity continues to recover from the 2020 lockdowns.
So, it should be no surprise that much of the inflation we have seen is energy related.
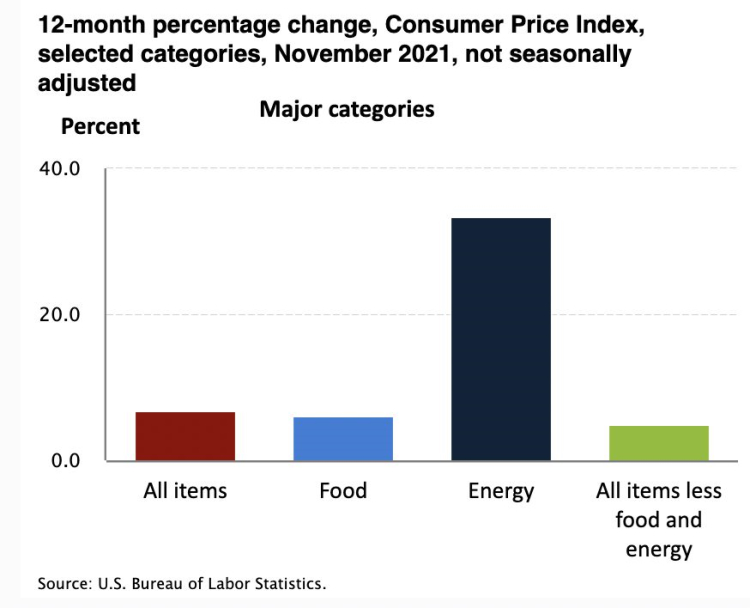
As consumers we can expect to be hit with the double whammy of direct inflation by paying higher prices at the gas pump and to our local utilities and indirectly through price increases of nearly everything else we buy as producers pass along the increased prices of materials, components, and transportation to us. The only winners here are your state and local governments who will now collect a higher sales tax on the same basket of goods you bought last year.
As we pointed out before, these price increases are not being driven by a booming economy but by a toxic combination of distortions in the availability of goods, components, and raw materials from the uneven reopening of economies and industries as well as excessive stimulus spending where private businesses are being forced to compete with government assistance in trying to get people back to work.
Eventually this will have an impact on economic growth, although it will be hidden behind the headline numbers for quite a while as an increase in costs reflect positively in GDP.
As an example, if I used to pay my neighbor’s kid $10 to mow my lawn and now, I have to pay $15, that would look like economic growth even though the size of my lawn has not changed, nor has the amount of time it takes to mow, or the amount of gasoline needed for the lawn mower.
This is a classic example of “Stagflation”, and we fear that we are headed “back to the future” with a 1970’s style economy with high prices, slow real growth and even more government spending.
The good news is that we’ve seen this before and we know that the markets have survived in this type of environment.
While you may be inundated with emails for gold, crypto currencies, and one-stock retirement portfolios, please consider the following:
S&P 500: Dividend Growth Rate by Decade Versus Inflation
| Decade | Total Growth | Annual Growth | Inflation |
|---|---|---|---|
| 1950s | 60.5% | 4.8% | 2.0% |
| 1960s | 72.7% | 5.6% | 2.3% |
| 1970s | 78.8% | 6.0% | 7.1% |
| 1980s | 95.6% | 6.9% | 5.5% |
| 1990s | 49.1% | 4.1% | 3.0% |
| 2000s | 36.0% | 3.1% | 2.6% |
| 2010s | 93.6% | 6.8% | 1.7% |
Source: Jody Chudley, “An Investor’s Best Defense Against Runaway Inflation”
What this table is telling us is that in six out of the last seven decades, the growth rate of dividends paid by S&P 500 companies vastly outpaced inflation. This means that irrespective of price gains or losses, the income generated from owning the S&P 500 has grown faster than the rate of inflation.
Even during the 1970s, when annual inflation averaged 7.1% for the entire decade, the 6% average annual growth in dividend income of S&P 500 companies very nearly kept pace.
At the risk of sounding like a broken record, a stock portfolio built around high-quality companies with growing sales and increasing earnings that reward their shareholders by paying a dividend that increases over time is a tremendous, time-tested hedge against inflation.
Dividend portfolios performed very well last year as investors sought streams of income in a zero-interest rate environment or defensive positions in a period of high inflation. While we do expect volatility to impact share prices over the short term, we continue to focus on the fundamentals of the company behind the stock symbol and hold those that have the greatest potential for long term success.
As always, it is a pleasure to serve a wonderful group of investment clients and we look forward to working with you as we navigate the challenging waters of 2022.

