In 2015, we wrote several essays about dealing with volatility in the stock market. Now, we’re doing what we would want if we were in your shoes… We’re sharing them again – with relevant updates – to provide some perspective when it comes to growing and protecting wealth.
In part 1, I tried to make the case that trying to time market corrections was very tough. Usually the effort leads to a lot of whipsawing in and out of the market. At the end of the day you’ll likely be staring at your statement and wishing that you’d just stayed in. In fact, in 2014 – 2016 we tested a system created by a professor from a major university. In live trading, with our own money, it severely underperformed our non-tactical, long strategies by a substantial amount.
While corrections are probably best just handled by turning off the television for a couple of days, true bear markets can be much more stomach churning. One thing to keep in mind is the mathematics of portfolio recovery.
For example, if your portfolio drops 20% within any time frame, you’ll need a 25% gain to get back to pre-correction levels. While this is a high bar as far as returns go, we have seen periods where the market has given us such returns. However, if your investments drop 50% in a bear market you’ll need a 100% gain to get back to even.
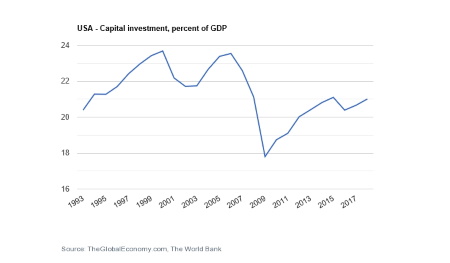
From the market lows in March of 2009, it wasn’t until early 2013 that the market got back to the previous highs that were reached in 2007. Therefore, it makes sense to look for ways to mitigate the damage to your wealth caused by bear markets. In this post, I will look at what I call “technical” strategies that are reactionary in nature and are based on some type of a trigger that informs you that it’s time to act. In Part 3, I will examine “structural” strategies that are based on a more holistic approach to building and storing wealth. Neither type of strategy is perfect, and these posts are meant to educate and empower you by making you aware of the different ways that you can avoid being a victim of Wall Street’s machinations. They are not meant to be recommendations or advice.
First and foremost, at the onset of any correction, ask yourself if the market environment has changed.
Are the economic numbers consistent with the generally accepted state of the economy? Has there been an act of aggression (Iraq invading Kuwait, 911, Crimea etc.)? Have we seen a major economic event such as a debt default by a country (Greece, Spain, Russia, etc.) or major municipality? What we are looking for are clues as to whether this is a normal downward blip within a long-term upwards trend (see part I) or a reaction to a potentially calamitous change to the economic environment.
Keep in mind that based on the data published by Ned Davis Research, we should “expect” to see a moderate correction about every 18 months with a more severe correction occurring once every three to four years on average. So, it may be useful to see if the timing of this decline fits within that time frame relative to the last one.
Next consider your personal timing.
If you are 30 years old and contributing to a 401K with no plans to touch that money for at least 30 years, that four year time span is not highly significant and, although it might hurt to look at your statements, it really doesn’t impact your life that much. In the book, Triumph of Optimists, by Elroy Dimson, Mike Staunton and Paul Marsh, the authors point out that despite all the upheaval including the 1929 crash, two world wars and the 1970’s oil shocks, the US stock markets were up 1.5 million percent in the twentieth century.
In other words, a simple buy and hold strategy over an obviously very long term yielded positive results.
In a world where we get upset when a website takes an extra 1/2 second to download, it is easy to start making knee-jerk decisions instead of looking at the bigger picture in proper perspective.
However, if you are 60 and you need to start taking withdrawals on your equity investments to finance your retirement, then that four years can be devastating both emotionally as well as financially, and you have to make some reasoned decisions fairly quickly. Ideally, you would want to have a plan in place that takes the need for withdrawals into consideration long before you’re staring at 600 point drops that (and I speak from experience) will most certainly cloud your judgment.
From a technical standpoint, you can use a circuit breaker type of system to limit your downside risk.
Trailing stops work very well in that they are always on alert and if you stick to them, they will keep you from selling too soon and help keep you from holding too long. For individual stocks and ETF’s, many people use a 20 – 25% trailing stop on the individual security. You can read more about trailing stops here.
One word of caution here, many trailing stop strategies recommend placing a trailing stop order with your broker to take away the emotion when the stop price is hit. I disagree with this application of the strategy. Given the volatility that we have seen in the market, it is very likely that your stock could open below your stop price in the morning but climb right back up above it by the end of the day. If you have a trailing stop order in with your broker, that stock will be sold as soon as the stock is triggered. I recommend using only end of day pricing to determine if your stock price has been reached and simply putting in an order to sell at the market the next day.
For broader market funds and sector ETF’s like those that are currently being pushed as “the answer,” there are simple technical indicators that will stop you out before the decline becomes too severe. Here we are focusing on big trend signals that are SIMPLE, easy to understand and rarely triggered.
In that last sentence, SIMPLE is not a cute acronym, it is highlighted as an important point. One of the worst things to happen to individual investors over the last 20 years was the creation of affordable charting software. When I was teaching option strategies, I would constantly get pulled aside by some excited student (members of certain professions were the worst) who had just developed the ultimate timing system. It usually looked like this:
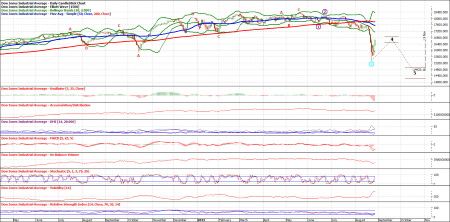
This is NOT simple, nor does it usually work. Remember, there are and have been thousands of analysts, both human and electronic, trying to come up with the perfect market timing system for decades. It is highly doubtful that you, with your $200 charting software, have stumbled upon something that they overlooked.
Two very simple circuit breaker systems are Simple Moving Averages and Trend Identification. For a huge supply of great articles on using Simple Moving Averages, I refer you to @Meb Faber (http://mebfaber.com/). Meb is a smart guy who among other achievements, developed a very elegant timing system that he makes available for free on his site.
Trend Identification is also very simple and easy to understand but takes a little more work and possibly some $200 charting software.
To use Trend Identification to identify potential crashes, we first need to understand that a trend in Wall Street lingo is a series of higher highs in the market along with higher lows as depicted here:
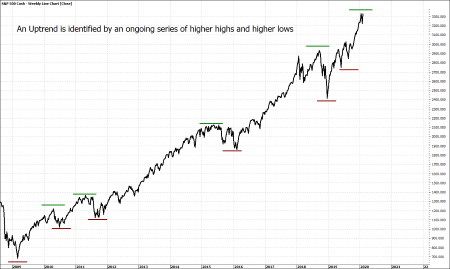
So, all we are looking for is a point where we no longer have that trend in place. The chart above is the S&P 500 Index using weekly data, I prefer doing this on a chart that plots the market on a month by month basis as it will emphasize the larger trend taking place and minimize the noise that could cause an emotional knee-jerk reaction.
Note that the growing influence of computerized, systematic trading strategies, or “robot” trading, will probably increase the size and frequency of short-term market swings now and into the future if left unchecked. There are three broad types of these trading systems: index robots, high-frequency robots and rapid response robots that approach the market from different points of view. The rapid response robots scan headlines, speeches, disclosure documents and even tweets and then place trades that attempt to get ahead of the market based on their algorithms. The latest swings from the Coronavirus headlines are a good example of this as each day brings contradicting headlines and the markets are driven up or down in response.
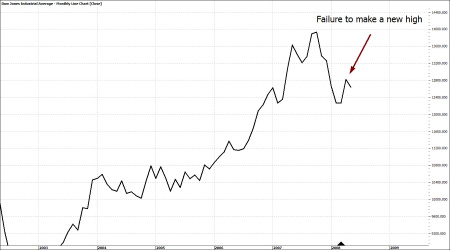
Using the 2008 market crash as an example, you would start looking at the chart after an initial correction took place:
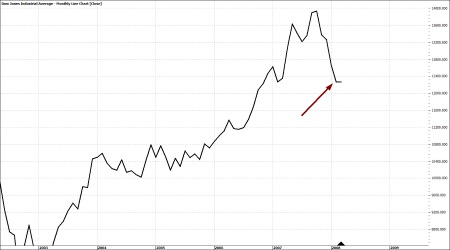
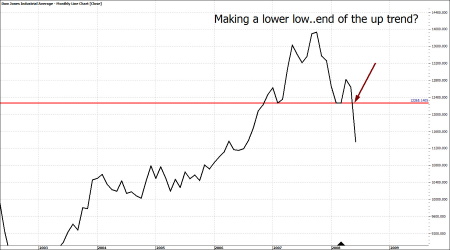
Following this type of pull back, we want to watch whether the market can make a new high before it falls through that initial correction level:
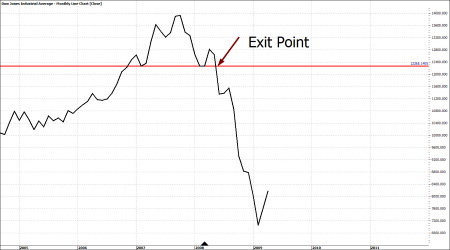
Notice that this system is not perfect and will NOT prevent you from losing money, but in this particular instance, the exit point was early enough to spare you out of most of the carnage that followed. The signal came before the market finally stopped falling and it took a couple of months to develop, giving you plenty of time to prepare.
These are just a couple examples of simple, circuit breaker-type strategies for getting out before there is too much damage to your investments. I like them because they are simple and easy to understand, but I don’t like them because they are formulated from historic price action. While many systems, such as the Dow Theory, seem to have stood the test of time, the world is changing at a faster and faster pace. Just because something worked in the last crash is not a guarantee that it will help us in the next one.
In Part 3, I will explore structural strategies that are not dependent on Wall Street behaving as it did in the past.
Read More