Q4 2019 – Welcome to the Roaring Twenties!
Let’s just get this out of the way: a 10% correction (or more) could be coming in 2020. This “prediction” of course does not come from us as we follow the trend instead of guessing it. It’s from Wells Fargo’s Chief Equity Strategist. After reading this bold prediction, we sighed a collective response usually attributed to teenage characters from a Disney TV series (remember we still have young kids and grandkids).
Of course, a meaningful correction could happen in 2020, a quick internet search tells us that S&P 500 corrections of 10% or more, including those that turned into bear markets, have occurred nearly every 1.5 years (357 trading days) on average since 1957.
Most recently, both the Dow and S&P 500 dropped into correction territory on February 8, 2018, when they closed 10.4 percent and 10.2 percent, respectively, lower than their late-January peak. All three of the major market indices also fell around 9% again in December 2018.
We take this “bold” proclamation from Wells Fargo as the equivalent of proclaiming that there might be a storm rise tomorrow; eventually they will be right. In the meantime, we must manage our strategies based on what is happening while keeping an eye on what could happen.
Here is the full quote from Chris Harvey who is the Chief Equity Strategist for Wells Fargo as published on Yahoo Finance on December 19:
“A 10% stock market correction in 1H20 (the first half of 2020) is possible; we can envision one in late March/early April when the Fed’s balance sheet possibly stops growing.”
Of course, if you are in the accumulation phase of an investment-income strategy you should celebrate 10% corrections as an opportunity to buy shares of your dividend-paying companies at a lower price. If you are collecting investment income from your portfolio, you are watching dividend growth, payout ratios and the overall strength of individual businesses instead of share prices. Anyone who sold their shares of Coca-Cola (KO) in 2008 missed out on a 12.5% dividend increase. It is the strength and staying power of the business that is of main concern and not a herd-based drop in price.
So, with that out of the way, let us quickly review 2019 and look at what could keep us up at night in 2020.
2019
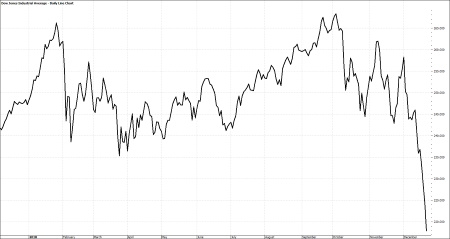
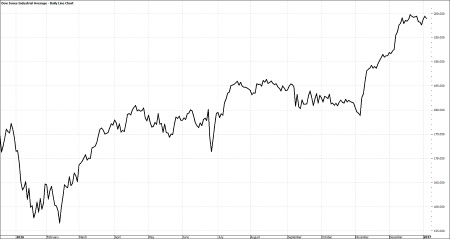
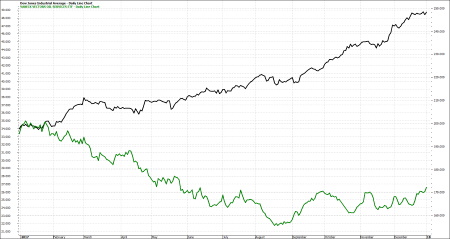
Stocks did extremely well last year, making investors happy and economic data in the US and around the world did NOT deteriorate (as so many had expected). For the year, the Dow gained 23%, the S&P 500 surged by 30%, the NASDAQ rose by 37% and the Russell 2000 (small cap stocks)was up 25%. Central banks continue to support the markets with ultra-low (and, in some countries, negative) interest rates and inflation in the developed world remains well under control (more on this subject later).
The energy market (oil) appears to have stabilized (although rocked a bit recently by political developments).
In the US, unemployment is at “historic” lows, interest rates are at “historic” lows and the stock market is at “historic” highs, having advanced by 18% (after making up the 13% drop suffered last December when the markets went into sell mode over FED policy). The US has forged a new trade agreement with our own neighbors: Mexico and Canada, that was finally approved by the House of Representatives this month and as we had predicted earlier this year. The U.S. Trade Delegation has apparently forged an agreement (in principle) with China. So, Merry Christmas Rally!
Looking to 2020
2019 will be a tough act to follow, with widespread gains fueled by central bank easing and falling interest rates. Many stocks are riding on high valuations that may have gotten ahead of their fundamentals.
We see this reflected in the violent selloffs of individual companies during earnings season. These selloffs so far have had no rhyme or reason other than the market being disappointed with something and adjusting the price of the stock accordingly. Often this will happen on a day when the broader market indices are up, so we take this as judgments on individual companies and not an overall statement about any sector or the economy in general.
Barring any major unforeseen economic event, such as a collapse in the housing or credit markets, we expect the overall economy to remain stable throughout the year as the trade deals weave their way into the various components of the economy.
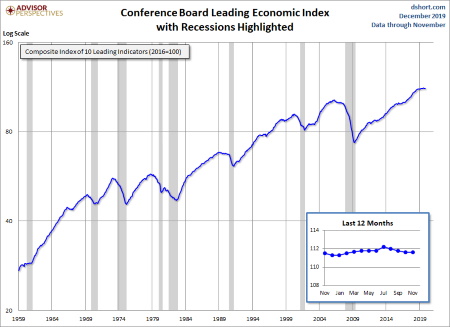
The latest reading of the Conference Board’ Leading Economic Index (LEI) that we mentioned last quarter was unchanged for November, before any of the trade deals were showing any sign of progress. The greater certainty alone could help boost the economy.
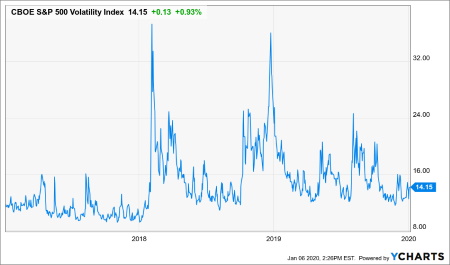
However, while the economy should be stable, we do not expect any change in the type of market volatility that we have experienced since 2018. In fact, it could get even crazier in 2020 with several factors contributing.
Trade
We try not to over think the unfolding of any trade deal with China. We still don’t know the details and the deal such as it may be, hasn’t been signed. Expectations for the signing of the Phase One trade deal are building and news out of the White House tells us that a “signing ceremony” is due to happen on Jan. 15. Who will be there is still unclear. The announcement makes it vague by saying “high level” Chinese officials. Any talk of a delay in that signing will certainly cause the optimism to fade and cause a reassessment of market valuation levels. That will likely cause investors to hit the sell button. However, any sell-off would probably be short-lived, lasting only last until the next positive tweet.
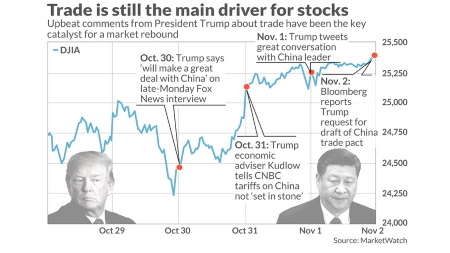
After Phase One is “official”, President Trump has stated that he will travel to Beijing to begin the start of Phase Two negotiations. No formal date for that was indicated. We continue to expect trade talk to be a prime driver of market sentiment in the months ahead.
It is hard to remember that the trade war is now almost 24 months old! None of the predictions made at the onset have come true; the global economy is not falling apart at the seams. US macro data remains robust and (if we believe it) the Chinese economy is holding its own. Eurozone data remains a bit weaker, but none of those countries are imploding. So while any delay may cause some selling pressure, we wouldn’t expect the bottom to fall out just yet.
Credit Risk
According to Bloomberg, the total amount of bonds outstanding globally that are trading with a negative yield exceed for the first time $15 trillion. This includes government and corporate debt, and some euro junk bonds. The problem here is that we have never seen this before. We spent quite a bit of time researching this topic and could not find a sustained period of negative-yielding debt once in market history. It’s hard to estimate how this will impact economies and markets since we don’t have any historical precedent.
We hope that potential pro-growth fiscal policy changes lead to enough economic improvement to create a soft-landing in the sovereign debt market.
That would mean that rates go positive without spiking up too high and without destroying the operating budgets of the countries issuing the debt. But it would be foolish to turn our backs on Central Banks and just expect them to get it right. More than likely, this process of returning to a more normal situation will resemble a high wire balancing act where we see reactive, overcompensation triggering short-term panic selling and buying depending on which side of the “wire” the banks are in danger of falling from.
Geo-Politics
Just in time for Christmas, North Korea’s President Kim Jung Un announced that he was no longer bound by any agreement to halt missile tests. The US embassy in Iraq was under attack and just this morning as we are going through our final edits, we see the announcement of a drone strike in Bagdad that killed a high-ranking Iranian general. The fact that Iranian generals are found traipsing around Iraq raises the temperature around the world.

All of this is an unfortunate reminder that international risks have built on several fronts the last several years. The Middle East hasn’t always been at the top of the headlines but escalating incursions into Iraq and Syria could change all that. Do not expect any of this to go away anytime soon.
US Politics!
Oh boy, it is an election year (and a leap year, February has 29 days this year). Caucuses and primaries are about to begin. By super Tuesday, Mar. 3, we should have more clarity on who is really rising to the top of the Democratic heap and then what sectors of the economy will be most impacted by the coming platforms.
The FED
Based on the current state of the economy, we do not expect much from the central bank this year. Rates remain at historic lows, inflation remains subdued, GDP is running at a healthy 2%+ rate, unemployment is at historic lows, wage growth is healthy and improving, and talk of a coming recession is nothing but a memory. The idea that 2020 would see at least one more rate cut seems to be fading while talk of rate hikes remain “off limits.
It is an election year so the FED must be careful, otherwise they will be accused of “influencing the election.”
So, unless the US economy begins to stall (possible but unlikely) or begins to overheat (possible and more likely), don’t expect FED Chairman Jay Powell to do much. He has made it clear that we are in a good place and that the FED is comfortable. Individual members will continue to voice their opinions with some more hawkish while others remain dovish and that will contribute to the expected short-term volatility as we move through the year.
Algorithmic Trading and Investment Robots
Artificial intelligence in stock trading certainly isn’t a new phenomenon, but it’s impact on daily volatility continues to grow larger each day.
A recent investment article asked, “Have bots killed short term trading?” In the late 1990’s, market movements were still controlled by market makers. Real people were making and taking buy and sell orders, albeit with high speed computer tablets at their fingertips to calculate portfolio risk and give off-setting orders. Their role was to provide a “market” for buy and sell orders coming in from everywhere to ensure orderly liquidity flow between the buyers and the sellers.
Fast forward to today when large financial firms have invested heavily in AI and several unmistakable patterns are starting to emerge.
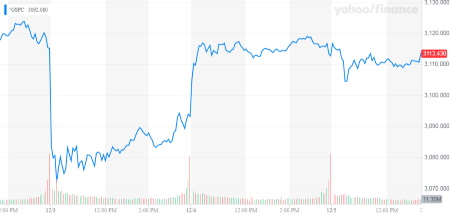
Take the recent daily volatility caused by the trade talks. It was not so much the actual comments coming out of China or the US that was driving the markets as much as the buy and sell orders driven by artificial intelligence and computer algorithms in reaction to those comments. It was the “smart logic” (AI) that is built into these algorithms that creates the noise and the (outsized) moves from one day to the next, no matter if we had a deal or not.
This was very noticeable on Tuesday, December 3, when the president made a supposedly “off the cuff” comment while in London, attending the NATO conference. BOOM, the algorithms went into SELL mode. The next day, Chinese Officials came out with a contradictory statement and the algorithms went into BUY mode.
These “Bots” are owned by very large financial institutions and can turn the market on a dime due to the sheer volume they can trade. These are not people with the ability to think critically prior to entering a trade, these are machines that scan headlines, conference calls, prices and volumes, and; faster than I can type a single letter, enter an order that can affect your strategy for the moment.
In fact, JP Morgan Chase noted in a September study that the stock market declined slightly on days when Trump tweeted more than 35 times. On days when Trump tweeted fewer than 35 times, stocks often went up.
These mighty algorithmic robots have dominated global markets over the past decade spitting out insane swings in asset prices in the process. Unfortunately, they will probably get even mightier during the next decade.
One result will be that successfully trading the stock market will become even tougher for most. As many of you know, we track several trading services, each with their own unique entry points and most using price-stop based exit strategies. With the market getting more volatile in the short-term for no good reason, many well-reasoned trades are stopped out and that hurts performance over the longer term.
One benefit that we see could be the return to a longer-term investing approach for smaller, individual investors based on the fundamental strength and growth prospects of single companies and income-generating investments that actually serve to lower the overall volatility of individual accounts, using the day to day, or even week to week market swings to their advantage when accumulating shares.
Update on the Repo Market
In September, the Fed claimed it would be providing $75 billion in overnight liquidity to the Repo Market for a few days, and that this easing would be temporary. As a refresher, or if you are new to our quarterly letters, repo operations occur when banks do not have the required levels of liquidity. They can “park” some of their less-liquid assets with the Fed in exchange for cash, thereby increasing their liquidity.
Last quarter we noted:
“The Federal Reserve acted to calm money markets, injecting billions in cash to quell a surge in short-term rates that was pushing up its policy benchmark rate and threatening to drive up borrowing costs for companies and consumers…
Money markets saw funding shortages Monday and Tuesday, driving the rate on one-day loans backed by Treasury bonds – known as repurchase agreements, or repos – as high as 10%, about four times greater than last week’s levels, according to ICAP data.
More importantly, the turmoil in the repo market caused a key benchmark for policy makers – known as the effective fed funds rate – to jump to 2.25%, an increase that, if left unchecked, could have started impacting broader borrowing costs in the economy.” – Bloomberg
At that time, it was being reported that the consensus among most financial professionals – including the Fed itself – is that this was merely a temporary problem that could be easily corrected by the Fed’s short-term interventions.
Well, so much for “temporary.”
Fast forward to today, and the Fed has increased its overnight repo program to $120 billion… launched a term repo program that has since increased from $30 billion to $45 billion… AND launched a monthly QE (quantitative easing) program of $60 billion.
The message here is clear: When it comes to interventions/monetary easing, there is no such thing as “temporary.”
Put another way, we wonder if the Fed can EVER abandon its interventions in the markets, or instead, will it be forced to engage in larger and larger interventions more frequently.
And the worst part is that the Fed created this situation.
As we opined in earlier letters, the reality is that following the 2008 Crisis, the Fed eased monetary conditions for FAR too long. They:
1. kept interest rates at ZERO for seven years;
2. printed over $3 trillion in new money and used it to buy assets from Wall Street; and
3. engaged in endless verbal intervention, promising additional stimulus whenever the financial markets began to roll over.
The Fed did all of this for SEVEN years (from 2008-2015) – even though there was an economic argument that it could have started normalizing policy as early as 2011/2012.
The result is that the financial system is now addicted to Fed interventions and it appears to us that the Fed may no longer be able to stop intervening without inducing a crisis.
At some point, all this excess leverage will likely lead to another crisis – just as it did in 2000 and 2008. But when there is no limit as to how much new money can be printed out of thin air, it is anyone’s guess as to when the music will stop or how different global economies will be impacted. We certainly do not know, and we are skeptical of any “expert” that claims to have that insight. So, it is most prudent to continue our strategies of investing in strong businesses based on the current economic conditions while staying alert and ready to adjust when the overall trend reverses course.
The SECURE Act
After months of collecting dust in the Senate, the SECURE Act, the most significant retirement savings reform legislation since the Pension Protection Act of 2006, is finally on its way to becoming law after being tacked on to a larger mandatory spending bill introduced into the House of Representatives. Big changes are coming.
Provisions of the SECURE Act will have a wide-ranging impact on retirement savings plans, and 401k plans in particular. According to an article published by 401K Specialist Magazine, among the biggest are:
The SECURE Act’s Section 204 gives fiduciary safe harbor to 401k plan sponsors who include annuities among offerings to plan participants, something long craved by insurers who offer annuity products. Many defined contribution plan sponsors have been reluctant to offer annuities in their plans due to the concern about fiduciary liability if the annuity provider becomes insolvent. Under Section 204, if an annuity provider chosen for a 401k plan were to go out of business or defraud plan participants, employees would not be able to sue the employer afterward.
The SECURE Act will increase the tax credit for employers introducing new retirement plans from $500 to $5,000, and small employers that implement an automatic enrollment feature in the plan design will be eligible for an additional $500 credit.
The SECURE Act’s Open MEP (A Multiple Employer Plan (MEP) is a type of 401(k) plan sponsored by more than one unrelated employer). This provision will make it easier and more economical for smaller employers to offer retirement plans by allowing for the creation of pooled retirement plan providers. It removes the common nexus requirements and allows Open MEPs for employers that don’t share common traits to be administered by the pooled plan provider. The provision also protects small employers in Open MEPs from penalties if other members violate fiduciary rules, also known as the “one bad apple” liability risk that a non-conforming member can pose to an entire plan. That issue has long been a stumbling block for MEPs.
Many part-time workers will be eligible to participate in an employer retirement plan under the SECURE Act.
The SECURE Act also pushes back the age at which retirement plan participants need to take required minimum distributions (RMDs), from 70½ to 72.
To pay for the estimated $389 million the SECURE Act would add to the federal budget over the next 10 years, the bill—in perhaps its most controversial provision—will effectively put an end to the popular estate planning tool known as the “Stretch IRA.”
As James Lange wrote in an article about Stretch IRAs on 401k Specialist earlier this year, under existing law, non-spouse heirs of an IRA owner can “stretch” or extend the taxable distributions of an inherited IRA over their lifetime. The benefit of protracting the distributions of an inherited $1 million IRA could mean as much as a million dollars to the heirs of the IRA owner over their lifetime. It’s all about how quickly taxes are or are not collected.
Under the SECURE Act, the entire IRA or retirement plan would have to be distributed within 10 years of the death of the IRA owner.
This final change can have huge estate planning implications in the new age of 401K millionaires. We are working with our Pinnacle Service Providers AM Accounting & Tax Service, LLC, Mawicke & Goisman, S.C. and Lake Growth Financial Services along with our friend Marc Lichtenfeld from Wealthy Retirement to establish what the best strategies may be to address these changes.
In Summary
As the title suggests, our overall approach and outlook has not changed. The economic backdrop remains favorable. We have low inflation, low interest rates, cheap energy, a strong dollar, wages at a 10-year high and unemployment at a half-century low. Yes, quarterly corporate profit growth slowed a bit. but earnings are growing, and the outlook is still positive.
As always, should you wish to discuss the details of the quarterly cash flow or performance reports, we are more than happy to do so.
Read More