Pullbacks, Corrections and Crashes, OH MY! Part 1
In 2015, we wrote several essays about dealing with volatility in the stock market. Now, we’re doing what we would want if we were in your shoes… We’re sharing them again – with relevant updates – to provide some perspective when it comes to growing and protecting wealth.
January 28, 2020
Yesterday at 4:30 AM the Dow Futures were looking like the market would open down around 400 points, after dropping 240 points on the previous day. The headlines were all flashing about the Wuhan coronavirus coming out of China and the potential for global collapse caused by trade cessation as well as all the losses of companies with a major presence in China. Multi-nationals with China exposure such as Disney, McDonalds and Starbucks had all gapped down significantly and by 11:00 AM, my personal email inbox was starting to fill up with messages like this in the subject line: “The Dow is CRASHING…do this now!”
Indeed, the Dow ended the day down more than 1%. This was the first significant drop since the announcement of the China trade deal was announced and, just like previous drops, people were starting to once again fear that the day of reckoning was finally here.
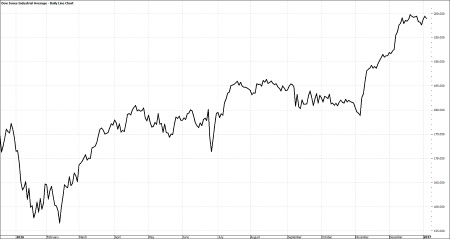
To be sure, if we look at a short-term chart of the Dow, a drop such as the one that occurred in 2018 (near-20%) seems pretty horrific.
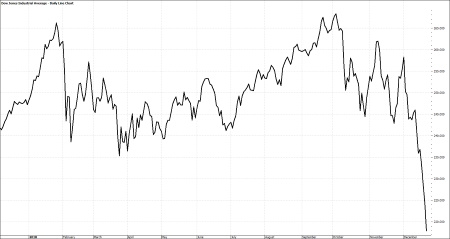
Dow Jones Industrial Average Daily 2018
But what if we look at a longer-term chart?
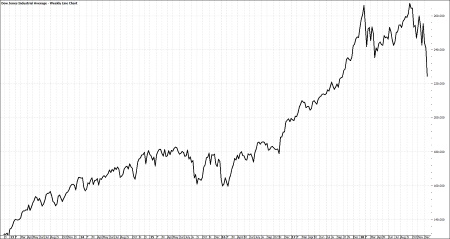
Dow Jones Industrial Average Weekly through 2018
Or even longer than that?
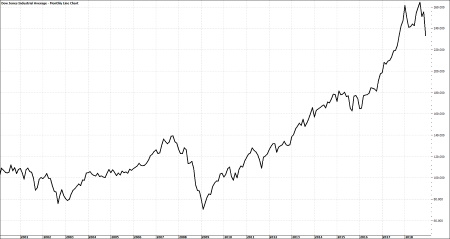
Dow Jones Industrial Average Monthly through 2018
Do you see a crash, or buying opportunities?
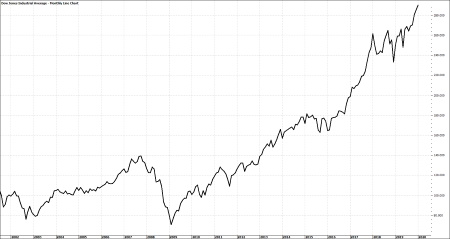
Dow Jones Industrial Average Monthly through January 2019
We certainly have had our share of panic selling since the turn of the century. The worst period was the infamous 2008-2009 sell-off. If you had managed to sell everything and moved to cash soon enough, you missed a nasty drop in the value of your equity holdings. Each subsequent drop, however, was followed by a dramatic run up in prices. If you had gotten out of the market for those declines, fearing a repeat of 2008-2009, you would have missed out on some pretty nice gains.
Another presidential election year is now getting into full gear that seems to promise all the drama of the last cycle in 2016. With that in mind and as the market grapples with geo-political issues and the latest threat of a pandemic, it may be prudent to put market volatility in perspective.
Dow Jones Industrial Average Daily 2016
Let’s start with terminology.
On Wall Street, or CNBC for that matter, a 5% decline in the market is considered a pull-back. Even in a raging bull market where anyone with a copy of the Wall Street Journal and a dart can pick a winning stock, pull backs can be quite common and most take place with little fanfare other than the talking heads on TV promoting their theories on why stocks didn’t rise for a week.
Corrections can be a little scarier. They are defined as a decline of 10% which is enough to make a noticeable difference in all but the tiniest portfolio. Making matters worse, corrections are not necessarily proportional across the entire market. So, while the overall market may be down around 10%, certain sectors (and in a case of Murphy’s law, it seems those sectors are usually those you’re concentrated in) can be down a lot more. For instance, here is the chart for VanEck Vectors Oil Services ETF (OIH), an ETF that holds energy service companies such as Schlumberger and Haliburton.
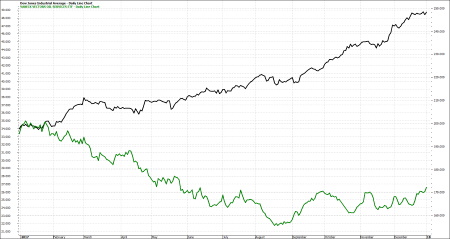
Vaneck Vectors Oil Services ETF versus Dow Jones Industrial Avg. 2017
As you can see, it was down nearly 20% in 2017 despite a rise in the overall market. Situations like this are most likely caused by either real or perceived changes in a particular business or industry. In this case it was the energy sector. These types of changes can cause all sorts of discomfort and can create enough fear of a much larger drop that capitulation results and the investor cashes in and heads for the sidelines.
Doing so will lock-in short term losses. A great deal of precision in picking the market bottom is now needed to get back in. If they mis-time the market bottom, they end up selling low and buying back high. Of course, this is the opposite of what one wants to do when investing. In the case of OIH, it did appear to have bottomed in August of 2017 and after testing lows in October and November, looked like it was starting a new uptrend heading into the new year. Unfortunately, the next year was not any kinder to the energy sector and the ETF fell nearly 44% by the end of 2018.
Trying to move in and out of market corrections without a reliable system is usually a waste of time and money. There are some tactical managers who have had a bit of success at timing corrections and if it interests you, I suggest seeking them out before trying it on your own.
Bear markets are defined as a decline of greater than 20%, and while individual stocks and sectors can be in bear markets, or down trends (as the case with OIH), broad-based declines that encompass all or most of the stock market are fortunately rare. In fact, in the last 50 years the Dow has only experienced a decline of that magnitude nine times.1 When we look at the S&P 500, a much broader index than the Dow, we see only five years of negative returns of any kind over the last 25 years and only twice did the decline exceed 20%.2
Unfortunately, as we see in the charts, all bear markets start out looking like corrections. Once the decline reaches 10%, we get a cacophony advice that, at best, can paralyze us with fear and confusion or, at worst, spurs us to pursue absolutely the wrong course of action when it comes to managing our money.
So how do we know when a decline is a correction and when it’s the start of a bear market? Well, frankly, you never know for sure until it’s all over. Therefore, I believe the more appropriate question is; “how do we structure our investment strategies so we can coolly and confidently deal with the uncertainty?”
1) “How Common are Market Declines?” American Superior Company, http://www.americansuperior.com/bear.htm
2) “How to Weather a Stock Market Decline,” Total Annual Returns for the S&P 500, Wealth Management Systems http://fc.standardandpoors.com/sites/client/generic/axa/axa4/Article.vm?topic=5991&siteContent=8096#005

