Sell-Off, Rebound, then…?
Only two quarters in and 2020 is already one for the record books. In our lifetimes it was only on October 19th, 1987, when the Dow Industrials dropped 23% in a single session, that there’s been a faster market decline than that witnessed in the first quarter of this year. Then, in a further incredible example of market volatility, we experienced the greatest 50-day gain ever recorded. From Marketwatch.com:
The Dow Jones Industrial Average booked its best quarter since 1987, while the S&P 500 posted its best performance since 1998 and the Nasdaq Composite since 1999, as the economy began to reopen after the coronavirus lockdown.
The markets rose so far and so fast that our plan to spread new money into the market over a fixed period, quickly became inapplicable as the valuations of many individual stocks recovered or soared to new highs.
We fully expected to see a series of head fakes like those of past Bear markets.
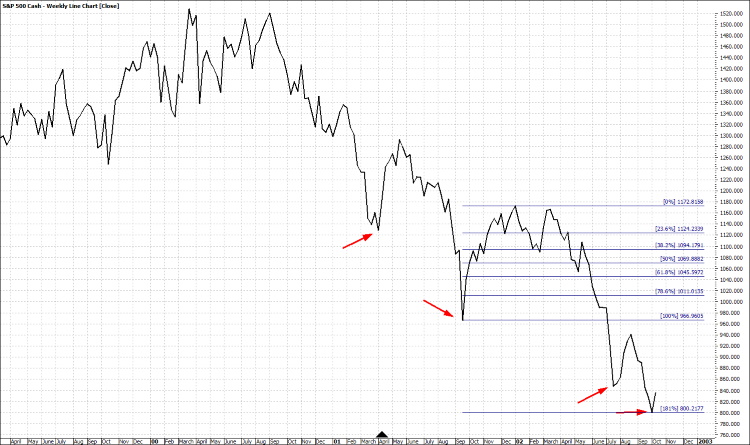
S&P 500 Weekly Chart – Tech-Bubble Crash
Instead, we saw what can only be called a full rebound as the Nasdaq has gone positive for the year and the S&P 500 got within 29 index points of breakeven year-to-date before slipping back slightly.
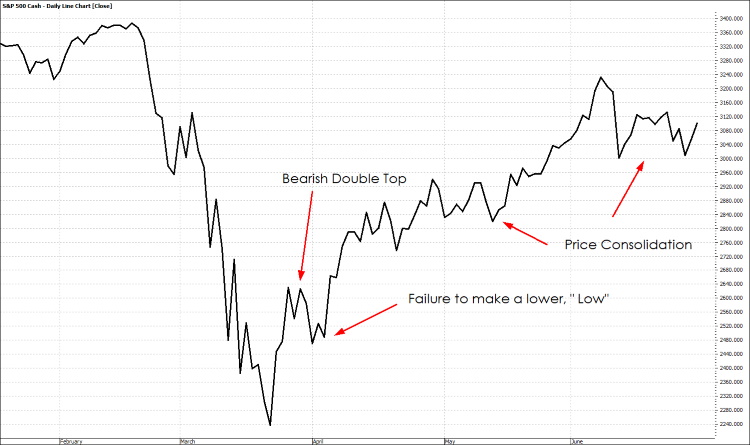
S&P 500 Daily Chart as of June 30, 2020
The rebound has not been equally distributed across all sectors and strategies, however. While money poured into the big tech names such as Apple, Amazon and Google, along with any retailer that either sold on-line or was allowed to stay open, many dividend-paying stocks in the energy, banking, and REIT sectors are still sitting at levels that are, in many cases, far below their original purchase prices.
While this can be frustrating when looking at your account balance, remember that if the purpose of these investments was to produce income, and if we are still in the accumulation phase of the strategy, then we want to be reinvesting our dividends at lower prices in order to gain a greater return on our investment dollars.
If a financially sound bank, energy company or real estate investment trust is trading at a low price simply because it is out of favor with the market momentarily, we are okay with that.
The important thing is to keep an eye on each company’s business fundamentals and to be ready to move if we see those fundamentals deteriorating. We spend a lot of time and effort doing just that.
From this point until the end of the year it appears that there are only three things that will really matter to us…
The Virus
One of our colleagues holds an Associates in Science degree in Biology and a Bachelor’s degree in Bio-Chemical engineering. The Life Sciences have been a life-long passion of his.
He was formally trained to work with bacteria as well as viruses and did extensive work with two viruses, Hepatitis C and Human Immunodeficiency virus (HIV). While not holding himself out as an expert, he certainly has had more hands-on training and experience in virology than the average journalist writing for a mainstream news outlet.
Based on his training and experience, he has been sadly disappointed at the ongoing campaign to spread fear amongst the American public. That is a view shared by all of us. Whether deliberate or out of ignorance, it is morally wrong.
We aren’t going to offer a whole lecture series but will instead illustrate the items we focus on.
The first thing most experts want to know about a virus is the infection rate (R0). This number tells them how many people in a population are likely to get infected.
A simple internet search will show you that of the several thousand viruses circling the planet this very moment, most have an R0 of less than one which means that they are not very infectious. Regardless of what anyone tries to tell you, at this point in time the R0 for the Coronavirus is still unknown. There is simply not enough data to make a reliable determination.
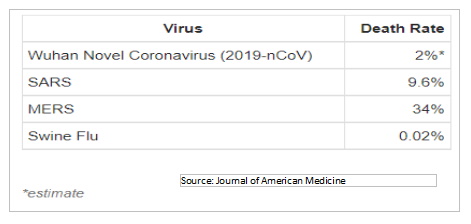
The other most important piece of information is the fatality rate of the virus. This number conveys the likelihood of someone who has been infected succumbing to the virus.
Even dismissing other variables such as age, gender, pre-existing conditions, access to medical care, genetics and anything still to be determined as contributing factors, we do not have a clue what the real fatality rate might be.
As an example, when the Swine Flu first burst on the scene, it looked like it had a low R0 and a high fatality rate of 10% (By comparison, seasonal flus generally kill far fewer than 1% of those infected worldwide and less than 0.1% in the U.S). Based on those preliminary numbers, the World Health Organization declared Swine Flu a pandemic.
However, as it turned out, R0 for the pandemic was much higher and the fatality rate was much, much lower at 0.02%.
As a rule of thumb, a higher infection rate generally corresponds to a lower fatality rate. This makes intuitive sense because something deadly, such as Ebola, will kill those infected rapidly before they can spread the virus to others.
Note that R0 and fatality rate can only be calculated after the pandemic is over. While an epidemic is ongoing, as it is with the current coronavirus outbreak, calculating these numbers is, at the very least, naïve. They can be very misleading and lead to poor policy decisions if they are incorporated into any type of model used for making projections. This is precisely what has occurred with this pandemic and is the main reason that all the models have failed so miserably.
We saw this failure clearly in New York. During the Governor’s daily briefing on March 25th, a projection was made indicating that by April 1st, seven days later, New York would see coronavirus hospitalizations reach 60,000 patients. The actual number on April 1st, was closer to 12,000, off by 80% in just seven days.
In what are thought to be the early days of the virus, the World Health Organization was quoting fatality rates between 2% and 3.4% for confirmed cases. Based on those numbers, it was not unreasonable to make rather extreme safeguard recommendations/demands such as wearing masks in closed areas and maintaining greater physical distance from others.
However, as more and more data came in, we learned that the vast majority of COVID-19 deaths were attributed to the four states that sent infected seniors back to their nursing homes. The responsible course would have been to adjust policy based on the data, shifting resources to better secure nursing homes, retirement communities, and the more vulnerable members of the population, while opening up other, more resilient parts of the economy with appropriate precautions in place. In truth, we should probably treat flu seasons this way.
Instead, in the face of improving data, Governors in many states doubled down on their original stay at home orders; bars remained closed, as well as barbershops, schools, offices, airlines, restaurants, beaches, parks and a host of other locations (including churches). Instead of “bending the curve” (slowing the rate of infections, not the total number) to manage hospital and ER capacity, the purpose of these lockdowns suddenly changed to avoidance of the virus. This change in goal brought down upon us a financial calamity never seen before in history: a deep, intentional, self-inflicted recession.
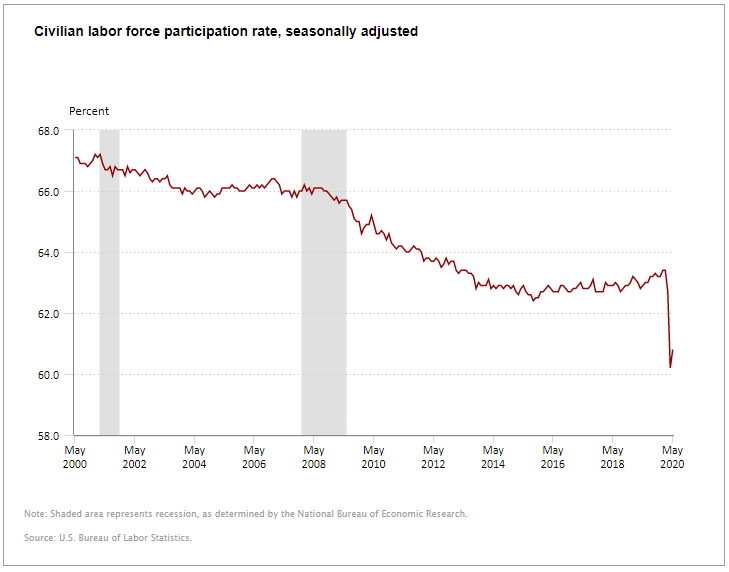
The labor force participation rate, a much better measure of unemployment than the unemployment rate, had finally, after years of decline, been slowly starting to tick up prior to the lockdowns. But with the latest data from the end of May, it now sits at depression era lows.
As we write today, the “surge” in newly diagnosed cases are now mounting faster than you can say ‘coronavirus’.
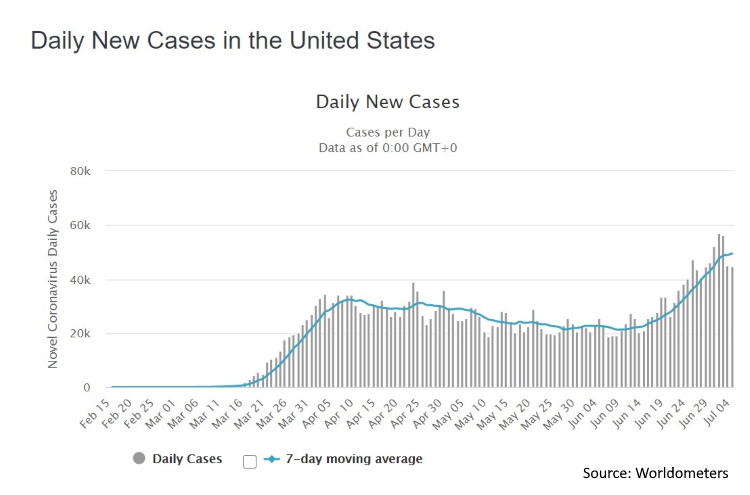
While there are supposed new outbreaks in 4 states, we are learning that there are a growing number of cases in another 20 states. Importantly, the CDC is reporting that most of the newest reported infections are tied to the lower-risk, 20-30 year-old demographic versus the 70-90 year-old demographic.
This phenomenon Is being explained away as the result of ‘summer fun’ as the good weather is drawing out crowds to bars, beaches, sports, etc. In this case the crowds are now the younger set, tired of being told to stay put and tired of not being able to engage in the normal activities of youth.
In response to the rising case numbers, several states are once again shutting down some establishments, ignoring demographics, regional differences, and the fact that daily testing, a major contributor of raw case numbers, has nearly doubled since April.
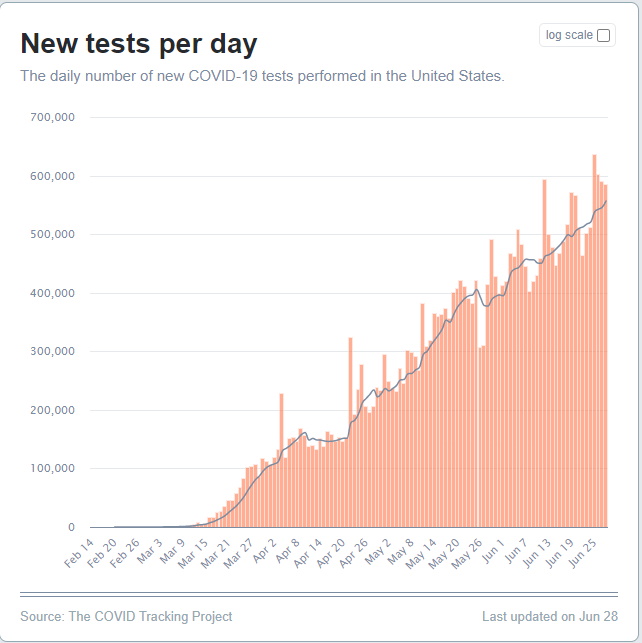
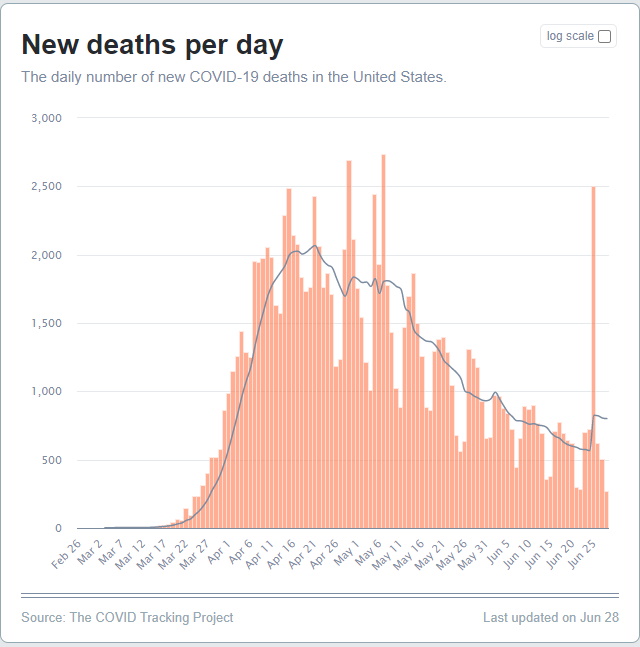
The mainstream media is currently fixated on the rising case numbers while ignoring the increased testing. And, predictably, there is virtually no mention of the dramatic, and continuing, drop in hospitalizations and deaths from the virus.
To be clear, we are not downplaying this virus as if it is a scrape on the arm. COVID-19 is a horrible illness. We have friends, colleagues, and neighbors who have been infected. Several of them were miserable for days with fever and headaches but none of them were hospitalized and the data continues to show that it is an illness that has little, if any, real risk to young, healthy people.
There was no reason to perform a nationwide lockdown. There was no reason to whip everyone into a frenzy of fear.
The seasonal flu hospitalized between 410,000-740,000 people and killed between 24,000-62,000 people this season alone. No one in the media talked about this. No one urged an economic lockdown. No one claimed that it was a pandemic that would be worse than the Spanish flu of 1918-1919.
Where does this all lead us? Just like so many things about the virus, we don’t know.
We believe that by September, the improving data will be hard to ignore. However, by that time, a great amount of damage will have been inflicted on the economy and some of it will be irreparable. Will there be lessons learned?
Certainly, as we have seen with the Swine Flu, SARS and MERS before it, this is not going to be the last time we face a new virus of unknown lethality and infectiousness. In fact, just hitting the wires over the last 24 hours is a report out that states:
Researchers in China have discovered a new type of swine flu that is capable of triggering a pandemic, according to a study in the US science journal PNAS, although experts said there is no imminent threat.
– Guardian UK, US edition, also CBSNews.com
We wish that we were making this up, or that it was from The Onion, but alas, we have confirmed the story on several major news sites. What becomes of this and what impact it has on us is yet unknown.
But one thing that we have learned so far this century, when it comes to Fed intervention, the economy is not the market and visa-versa. Which leads us into our next subject.
The Fed
As you may or may not know, in June, the Fed announced it would begin buying bonds from individual corporations.
Prior to this, the Fed had already begun buying assets in:
- The Treasury markets (US sovereign debt)
- The municipal bond markets (debt issued by states and cities)
- The corporate bond markets by index (debt issued by corporations)
- The commercial paper markets (short-term corporate debt market)
- And the asset-backed security markets (everything from student loans to certificates of deposit and more).
Looking at the most recent history of this kind of intervention, we know that after the crash of Lehman Brothers in 2008, the Fed printed around $4 trillion through various forms of quantitative easing. Over the next ten years, the S&P 500 climbed nearly 300% despite anemic economic and job growth, both here and abroad, and “non-existent” inflation as measured by the experts in our government.
The current round of Fed intervention goes well beyond anything we have seen from the 2008 crisis or prior periods.
The Fed is now involved in virtually every asset class with the exception of stocks. At this point, it would not surprise us to hear that the Fed will soon be buying stocks as well.
By intervening in the markets to this extreme degree, the Fed is publicly announcing its purchasing plans in advance. Equity investors see that the Fed is supporting the corporate bond markets and, as a consequence, they are willing to continue to buy stocks (at least for now).
As we stated last quarter, we used to be outraged by the Fed’s actions. The Fed’s reaction to the financial crisis of 2008 led several leading economists and investment writers to warn that the Fed’s actions were insanity and that they would only lead to greater problems down the road. Purchase of gold and silver in anticipation of a Weimer Republic-like collapse of the US dollar seemed prudent.
Fast forward twelve years and today we are still outraged by the Fed’s actions but we have learned that, regardless of how egregious their machinations may appear, it still does not pay to “fight the Fed.”
Fed actions are outside of our control. The Fed is going to do what it wants whether we like it or not. Which means that as investors we have a choice: we can be angry about this and continue to “fight the Fed” or we can seek those stocks and other investments that may perform best under these conditions.
We are still concerned about the long-term viability of the Fed’s strategy, but for now, we don’t want to fight the Fed by betting against them. Frankly, if investors do get a little more wary, it will likely produce short-term downward volatility that creates opportunities for both our dividend reinvestments as well as deployment of new capital.
We must be prepared for a seemingly inevitable wave of inflation growing out of Fed policy, but history tells us that stocks in general, and particularly the right stocks, are one of the best investments in an inflationary environment.
The Election
The accusations, the distortions, the promises, social media-shaming, endless campaign ads, endless requests for donations to run those ads, recounts, recount recounts, Russian interference, Chinese Interference, pass interference, shouting, rallies, riots, protests…. oh, how we would love to tell someone just to wake us up when it’s all over. But nowadays, it seems like it is never over as one campaign starts just as soon as the last election ends.
How we long for those days when nothing much happened until after the conventions and everyone could enjoy their summer. Of course, back then we didn’t have all the modern conveniences of 24 -hour cable news, Twitter, Facebook, Instagram, or smart-phones. People still thought that the job of the President was to run the Executive Branch of the government, not the country. But alas, we reluctantly are forced to accept that those days are long behind us, probably never to return.
Our job is to help our clients achieve their financial goals regardless of who is in office. We will pay attention to the elections and more importantly, to whatever policy issues that might impact our investments and manage accordingly.
We do not like making predictions about anything here, be it the weather, where the market will go tomorrow, and most certainly not an election outcome. Having said that, given everything that we have seen in the last four years, this may well be the most hotly contested election in our lifetimes. It would not surprise us if the final outcome was not determined until way after election day. Think of Bush / Gore on steroids.
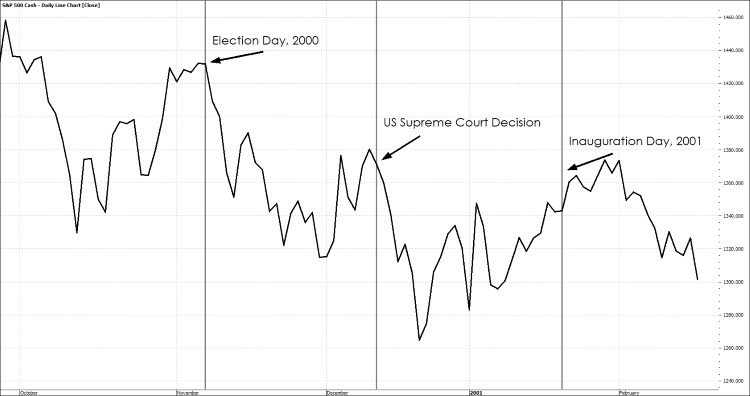
Daily Chart of the S&P 500 During the Presidential 2000 Election Battle
The Bottom Line
There has been some good headline news for the market over the last month since reopening began (be prepared for a long litany of economic figures).
The ISM Manufacturing Index came in at 49.5 for May, just a whisker below the neutral line of 50 but up big from the depths of despair only two months ago. Then for June it came in at 52.6 (the expectation was 49.2); anything above 50 indicates economic expansion.
The Services PMI is also doing better than it was two months ago, and new home sales came in at +16.6% vs. the expected +2.7%. The latest employment report showed 2.5 million jobs gained vs. expectations for a loss of7.7 million jobs. The retail sales report jumped 17.7% (reportedly, the biggest monthly gain ever); and the Housing Market Index which surged 56.8% (also reportedly, the biggest monthly gain ever).
The consumer spending report showed a sharp 8.2% increase vs. last month’s upwardly revised -12.6%. Additionally, mortgage applications rose 8.0% last week with the Purchase Index up 4.0% and refi’s up 10.0%. Mortgage demand is now at an 11-year high. Housing starts rose as well to 0.974 million units (annualized), which was up 4.3% from last month’s upwardly revised 0.934 million. And housing permits jumped 14.4%, pointing to another gain in housing starts next month.
In the last reporting period for June, weekly jobless claims declined for the 12th week in a row. The Philadelphia Fed Business Outlook Survey climbed to 27.5 vs. last month’s -43.1 and the Leading Indicators report increased by 2.8%, up from last month’s -6.1% and expectations for a 1.7% gain.
Durable goods orders came in better than expected with new orders up 15.8% month on month versus estimates for 10.0%. Excluding transportation equipment, durable goods orders were up 4.0% versus estimates for 1.9%. And core capital goods were up 2.3% versus an estimated 0.6%.
Lastly, corporate profits beat expectations with a smaller decline of -9.1% year over year compared to the -11.1% expected.
So, whether it proves to be V-shaped, W-shaped or X, Y, Z, it does appear that an economic recovery is underway. And we’re seeing great pent-up economic demand being unleashed virtually everywhere.
That’s why, according to Zack’s Investment Research, top analysts are now calling for unprecedented GDP growth in Q3, more record growth in Q4, and the largest full year GDP growth in 2021 in 38 years.
So far, nearly $10 trillion in fiscal and monetary stimulus has been pumped into the economy, not to mention near zero interest rates for the foreseeable future.
So, although rising COVID-19 infection rates in the U.S. and China are certainly a concern, we still feel that most indicators are pointing towards a solid floor under the market that will slow any potential profit-taking or bearishness.
The pace of the recovery after the crisis may not be quite as fast as everyone would have hoped, but our strategy right now is to stay the course, remaining fully invested in our quality dividend paying portfolios while managing our stops in our trading strategies and hold some cash for opportunities that the expected volatility may bring.
As always, it is a great pleasure working with such a wonderful and engaged group of clients. We enjoy the phone conversations and email exchanges with you, so please do not hesitate to call or email with any questions, concerns, or ideas you have and we will do our best to provide the answers and guidance you seek. We hope you have a safe and pleasant summer!
Read More
 By age four, your child will probably understand concepts like food, money, appliances, and time. Almost every family has at least one relative who sends money to your child for birthdays or holidays. Assuming that the money was in lieu of a gift, you will want to take your child to the store and let them exchange the money for something they want (toy, pet, clothes, whatever is deemed appropriate). If the money is intended for savings, then take your child to the bank and have them deposit it with you or, if they already have a savings bank at home, have them place it in there.
 If you don’t want to take the chance that you will end up going home and driving right back to the store, you can always “lend” your child the money to buy the toy with the understanding you will be paid back as soon as you get home. I tried this once and it did not end well. Not only was there another stuffed animal to pick up every day, but there was also a very sad little girl who, upon seeing how empty her bank had become, quickly decided that she didn’t want the toy anymore.