Will History Repeat?
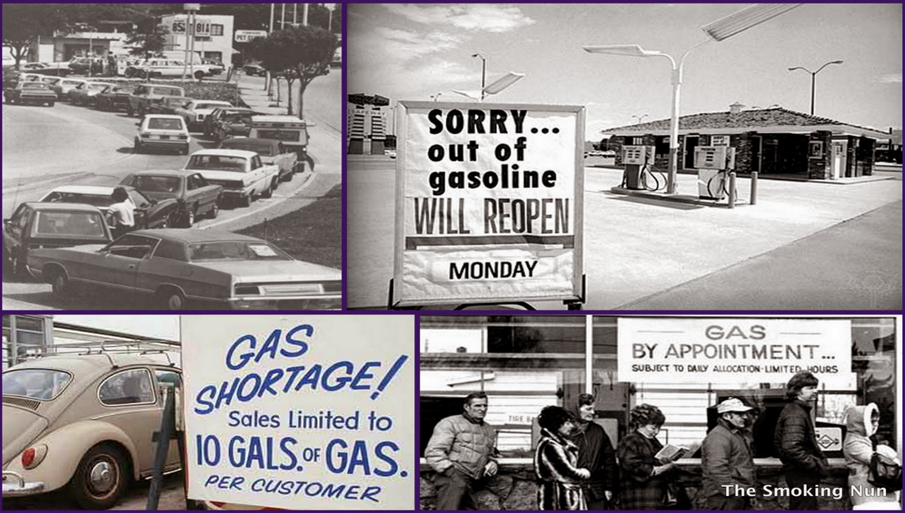
Inflation is raging through the economy. The U.S. recently botched the withdrawal from an agonizingly long and unpopular war and was embarrassed by images from the final days of retreat. Gasoline prices are skyrocketing, causing people to adjust their budgets just to be able to get to work. The Russians have invaded a peaceful neighbor. Europe is economically weakened and gasping for energy. Our president is perceived as weak and ineffective by other foreign leaders. The world is threatened by a pandemic originating from an accident at a biological lab and Trudeau is the prime minister of Canada.
These are not headlines from today, these are events from the end of the 1970s.
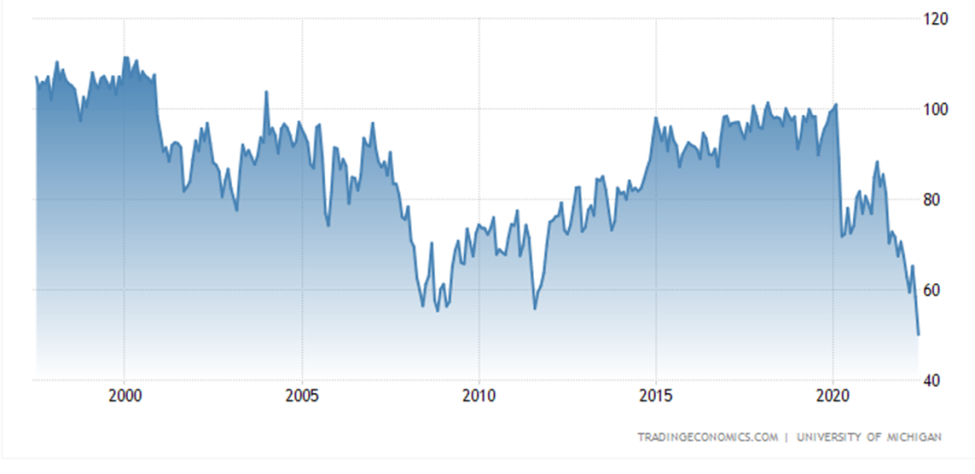
The 1970s started with oil trading just over $1 per barrel. By 1980 Americans had been evacuated from the roof of the U.S. embassy in Vietnam in helicopters, Russia had invaded Afghanistan, there had been a failed rescue attempt of U.S. citizens being held hostage at the U.S. embassy in Iran, and the price of oil had risen to over $36 per barrel, sending shockwaves through the economy and leading to the infamous gas lines.
Human H1N1 influenza virus reappeared in 1977 in the Soviet Union and China. Virologists, using serologic and early genetic tests, soon began to suggest the cause of the reappearance was a laboratory escape of a 1949-50 virus, and as genomic techniques advanced, it became clear that this was true.
There is a long-standing argument about whether or not history repeats itself, but to us this does feel like a “Back to the Future” moment in time.
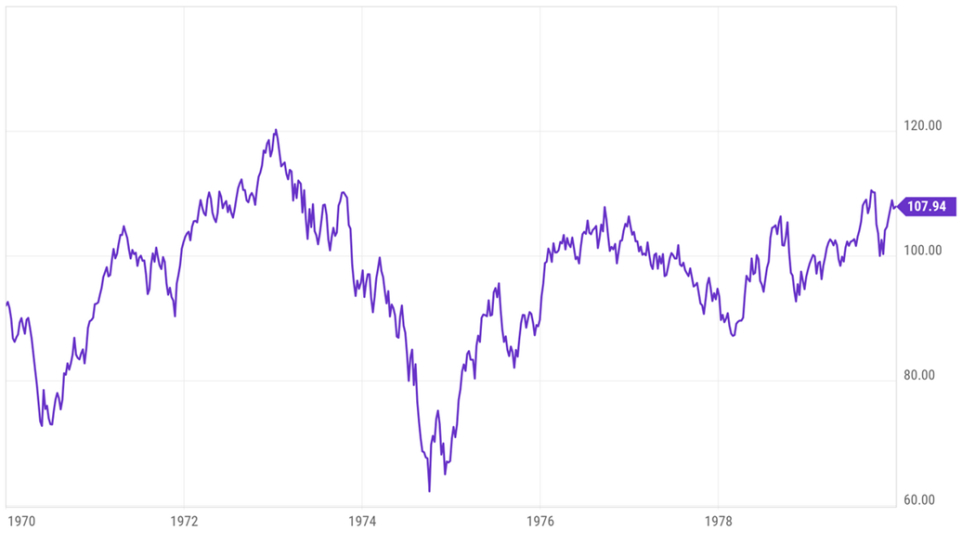
The stock market, as measured by the S&P 500, which in those days, nobody other than professional money managers paid attention to, finished the decade slightly higher than it started.
S&P 500 Price Chart 1970 – 1980
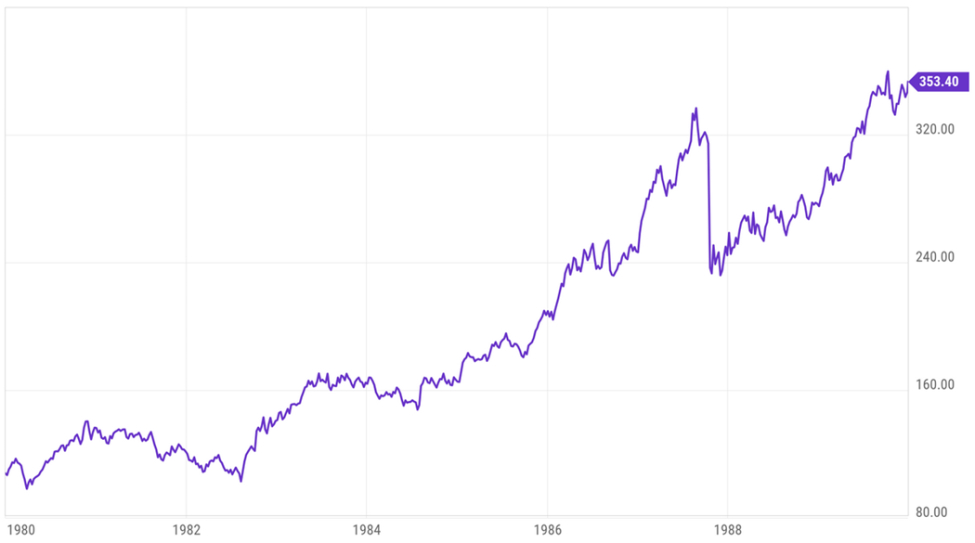
But in 1980, the market started to rebound. Ending the decade at all-time highs.
S&P 500 Price Chart 1980 – 1990
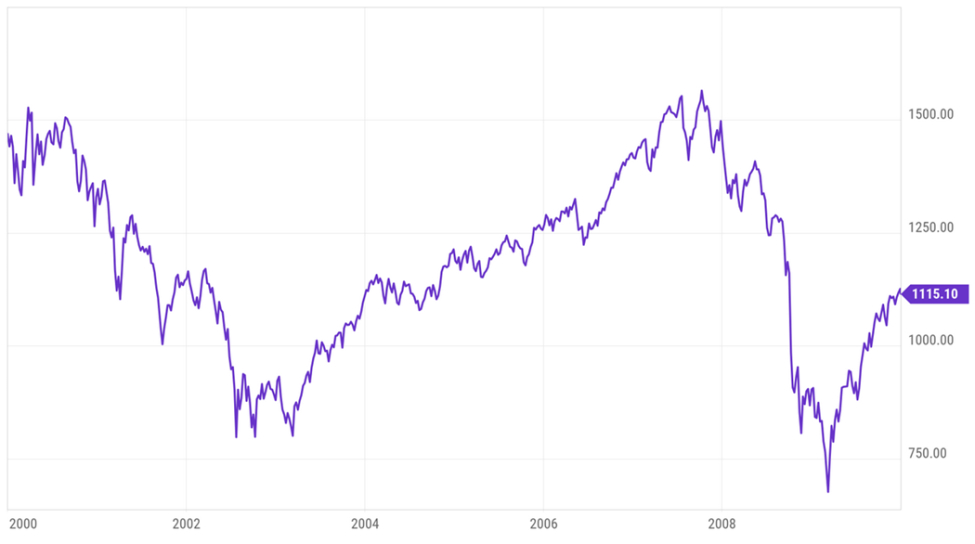
Again, at the turn of the century, we saw the crash of the dot com bubble, 9/11, U.S. entry into two unpopular wars, the housing market-driven financial crisis and, of course, SARS. We ended the decade with the famous “market of no returns.”
S&P 500 Price Chart 2000 – 2010
Only to see another rebound to new all-time highs well before the next decade would end
S&P 500 Price Chart 2010 – 2020
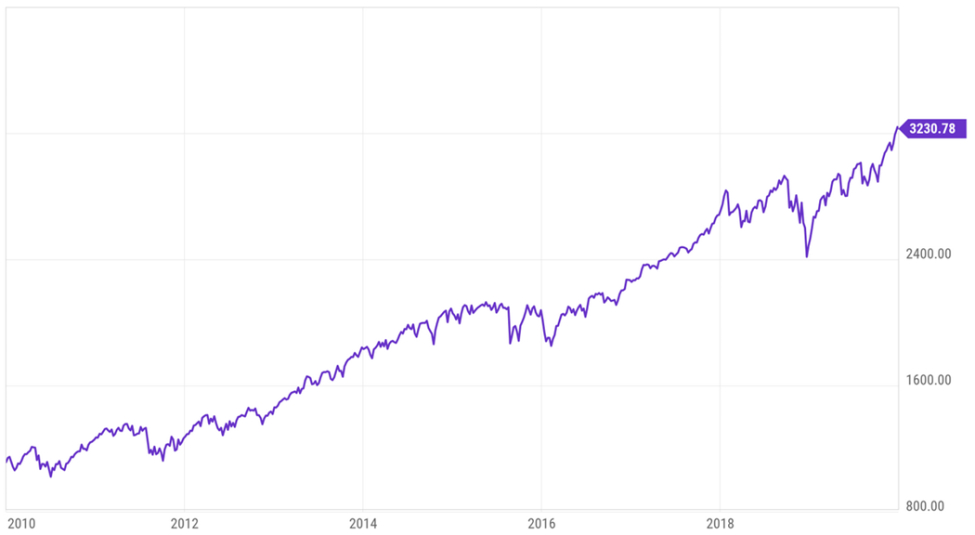
In each of these run-ups, we saw different catalysts driving money into the markets. During the 1980’s we had the tail end of the “Baby Boom” generation enter the job market, along with the largest federal tax cut since the 1960’s.
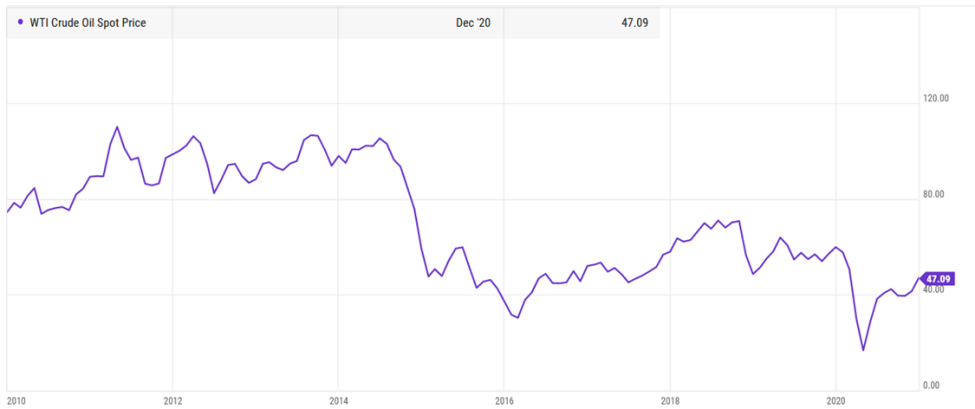
In the decade between 2010 and 2020, we saw the rise of technology, not only of the Silicon-Valley type, but also new energy extraction technology which, during the last half of the decade, lowered the price of oil below $80 per barrel and positively impacted prices and corporate profits.
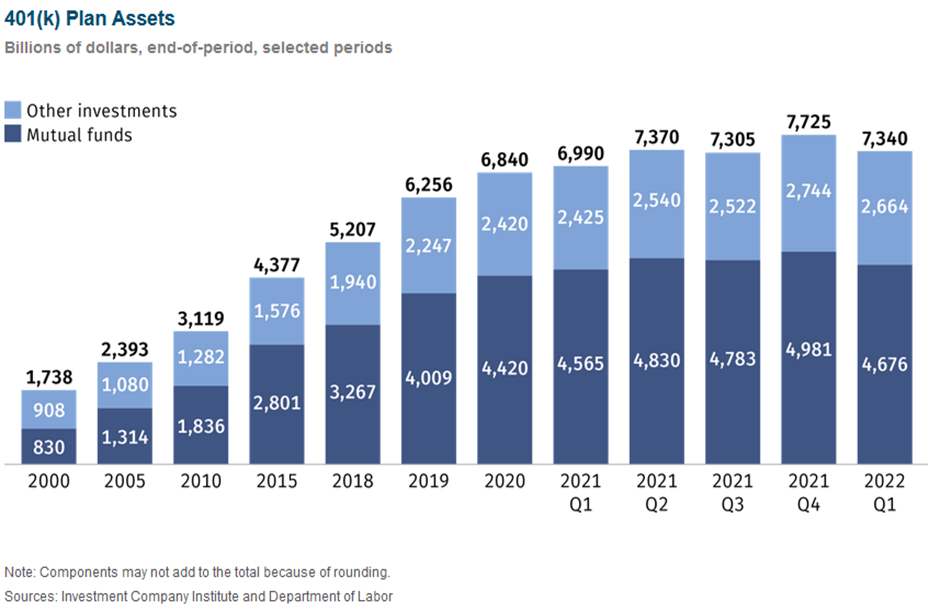
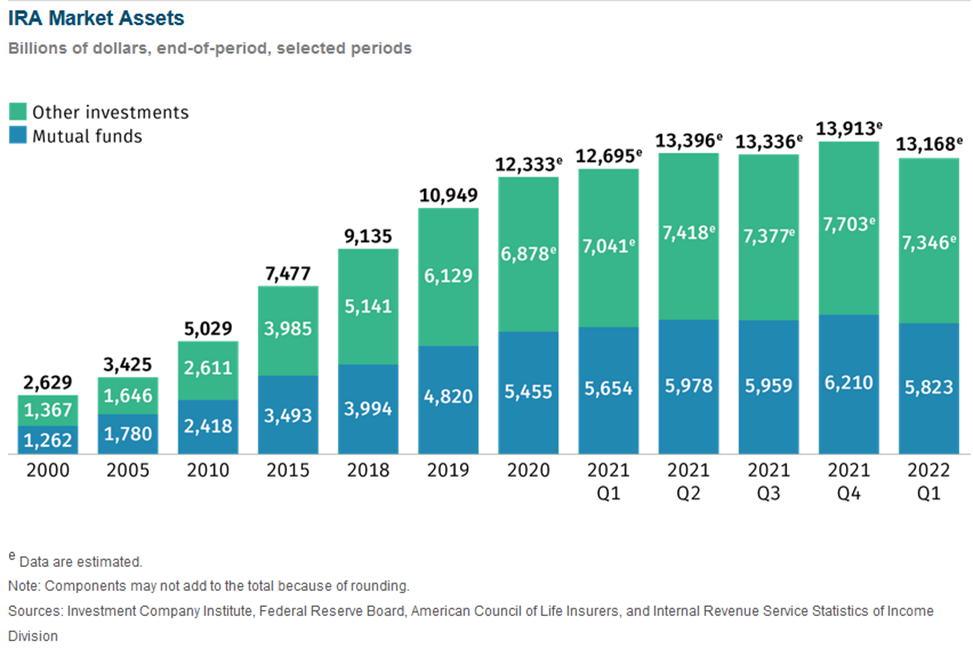
The last of the “Baby Boomers” reached their peak earning years. 401(k) plans became the primary vehicle of the American corporate retirement system with assets totaling $6.25 Trillion according to the Investment Company Institute with another $10.95 Trillion held in individual IRAs.
The one thing that has been consistent through these boom-and-bust cycles is the Federal Reserve and its ability to dictate interest rates throughout the economy.
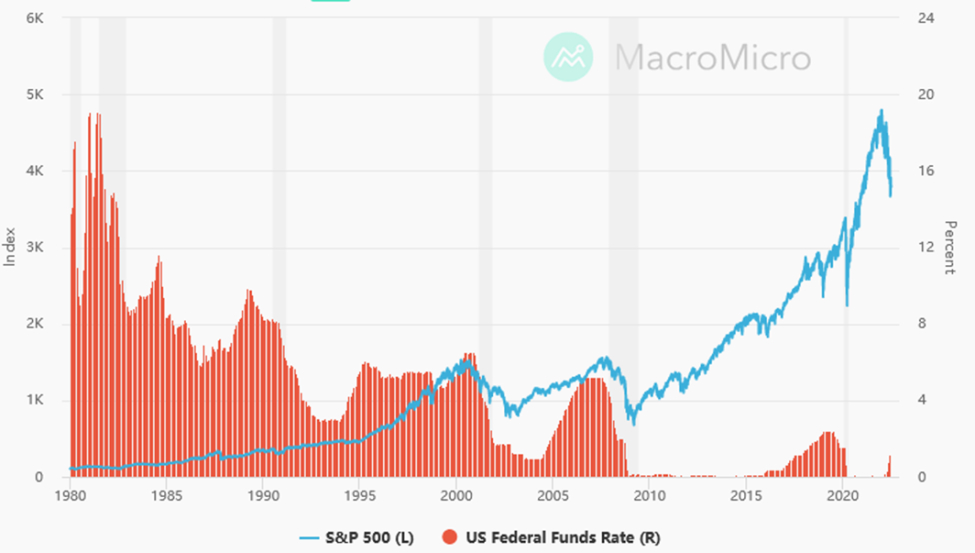
Federal Funds Rate vs. S&P 500
Looking at our current environment, the market, as measured by the S&P 500, finished the first half of the year with the worst 6-month performance since 1970 while the NASDAQ posted its worst opening 6-month performance ever.
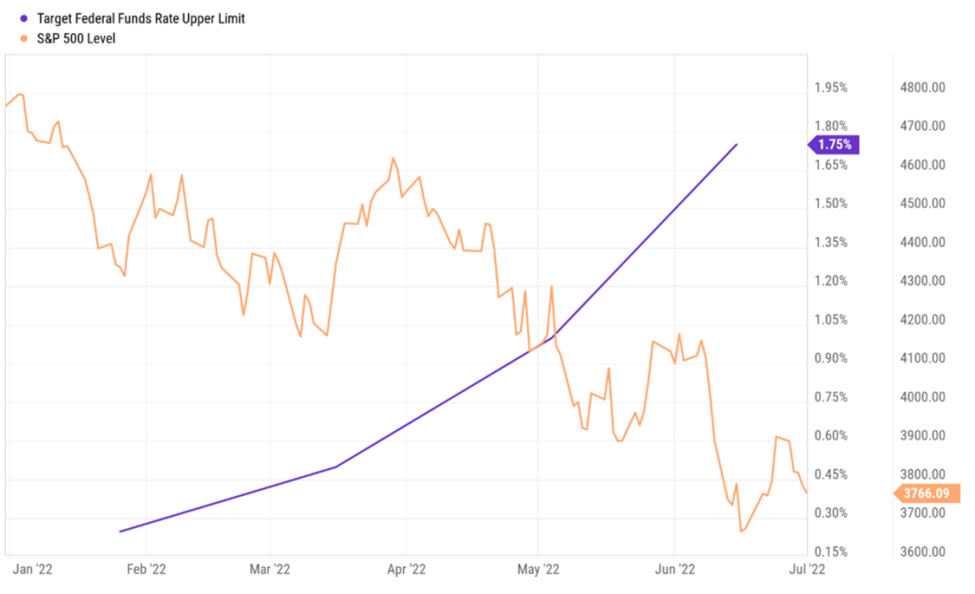
The key driver behind this sell off was the rapid rise in the Federal Funds Rate– driven by accelerating inflation, which in turn was primarily driven by a doubling in energy costs coupled with continued supply chain disruptions both domestically and abroad.
S&P 500 Index vs Federal Funds Rate 1/2022 – 6/2022
Referring to the previous graph showing the historic Federal Funds rate versus the S&P 500, you will see several shaded columns which represent economic downturns, or recessions that have occurred since 1980. Each of these periods is preceded by a “spike” in interest rates. Recessions can cut into corporate earnings meaning that stock prices need to be “adjusted” downward to reflect those lower earnings. This is what Wall Street is looking at and, as financial writer Scott Garlis likes to say, “…when those institutional investors are uncertain, they tend to sell first and ask questions later.”
So, despite the noise and daily headlines, the Federal Reserve is still front and center when it comes to market performance, so that’s where we will begin.
The Federal Reserve
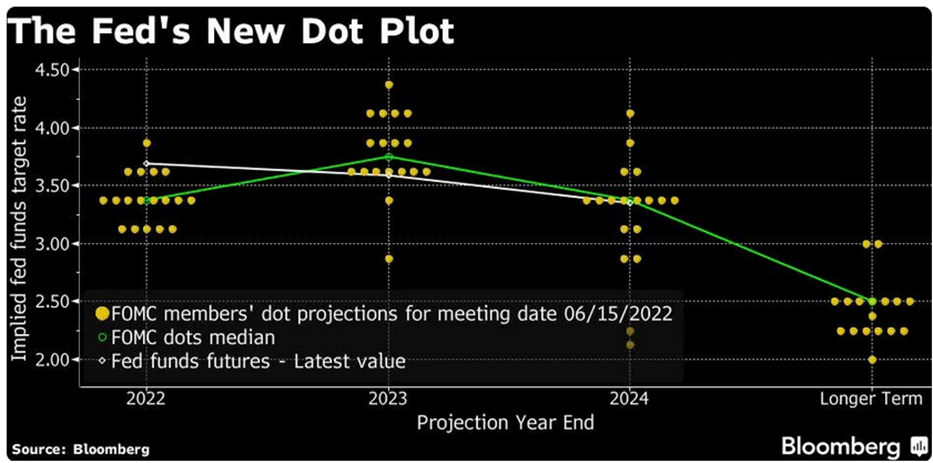
At their June meeting, the Fed raised short-term interest rates by three-quarters of a percentage point — something it hasn’t done since 1994 and maintained a hawkish tone regarding their commitment to “fight inflation.”
Their most recent Dot Plot projects continued increases to 3.4% by the year-end and rates rising further to 3.8% by the end of 2023.
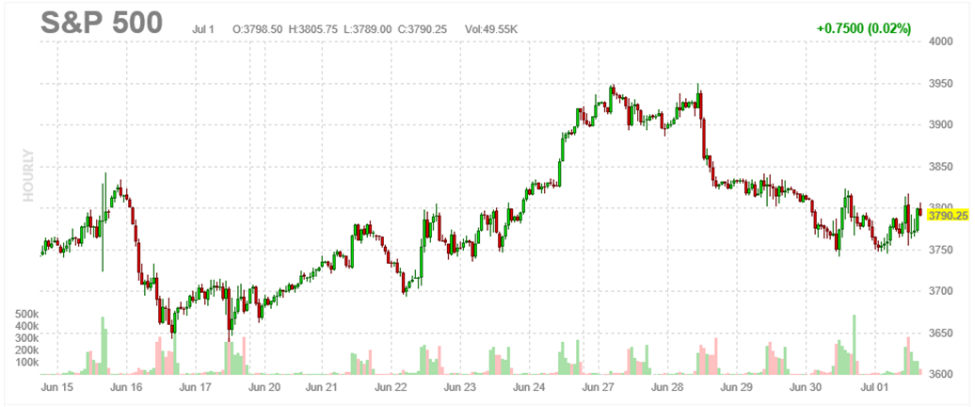
Right after the announcement, the market seemed to stage a “relief rally” but gave it all back the very next day plus an additional 100 points.
In subsequent public events, Federal Reserve Chair Jerome Powell continued to reaffirm that the central bank’s main goal is bringing down inflation which is running at its fastest rate in over 40 years, suggesting that curbing inflation will take priority over fully preserving economic activity.
“Is there a risk we would go too far? Certainly there’s a risk,” Powell said at the European Central Bank’s annual economic policy roundtable conference in Portugal. “The bigger mistake to make — let’s put it that way — would be to fail to restore price stability.” Typically, when central bankers have raised interest rates throughout modern economic-manipulation history, they’ve done it to cool a strong economy and prevent inflation from getting too high.
Today, higher interest rate policies are being put into place when we already have high inflation, and when economic growth was already likely to slow compared to last year. This is what we saw in the 1970s.
So, if the Fed is raising rates to “beat inflation,” higher rates will not work as intended because supply of many critical commodities is being constrained (some deliberately) and demand is inelastic. Higher interest rates may destroy discretionary demand, but not demand for necessities that may keep getting more expensive like energy, food, or water. As investors, we must focus on data. Whether it is looking at deteriorating fundamentals of a company that we like, or macro-economic data, we have to collect as much information as we can and develop forward-looking opinions based on the information available. In the case of our current situation, low cost, reliable energy is necessary for a modern economy to thrive.
As of March 2022, the U.S. is still producing 1.0 million barrels of oil less per day than pre-pandemic.
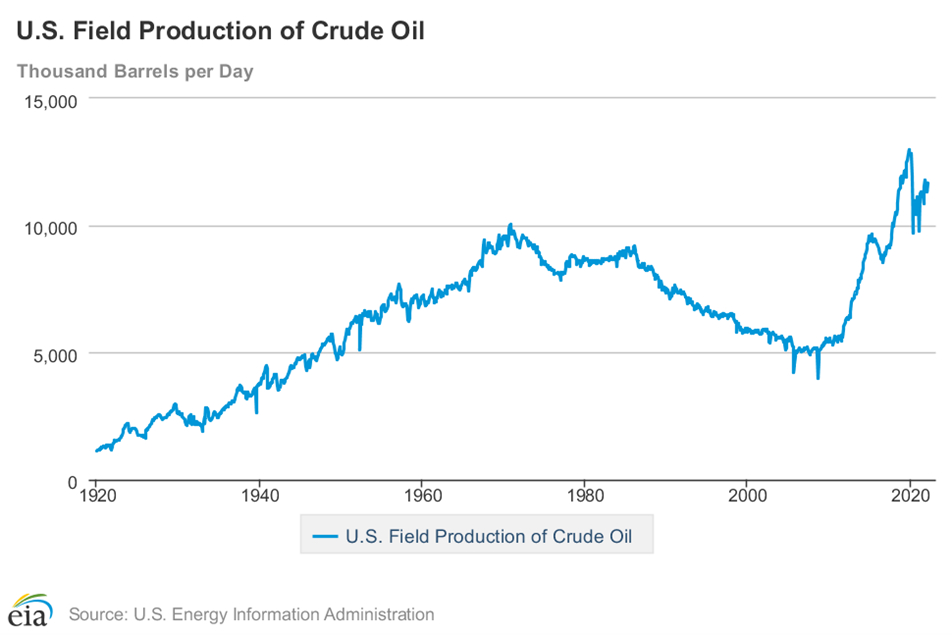
We continue to believe, that unless it can figure out how to drill for oil, the Fed will fail in their mission to “tame inflation” and bring the economy in for a “soft landing.” Powell has even recently gone as far as to admit this, saying during his opening statement to the US House Committee on Financial Services June 23rd that the Fed cannot control the price of oil or most food articles.
What this means is, the Fed will raise interest rates to slow inflation growth for the items it can control, specifically: housing, labor, and business borrowing. The only way the Fed can succeed in defeating inflation is to raise rates high enough to kill off demand in the housing and labor markets. Higher rates will also increase costs for private businesses (many of them smaller businesses). In turn, this will depress profits which can lead to a reduction in capital spending. Reduced capital spending negatively impacts future growth. While none of us here at Summit are degreed economists, nevertheless, it sounds to us as though a recession may well be in the Fed’s plan.
So, the question we ask today is, ”How bad will things get before Powell blinks?” His predecessor is now serving in the administration as the Secretary of the Treasury and, while the Federal Reserve is supposed to be independent and above politics, we all know that it is a small club. The University of Michigan consumer sentiment was downwardly revised to a record low of 50.0 in June of 2022, from a preliminary reading of 50.2. So, it may not be long before we find out how committed he is. Many pundits are already hinting that the Fed could “pivot” away from higher rates in September ahead of the midterm elections.
The Economy
This letter is being written before the release of Q2 economic numbers, but we expect that when they do come out, they will show that the economy has technically entered into a recession, which is traditionally defined as two consecutive quarters of declining economic output as measured by GDP.
We won’t bore you again about why GDP is a terrible measure for economic health because the economists running the Federal Reserve don’t care what we think and, more importantly, the institutional investors and traders don’t care what we think. Markets move in anticipation as well as revelation of these numbers, no matter how much those numbers may be manipulated.
As noted above, The University of Michigan consumer sentiment was downwardly revised to a record low of 50.0 in June of 2022, from a preliminary reading of 50.2.
From the latest report:
“The current economic conditions subindex sank to an all-time low of 53.8 (vs. 63.3 in May), and the expectations gauge plunged to 47.5. About 79% of consumers expected bad times in the year ahead for business conditions, the highest since 2009. Inflation expectations for the year ahead stood at 5.4%, little changed from a preliminary reading or the preceding four months. Meanwhile, the 5-year inflation outlook rose slightly to 3.1% from 3% in the previous month but decreased from its mid-month reading of 3.3%.“
The Index of Consumer Expectations focuses on three areas: how consumers view prospects for their own financial situation, how they view prospects for the general economy over the near term, and their view of prospects for the economy over the long term.
These readings don’t bode well for the economy as when sentiment is low, people are more inclined to “hunker down” until they feel like conditions are improving. In this way, consumer sentiment can be self-fulfilling as fear of recession lowers confidence, which impacts consumer spending, which can lead to recession.
The Bureau of Economic Analysis’ Personal Consumption Expenditures (PCE), the U.S. Federal Reserve’s preferred inflation gauge, jumped by 6.3% year-over-year in its latest figure for May. This was in line with April’s number and lower than March’s 6.6%.
Excluding food and fuel, the reading showed an increase of 4.7% compared with the prior 4.9%. On a monthly basis, the core measure gained 0.3% versus the previous month as well.
The data could be a signal that while the total figure grew on an annual basis, price increases may be moderating. But while there are some positive indications in the report, other factors remain a concern.
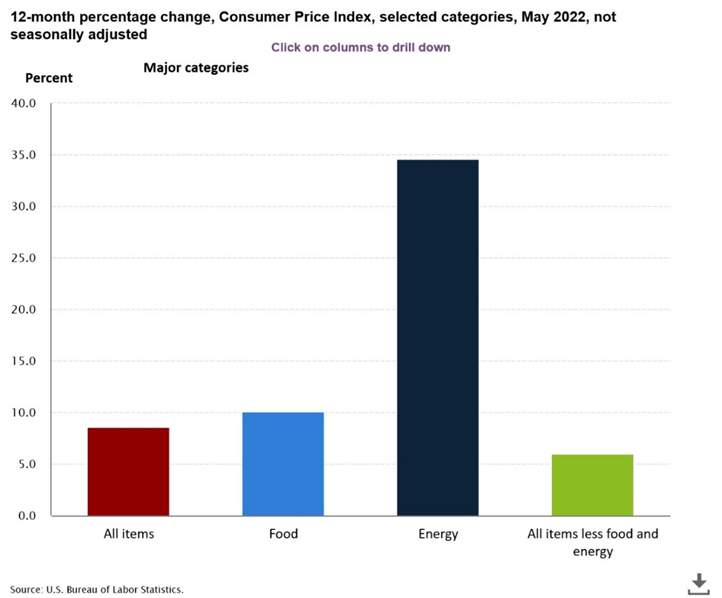
In May, the Consumer Price Index for All Urban Consumers rose 1.0 percent, seasonally adjusted, and rose 8.6 percent over the last 12 months, not seasonally adjusted. This is a different measure of inflation from the PCE discussed above. The index for all items less food and energy increased 0.6 percent in May (SA), up 6.0 percent over the year (NSA).
It is interesting to note that the Bureau of Labor Statistics changed the computation of the CPI in the 1980s (and again in the 1990s). If the 1980s methodology were still being used, reported inflation would be much higher.
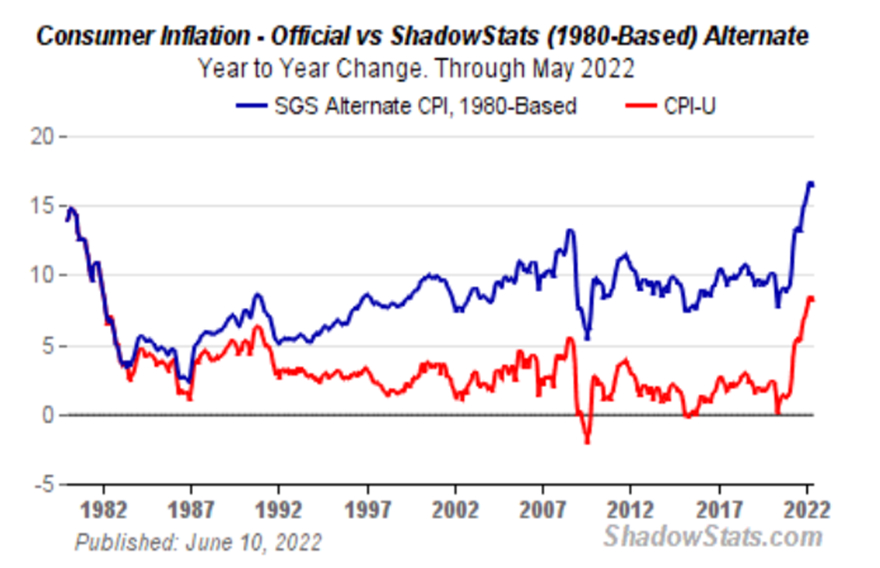
No matter which measure is used, it’s clear that the U.S. has problems with rising costs.
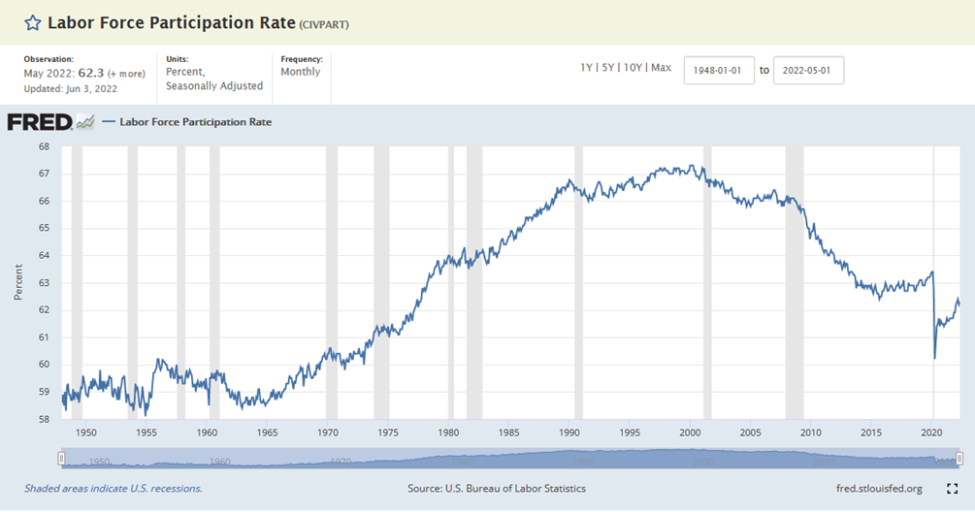
Labor
One thing that has baffled us is the disconnect between job openings, the unemployment rate, and labor force participation. Labor force participation remains stubbornly low.
Emergency unemployment benefits put in place for the Covid lockdowns expired nationwide in September 2021. At that time, more than 12 million people were receiving some form of unemployment aid. Most were supposed to be cut off entirely while the rest would see their benefits reduced by $300 per week. In theory, this should have driven people back into the workforce.
However, with the justification of an ongoing national emergency, the federal government, in August 2021, announced a 25% increase in funding for the Supplemental Nutrition Assistance Program (SNAP) and suspended work search requirements for able-bodied adults without dependents enrolled in the program. While these programs are certainly necessary for people who are not able to support themselves financially, it also discourages potential jobseekers from obtaining the kind of employment that allows them to develop important skills, build self-esteem, and provide for their families. When businesses are struggling to hire employees, higher wages and benefits can only do so much — especially when they are competing with government programs.
For example, Michigan residents on unemployment are only obligated to conduct one job-seeking activity per week to receive unemployment insurance (UI) benefits for up to 20 weeks. The state’s unemployment rate stands at 4.3%. Compare this to Utah, which requires a person to submit four job-seeking activities per week. Utah’s unemployment rate stands at 2.0 percent.
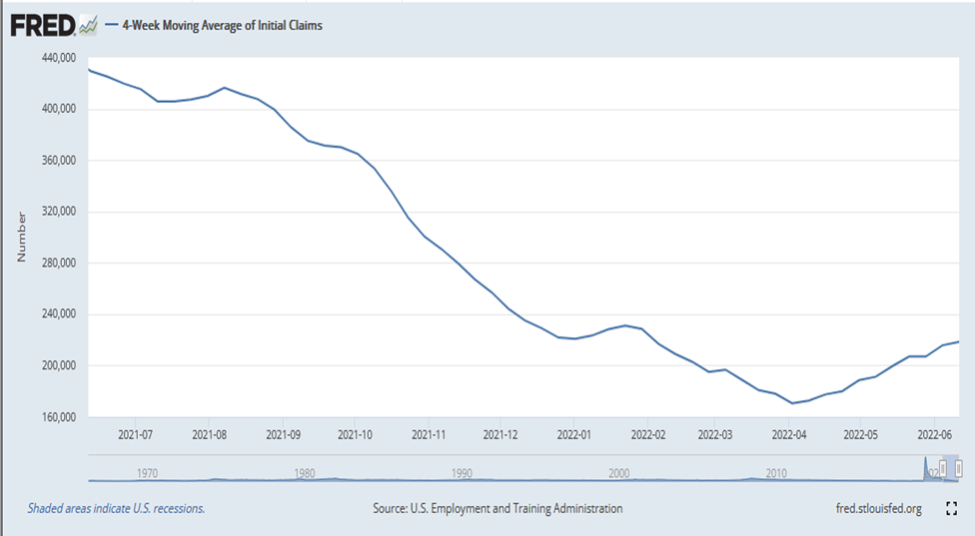
However, as noted above, instead of the Administration addressing the supply side of the equation by encouraging people to seek employment through fiscal policy, we have the Fed trying to kill the demand side using monetary policy. Sadly, this may already be starting to work as indicated by the 4-Week Moving average of Initial Jobless claims.
The other indicator that we continue to keep an eye on is the Job Openings and Labor Turnover Survey (JOLTS). As of April 2022, the number of job openings decreased 7% through a combination of hiring and hiring freezes. Figures for May 2022 will not come out until after this letter is published, but we continue to look at the combination of labor force participation, jobless claims, and job openings for clues as to the state of the economy.
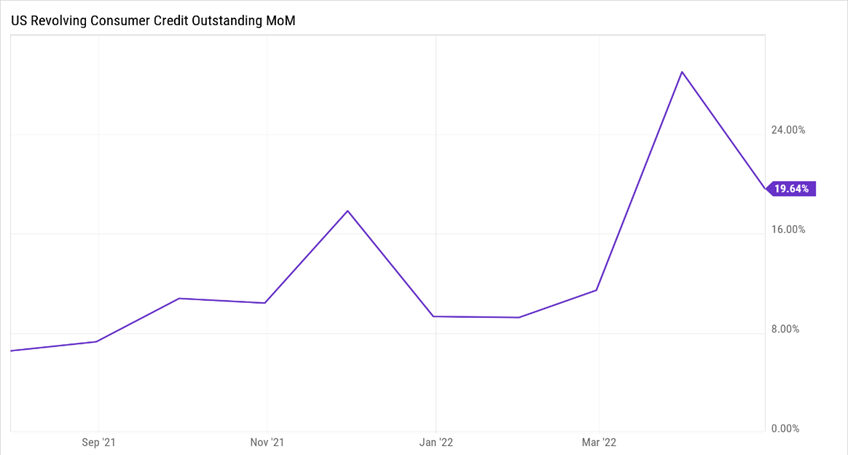
Something that has recently appeared on our radar is the increasing use of personal credit. In both California and Wisconsin, we see people out shopping and eating in restaurants like they did before the pandemic, even in the face of rising prices. So, it makes us wonder if their personal incomes have risen to keep pace with those higher costs or if they are still stubbornly refusing to cut back in their spending habits in the hope that high prices really are “transitory” and will eventually come down or that their income will eventually catch-up.
Note that payment giant Visa’s most recent 8-K filing showed users are expanding their use of credit.
While revised first-quarter economic output numbers show disposable income has been shrinking over the past year.
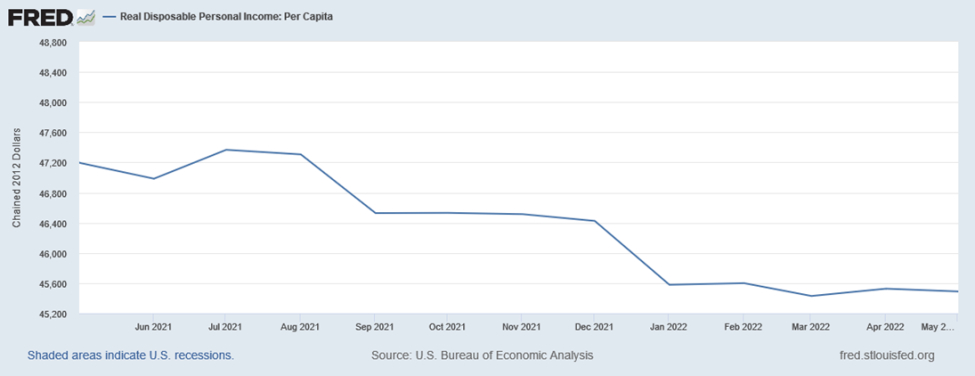
These figures point to shrinking spending power for American households. As more people use credit to extend their paychecks, they’ll have to spend more on servicing those debt loads, and their disposable income will shrink further.
Expanding credit usage, higher interest rates, and shrinking disposable income could weigh on economic growth.
Rising interest rates and dwindling consumer buying power means Wall Street analysts may need to reduce their expectations for economic growth and corporate earnings in many sectors.
Geo-Political
It astounds us how fast the current news cycles move on to the next shiny object. Last quarter, the Russia – Ukraine war dominated the news. Now, you must deliberately search for news and information about it unless you have one of the 24/7 news channels going on in your home or office (which we do not advise).
The war continues to slog on, leaving death and destruction in its wake, while disrupting global energy resources and now threatening food scarcity. Vital grain exports have been halted and fertilizer supplies, a major Russian export, are at risk for farmers in the European Union, South America and Africa. Fertilizer prices for US farmers are also rising as a result. These war-driven disruptions drive up the cost of living and will eventually impact the economy.
What is not getting a lot of attention is what is happening in China beyond its Covid lockdown policies and seemingly weekly military operations threatening Taiwan.
However, for months now, our newswire feeds have continued to mention efforts by the Chinese government to support domestic economic growth and financial system stability. Because of a lack of transparency, it is difficult to know whether these problems are short-term blips caused by their continued zero-Covid policies which have shut down large swaths of their economy for weeks at a time, or if there are deeper economic fissures forming. We wrote extensively about China in our Q4 2021 Market Update, so we won’t rehash our thesis here. But we note these signs occurring on a somewhat regular basis lately and it is a reason to keep an eye on the situation.
Throwing BRICS at the West
One thing that we have not heard about in several years are the BRICS (Brazil, Russia, India, China and now, South Africa) and their emergence as an economic rival to the G7 (Canada, France, Germany, Italy, Japan, the United Kingdom and the United States). The original term, BRICs, came from a 2001 Goldman Sachs research report. The BRIC countries had ambitions to become for the emerging world what the G7 is for advanced nations. They held their first summit in 2012 but have faded from the headlines in recent years.

But in June they held a virtual Summit and presented an ambitious list of proposals for strengthening the group’s economic and political influence. An important attendee was Russian President Vladimir Putin who unveiled a plan for a new reserve currency based on a basket of member currencies. He also promoted the use of Russia’s financial messaging system as an alternative to the western-dominated SWIFT network that Russia was barred from in the wake of its invasion of Ukraine. China’s Vice Minister of Commerce, Wang Shouwen, suggested establishing a free-trade agreement among the five. Perhaps most significant was Chinese President Xi Jinping pushing for expansion of the group’s membership to include Iran and Argentina.
China and Russia would both like the BRICS to become the “anti-G7” to rally the emerging world in opposition to the ‘hegemonic’ West. However, India and South Africa appear to be playing both sides, perhaps to ensure that they’re ultimately on the “winning side,” as the world begins to divide over the Russia – Ukraine conflict.
While many economic commentators have been dismissive of these proposals and even the collective itself, these activities indicate that we are possibly on the verge of a geo-political shift which will impact the global economy, potentially for decades. Russia under Putin has now become a pariah to the West and we are not sure when Russia will get back into its good graces. Similarly, China has long been seeking greater global power and influence. Both countries are unhappy with the fact that the dollar is currently the world’s reserve currency and would love to see it replaced with another, if for no other reason than to avoid financial sanctions as each country pursues their own ambitions. A great read that touches on a lot of these issues is “The Changing World Order” by hedge fund manager Ray Dalio.
Looking Forward
These days we fondly reminisce about the fall of the Berlin Wall, the eventual end of the Cold War, and how we hoped that these events would usher in a new period of global peace and prosperity. But those hopes were quickly dashed by the Gulf War, the 1997 Asian financial crisis, the 1998 Russian financial crisis, 9/11, the dot com crash, the housing bubble, etc., and today, we have to accept that there is no escaping an endless rhythm of good and bad. As a result, we will see cycles of great investment opportunity like the 80’s, 90’s and the 2010’s, and cycles of great investment disappointment like the 70’s and the 2000’s.
Now, this does not mean that you can’t make money as an investor, or even a trader during decades like the 70s or 2000s. I can personally attest that my parents dutifully invested a portion of my dad’s paycheck into shares of his employer, the Ford Motor Company and they also took advantage of the employee stock ownership program which allowed them to reinvest their dividends. Looking at data going back to 1972, Ford increased their dividend from $.0219 per share, to $.0406 by 1980, almost doubling the payout. While that payout may seem meager, don’t forget that according to the Bureau of Labor Statistics, $100 in 1972 would be $699 today.
Of course, there were many companies that increased dividends in the 1970s and many are still around today, while others have been acquired or merged out of existence. Below is a list of some companies that not only raised their dividends annually during the 1970s but have continued to do so for the last four decades:
- Dover
- Genuine Parts Company
- Emerson Electric
- 3M
- J&J
- Coca-Cola
- Colgate Palmolive
- Stanley Black & Decker
- Proctor & Gamble
- Hormel Foods
While many of these names are familiar, none of them are exciting and few are regularly talked about in the financial media other than a brief earnings mention.
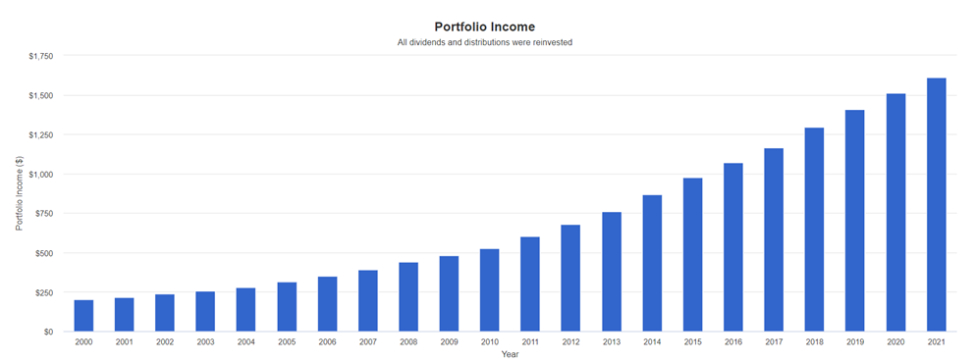
Using a back-testing program we are able to simulate what $10,000 invested equally in these ten stocks in 2000 produced by December 2021 versus an S&P 500 ETF (SPY), assuming you reinvested your dividends and before management fees.
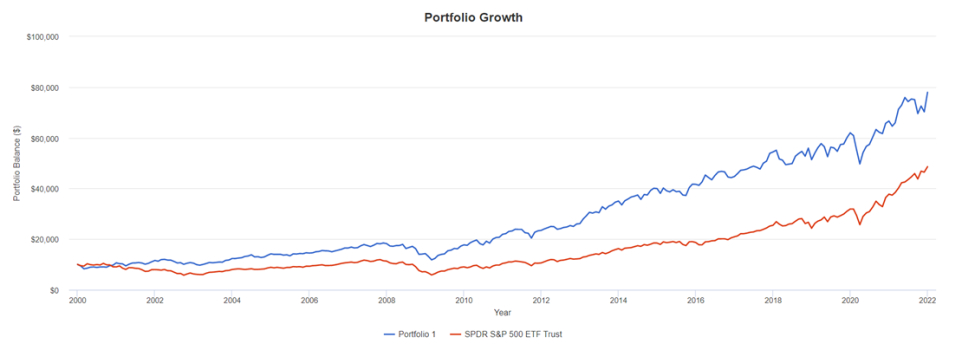
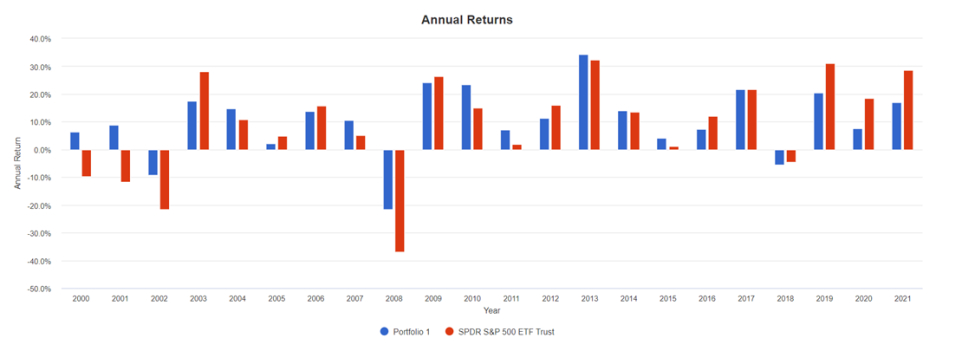
While hindsight is 20-20, one still wonders why this type of investing isn’t generally promoted. Perhaps the answer has to do with the fact that this type of buy and hold strategy doesn’t produce much profit for Wall Street. Nor would you see those funny commercials from E*Trade and Ameritrade. Nobody would buy those books that explain how to trade for a living from your kitchen table. Imagine an investment newsletter that, every month for 20 years, showed you the same ten-stock portfolio and told you to stay the course.
Now, would this have been the best portfolio to own? The answer is probably not. Are there companies that not only raised dividends every year, but also raised them aggressively? Are there growth companies that are becoming dominant in their industries? Are there companies with an emerging technology that may disrupt an entire portion of the economy? Finally, are there once-great companies like GE making business decisions that are adversely impacting their business and should be sold?
These are the kinds of questions we try to answer every day and we make both portfolio and allocation adjustments as dictated by our research to keep portfolios in harmony with our clients’ long-term investment goals. With success, one day we may be able to live our lives independent of a paycheck or even social security benefits.
That’s the value we bring to this relationship, we evaluate the data and make investment decisions based on your individual financial situation so that you can focus on life’s other priorities. Propelling your investments forward is our highest priority, and we are grateful for the trust you put in us and our work.
In closing, short-term volatility can be painful, but probably not as potentially harmful as short-term thinking when it comes to portfolio management. Losses aren’t losses until they’re locked in by sales. We have over 100 years of history showing that the stock market climbs higher over time.
When the market is in turmoil, it’s best to focus on long-term goals rather than short-term fluctuations. Investors can take a step back and see that their equity portfolios have posted substantial returns over the last couple of years. They can focus on factors such as their dividend income stream which, if managed well, is less likely to be affected by market volatility.
Investors should be paying attention to equity valuations and their underlying fundamentals, rather than share price movements. If you’re a long-term investor, stocks getting cheaper is a good thing. It allows for you to accumulate more shares at better values.
By looking at these positive portfolio aspects through a broader lens, it’s easy to see that a correction or even bear market likely hasn’t destroyed long-term financial goals.

