The Market Is Up. Why Isn’t My Account?
If you are confused about what is happening in the U.S. stock market right now, you are not alone.
 After suffering a significant drop in March and April, the S&P 500 index (SPX), a very commonly-used benchmark for many funds and advisors, and what many people consider to be “The Market” has recovered from the crisis and pierced the 2020 highs established in February.
However, for many individual investors, the result is not the same for their personal accounts.
In many accounts, the answer is as simple as asset allocation.
Since the SPX is a stock index, only a 100% stock portfolio would even have a chance of matching the performance of the index.
In fact, a popular asset allocation model using Vanguard Mutual Funds that we track internally lags behind the SPX. This asset allocation model begins each calendar year with a 60% allocation to stocks split between US and foreign with the remaining 40% split between Bonds, Treasuries, REITs and Precious Metals. Hopefully, few people invested in such an allocation would expect SPX-like performance.
Even if you do have an account that is 100% invested in stocks, it may still lag for several reasons.
Remember that the S&P 500 is considered a large-cap stock index. According to S&P Dow Jones Indices, the index’s manager, a company must have an adjusted market cap of $8.2 billion to be included in the index. Additionally, the stock must trade (change hands from a seller to a buyer) at a minimum volume of 250,000 shares in each of the six months leading up to the latest evaluation date.
If your portfolio is allocated between a number of large, middle and small cap stocks, as many are, your performance will likely be different than the index and, depending on which stocks you own, it could vary greatly.
Another thing to consider is that the index has a cap-weighted construction. This means its components are weighted according to the total market value of their outstanding shares instead of being equally weighted as many stock portfolios tend to be, at least at initiation. Those components with a higher market cap carry a higher weighting percentage in the index. Conversely, the components with smaller market caps have lower weightings in the index. Therefore, the performance of the index will be heavily influenced by the performance of the higher-weighted components.
Taking a glance of the index this morning on the Marketscreener.com website, we see that the top ten stocks by weight make up over 45% of the index weight.
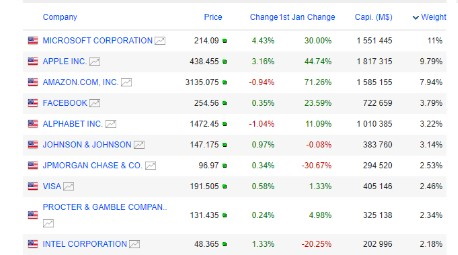
Top Ten S&P 500 Components by Market Weight
Looking at the performance of those top 10, you see that seven out of those ten stocks are positive year-to-date.
The top 5 stocks on the list belong to the group of stocks known as FAANGM (Facebook, Amazon, Apple, Netflix, Google (aka Alphabet), and Microsoft).

FAANGM’s share of S&P 500 market cap alone is 37.23% as of today.
In other words, because the S&P 500 is a market-cap weighted index, the performance of these six stocks drives approximately one-third of the movement in the index. If the FAANGM stocks move higher, the S&P 500 is most likely moving higher. If the FAANGM stocks move lower, the S&P 500 is most likely moving lower.
So again, if your portfolio is weighted similarly with these six stocks, congratulations. If it isn’t, then do not be surprised that it is not keeping up with the index.
To that point, the S&P 500 Equal Weight Index (SPW) is down 7.6% as of July 31 versus a positive 1.25% for the cap-weighted index (SPX). Examining the full roster of stocks in the S&P 500, we see that 300 of them are down for the year, so this would make sense.
The final and most important point is your chosen strategy, or the purpose for your investment selections.
 At Summit, this is an important conversation with our clients as purpose drives expectations. If you are investing primarily as a source of income, then your stock allocation is more likely to contain a healthy portion of dividend-paying stocks. Only two of the above mentioned FAANGM stocks pay dividends. Any income derived from the other four would have to come in the form of capital gains.
Therefore, you would have many other stocks in your portfolio that do not necessarily match the performance of either the market cap weighted or the equal weighted indices. The performance of those investments, while serving the purpose they are intended for, could be disappointing on a Total Return basis when comparing to what you think is “the market.”
As an example, the Dow Jones US Select Dividend Index (DJDVP) represents the stock performance of the US’s leading dividend-paying stocks and sports a current dividend yield of 5.15 % versus 1.86% for the SPX. The DJDVP is still down over 21% year to date. So, you must ask yourself, are you happy that many of these stocks are still reasonably priced by historic measures, or are you keeping awake at night because the market is leaving you behind?
The point is, to be a successful, long-term investor, you have to construct a portfolio that aligns with your particular needs and objectives and then employ the proper benchmarks in order to accurately gauge whether or not the portfolio is actually performing as designed.
At Summit, we use risk tolerance based allocations to gauge account performance as we have found that volatility is something that impacts client emotional reactions to performance in the short-term while the particular purpose of the portfolio, be it growth, income or safety, impacts their satisfaction in the long term.
So if you want to keep up with “the market,” invest in an index-linked fund or ETF that will do so. If you want to invest in a way that aligns with your personal goals and objectives, then ignore the market and choose a benchmark that will provide a better measure of performance.
https://www.marketscreener.com/S-P-500-4985/components/
https://investorplace.com/2020/04/faangm-stocks-are-driving-the-sp-500-higher/

