Fourth Quarter 2020 Market Review
Back to the New Normal
Happy New Year!
Here is hoping that 2021 will be good to you and all of your loved ones.
Before we get into any great details, let’s get a few housekeeping items out of the way.
Thank you for responding to our mailing regarding the delivery of your quarterly reports. By opting out of the mailed, paper copies you not only help us control costs, but you also enable us to create enhanced features for our quarterly letter such as embedding links to articles that we may reference in our writing. So, while we will still write about key points of interest, we can add a link to some of the background material for those of you who enjoy keeping up with the latest news and research that we find.
Secondly, we are finishing up work on a substantial upgrade to the client portals. These improvements will include both more comprehensive reporting as well as more interactive features that will allow you to dig deeper into the details of the accounts you are tracking including any held-away accounts such as 401Ks. As we roll it out, we will be available to help guide you through any questions you may have to ensure that your experience is the best we have to offer. Additionally, for anyone who wants to stay with the current configuration, we can accommodate those requests.
Now to the markets.
Q4 ended about the way we expected with the major indices all touching record territory. The S&P 500 returned 18.4% for the year and 12.1% in the fourth quarter alone. It was a bumpy ride, with volatility driven primarily by the pandemic and the election, taking the S&P 500 below its 50 Day Moving average (Blue Line) in the month of October.
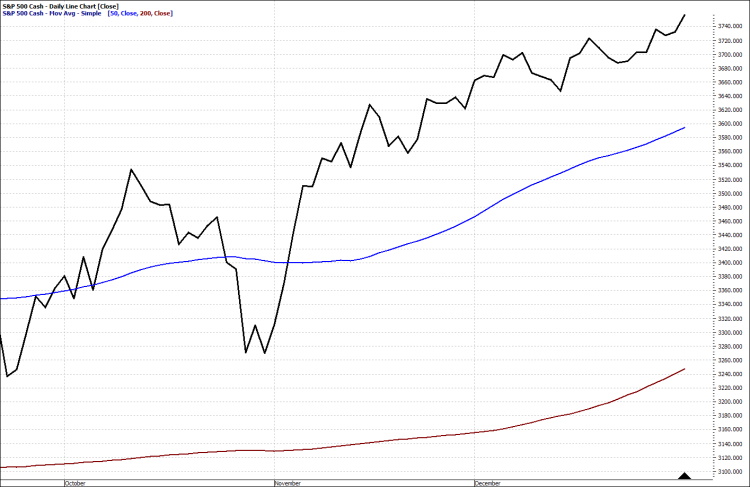
S&P 500 Daily Chart Q4 2020
If this looks a little familiar, we saw a similar market reaction in Q4 of 2016.
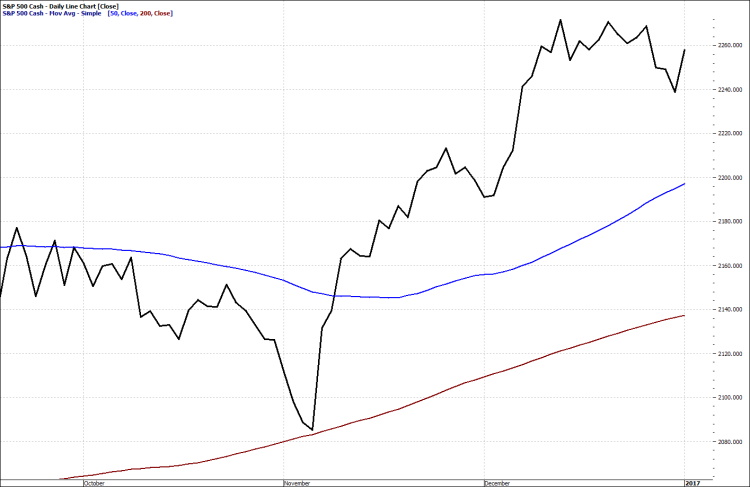
S&P 500 Daily Q4 2016
We believe that it was Mark Twain who said, “History doesn’t repeat itself, but it often rhymes.” The market that we work in today is far different than that of our parents or grandparents. Thirty years ago, Etrade was just getting off the ground with the idea of online stock trading and cable stations like the Financial News Network and CNBC were struggling for viewership. By 2000, over 140 online brokerage firms existed and the number of individual investors trading online exploded. Fast forward to 2020 and we now have mobile apps, led by Robinhood, which allow individuals to trade from their mobile phones. Additionally, as we have mentioned before, the big money institutions, investment banks, pension funds, mutual funds and hedge funds, have steadily incorporated algorithmic trading systems leveraging the speed and computational power of computers to try to front run the human traders to gain quick profits.
These technological advancements have led to an increase in market distortions which lead to an increase in short term market volatility. We do not expect this volatility to end so it is essential that we continue to focus on strategies that lead to the achievement of our long-term investment objectives. At the same time, we are trying to insulate our portfolios as much as possible from short-term market fluctuations that can lead to sleepless nights.
The major market indices finished the year strongly and were all positive for the year, despite the COVID-Crash in March. However, the positive results were largely due to the performance of a relative handful of stocks.
As we wrote in our last Quarterly Letter and in an insight post, the FAANGM (Facebook, Apple, Amazon, Netflix, Google and Microsoft), along with Tesla and vaccine-oriented biotechnology stocks like Moderna have driven the indices higher, particularly the Nasdaq 100 and the S&P 500. Many stocks have lagged far behind them. To further this point, we look at the market sectors, which were quite clearly split between winners and losers.
Select Sector SPDRs are targeted exchange-traded funds (ETFs) that divide the S&P 500 into 11 sector index funds. These sectors are communication services, consumer discretionary, consumer staples, energy, financials, health care, industrials, materials, real estate, technology and utilities. Taken together, the 11 Select Sector SPDRs comprise the S&P 500 as a whole.
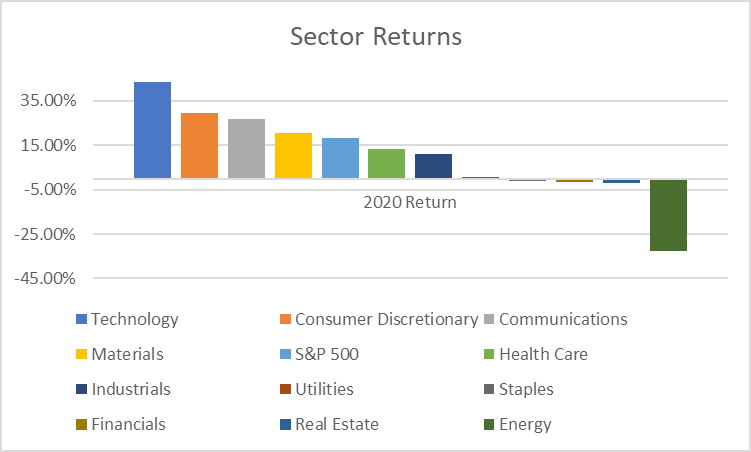
Following the lows of late March, all 11 S&P 500 sectors recovered. For some, the bounce-back was much stronger than for others. Income oriented sectors (energy, utilities, real estate) mostly underperformed for the year, while technology was on top for the second straight year. The tech-heavy NASDAQ Composite gained a whopping 43.6% in 2020.
The sectors which outperformed the index were technology, consumer discretionary, communication services and materials. Surprisingly, health care was not on this list as some would expect, possibly due to the decline in highly profitable, elective procedures due to capacity demands (real or anticipated) from COVID-19 cases. Other sectors which underperformed were industrials, consumer staples, utilities, financials, real estate (driven by office and retail REITs) and energy.
Using sector ETF 2020 returns, the S&P 500’s dependence on just four of the eleven sectors becomes quite clear.
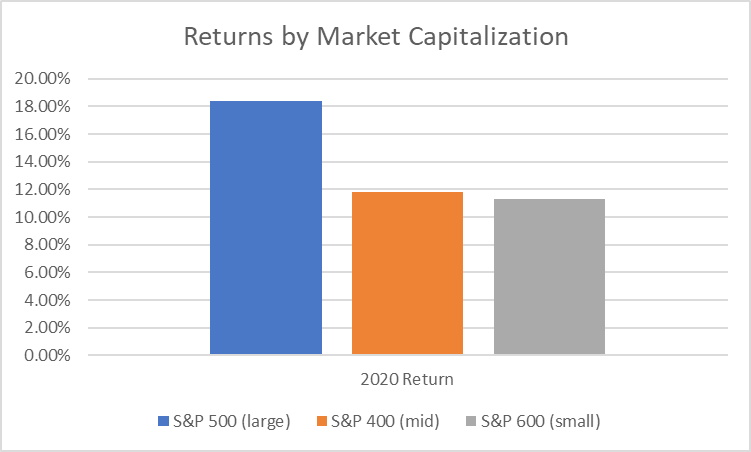
But the performance story of 2020 is more than just sectors, as important as those were. To a lesser degree, it was also a story of size, with the market’s largest companies outpacing its smallest, as can be seen below.
The good news is many of the non-FAANGM stocks pay dividends. In fact, Dividend payments to investors in the S&P 500 rose to a new record in 2020, up 0.7% to $58.28 per share from the previous record set in 2019, according to research from S&P Global. This marked the eleventh consecutive annual dividend increase for the S&P 500 index.
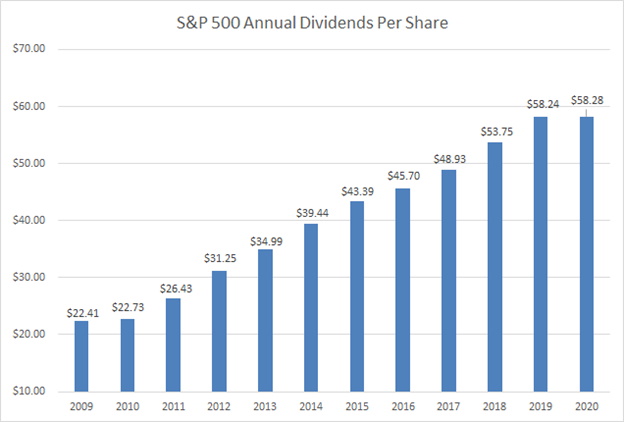
The growth in dividends was due to a strong first quarter and a strong fourth quarter. While the dividend cuts received a lot of publicity, particularly in the big-name firms such as Disney, at the end of the day we ended up with record dividend incomes.
In 2020, there were 423 companies on the S&P 500 that paid a dividend:
287 companies raised dividends
11 companies initiated dividends
27 companies cut dividends
42 companies suspended dividends
At the end of the year, there were over 61 companies that not only pay dividends but have increased them annually for at least 25 years. These are referred to as the S&P Dividend Aristocrats. We point this out in the context of an economy that is being ravaged by pandemic lockdowns to help you understand our philosophy when it comes to investing.
As you all know, one of our favorite stories is set in 2008 when Coca-Cola’s stock price was crashing from its 2007 highs. The company raised its dividend over 12% rewarding investors who bought the “business” with an increase in cash flow. As we see in the chart below, the price eventually recovered and set new highs.
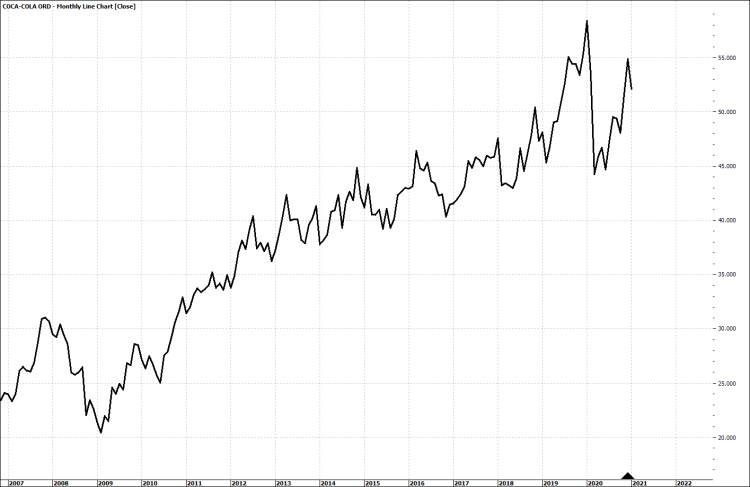
KO Monthly Stock Chart
In case you were wondering, Coke was one of the companies that increased their dividend in 2020.
We saw above that the market favored large cap stocks in 2020. Another way to see this is by looking at the performance of the S&P 500 which is market capitalization weighted (meaning the largest companies affect the index the most) compared to an equal weighted S&P 500 (meaning every company exerts the same influence).
In the chart below, we see that the equal weight index began out-performing the market cap weighted index in the fourth quarter, which we see as an indication that money is starting to be deployed more broadly across areas of the market outside of large caps and technology. It is our belief that this broadening bodes well for longer term price recovery in those areas of the market.
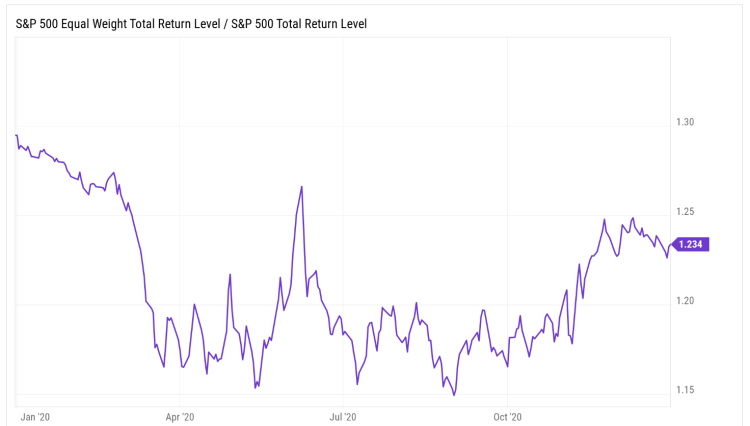
Read more about how the S&P 500 Equal Weight Index is constructed.
Looking Forward
We believe that the purpose of investing is to build and manage wealth which we define as having the ability to pay our living expenses without the need of an employer’s paycheck.
This viewpoint is why we constantly remind you that our focus is on cash flow versus rates of return. We have little control over rate of return, no one does. Cash flow is generally more reliable and certainly more manageable. In pursuing this, we spend our time and effort finding those investments that we believe will provide the relatively safest and most reliable cash flow in the existing economic environment. These strategies are actively managed and we spend most of our time screening our portfolios, adding those businesses that offer the best long term opportunities while culling any that show signs of faltering.
We do pursue capital gains through various trading strategies and in doing so, we tend to be trend-followers versus market-prognosticators but still always pursuing the strongest businesses or fundamentally sound funds that will benefit from the trend.
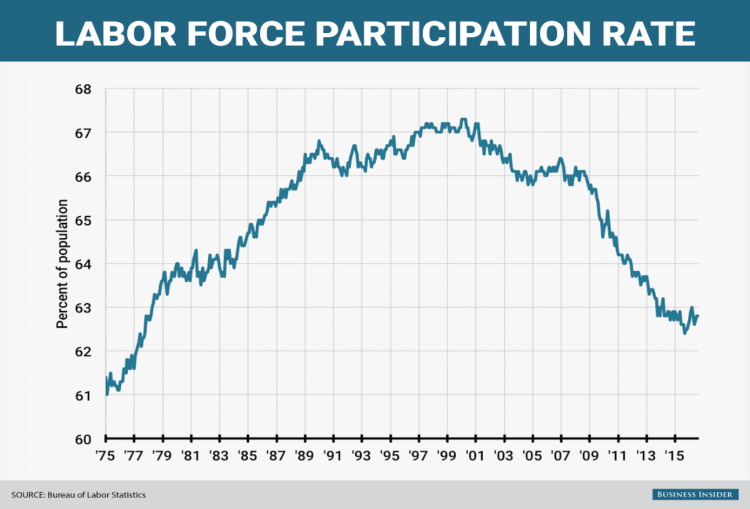
We believe that 2021 will see a return of market / economy dichotomy that baffles financial pundits while enriching those who see and act on the big picture. The housing bubble of 2008 left the economy in shambles, home values in many cases dipped below mortgage balances. Labor Force Participation, which we think is a better indicator of real employment, was starting a precipitous slide toward 1970’s levels.
Gross Private Sector GDP (the private sector economy) severely declined.
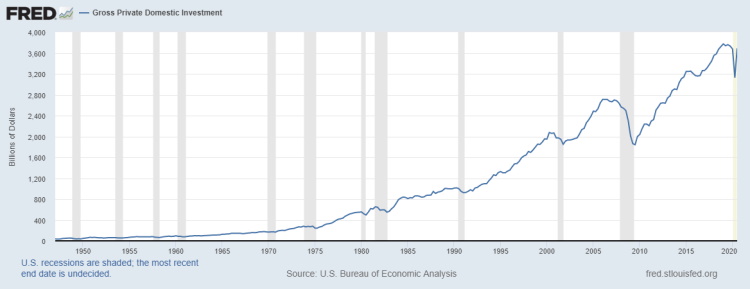
We kept waiting for the “Mother of all Bear Markets” to wipe out the nation’s wealth so that we could buy great companies for pennies on the dollar. Instead, we saw a combination of quantitative easing (QE) programs, I, II, III, and IV, ZIRP and the threat of NIRP flood the markets with unprecedented amounts of cash. This tsunami of cash led to one of the longest bull markets in history.
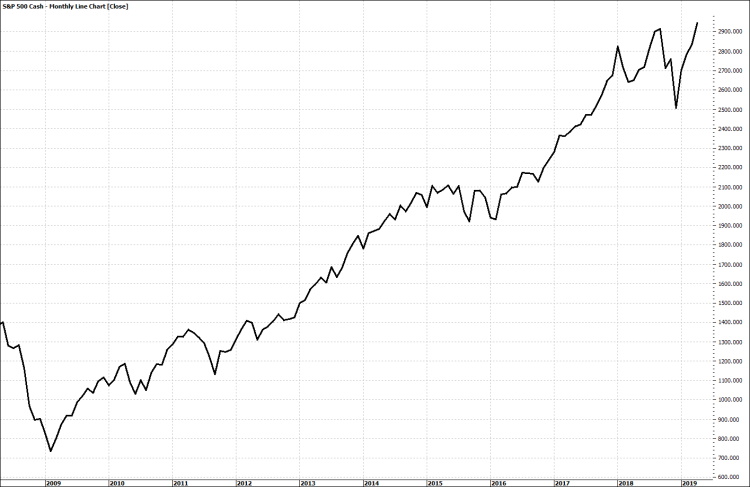
S&P 500 Monthly Chart 2008 – 2018
In fact, the correction that ended the bull run in 2018 was in part blamed on the Federal Reserve’s attempt to “normalize” interest rates in line with the strength of the US economy.
Fast forward to January 4, 2021 and the economy is in far worse shape than it was in 2008 and as I write this from my office in California, the Governor has, for the third time, changed the conditions for reopening the economy which leads us to believe that we will be locked down well into the summer. Yet the markets are sitting near new highs and with nearly $7 trillion in stimulus floating around combined with our TINA (There Is No Alternative) view of the markets, we expect to see stocks go much higher for much longer than any rational economist could imagine.
This is why we chose our title; it was during the last market / economic dichotomy we were told that this was the “new normal.” Whether it is the old “new normal” or a new one doesn’t matter. What matters is that we pay attention to what is happening and act accordingly in order to take what the markets are willing to give us.
Will the ride be a smooth one? We doubt it, there are always speed bumps along the way and they need to be monitored with the utmost vigilance. Delays in vaccine distribution or adverse reactions to the vaccines, a sudden and sustained rise in inflation and a resulting rise in interest rates, or changes in policy stemming from a new administration could imperil the short-term market performance. In the long run, these “speed bumps” should provide buying opportunities for long term investors trying to build wealth.
As always, we will be with you all the way, staying vigilant on anything that poses a threat to your objectives and looking for the best combination of strategies that will fit the changing environment.

