Turn Investments into Income with Summit’s Equity Yield Portfolio
 Stock investments can be used to provide a steady, and possibly growing, stream of income. If selected carefully, there are companies that will steadily raise their dividend payments over time. Some companies have increased their dividends every year for decades.
An attractive feature of this portfolio is that the stocks selected tend to be less volatile than those in growth-oriented portfolios, which may make it less vulnerable to a market decline.
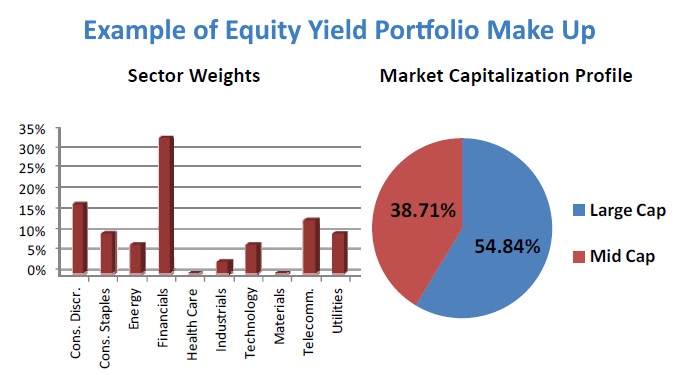
The Equity Yield portfolio starts with the top ranked stocks from our All Cap Core process. Investments from this select group are limited to those yielding significantly more than the market average.
Bond Substitute Investment Portfolio Can Generate More Income with the Same Principal
When bond yields are low, our Equity Yield is an attractive option. Investors can actually earn more annual income from a stock based portfolio than they would with bonds.
Living off a fixed amount can be easier if you choose a dividend-based investment portfolio designed to provide annual income.

Unlike bonds, which are contracts locking you into an unchanging income stream, stock dividends often go up. The ultimate maturity value of a bond is also contractual and unchanging. With Summit’s Equity Yield portfolio, not only could you receive more money in dividends every year, the value of the stocks generating those dividends may also increase.
Contact Milwaukee area financial advisors to establish an investment portfolio for income generation.
Summit does not guarantee future performance and all investing includes the risk of loss.

Sample Portfolio Characteristics
| Median Portfolio Statistics | Equity Yield |
|---|---|
| P/E 1 Year Forecast | 14.2x |
| Price / Sales | 1.8x |
| Price / Book Value | 2.2x |
| Price / Cash Flow | 7.2x |
| Return on Equity (5 Year) | 4.1% |
| EPS Growth (5 Year Estimate) | 13.0% |
| Market Cap (Billions) | $17.7 |
Example of Largest Holdings (excluding cash)
| Ticker | Company Name | % Weight |
|---|---|---|
| KMB | Kimberly Clark Corp | 3.81% |
| JPM | JP Morgan Chase & Co | 3.45% |
| PPL | PPL Corp | 3.33% |
| INTC | Intel Corp | 3.32% |
| KIM | Kimco Realty Corp | 3.29% |
| T | AT&T Inc | 3.29% |
| POR | Portland General Electric | 3.23% |
| DRI | Darden Restaurants Inc | 3.22% |
| WRI | Weingarten Realty | 3.16% |
| PEP | Pepsico Inc | 3.09% |


