First Quarter 2026 Letter to Our Clients

The major indices limped into the end of the quarter with the Dow Industrials barely eking out a gain, while the tech-heavy Nasdaq and the tech-weighted S&P 500 finished below where they started.

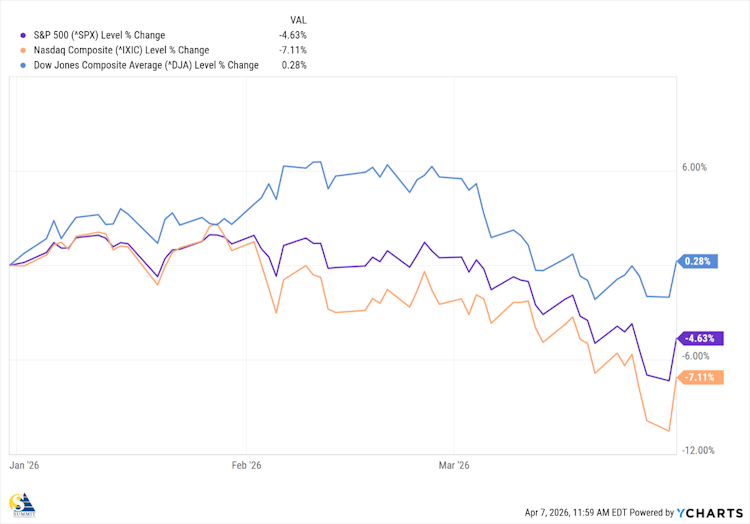
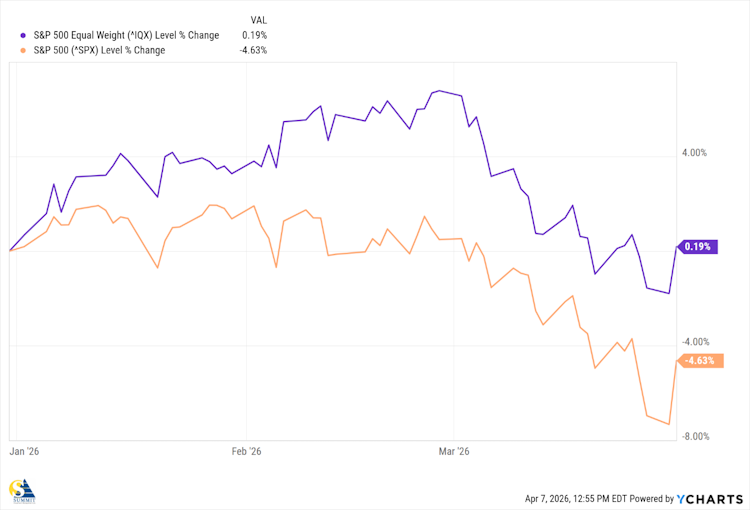
Demonstrating the impact of tech stocks on the S&P 500, the index’s equal-weighted version comfortably outperformed its cap-weighted version, where the Mag-7 make up nearly 30% of the index.

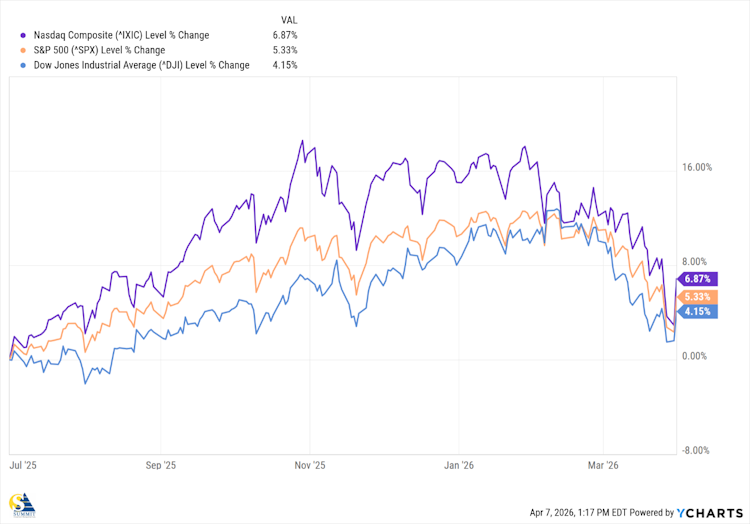
While most of the downturn happened since the start of the Iran conflict, tremors began to appear in the fourth quarter of 2025, especially on Nasdaq.

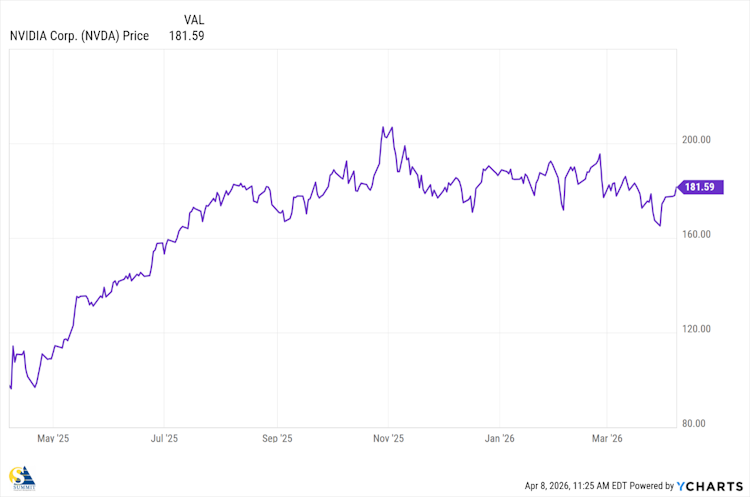
It started with talk of an AI bubble in November. We addressed the arguments, both pro and con, regarding the AI bubble in our Q3 2025 Letter and, in our Q4 2025 Letter, suggested that we would start to see a clear separation between AI winners and losers this year. However, even clear AI dominators like Nvidia Corp, showed signs of stress as the share price has been relatively flat since November.

Then, starting in January, we saw another meme emerge: “AI will eat the world!” It started with software providers. Traders began selling software stocks in a frenzy after the company, Anthropic, announced new updates to its enterprise AI suite of tools that allow AI agents to independently execute complex, multi-step professional workflows—such as reviewing legal contracts, drafting documents, and automating data analysis—rather than just acting as simple chatbots that we are familiar with.

Investors panicked because the update signaled that AI could directly replace recurring software licenses and headcount-based service models, leading to a “SaaSpocalypse”. SaaS stands for Software as a Service and was the next big thing, not too many years ago, as part of the smart home movement.

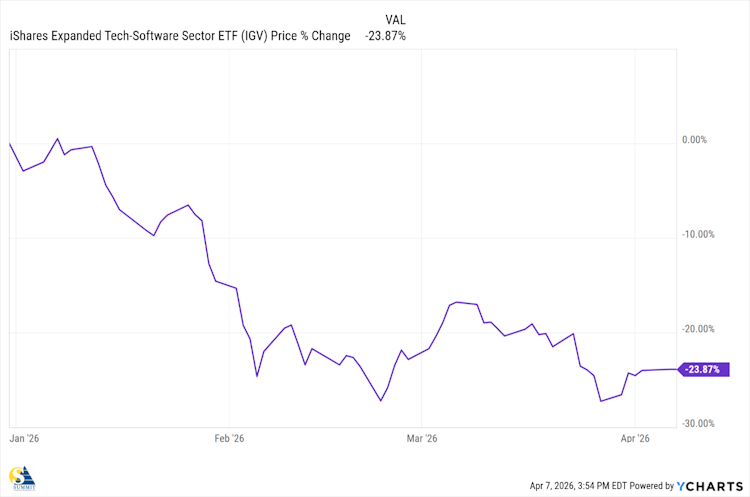
The iShares Expanded Tech-Software Sector ETF (IGV) dropped 24% within weeks of the announcement and has yet to recover.

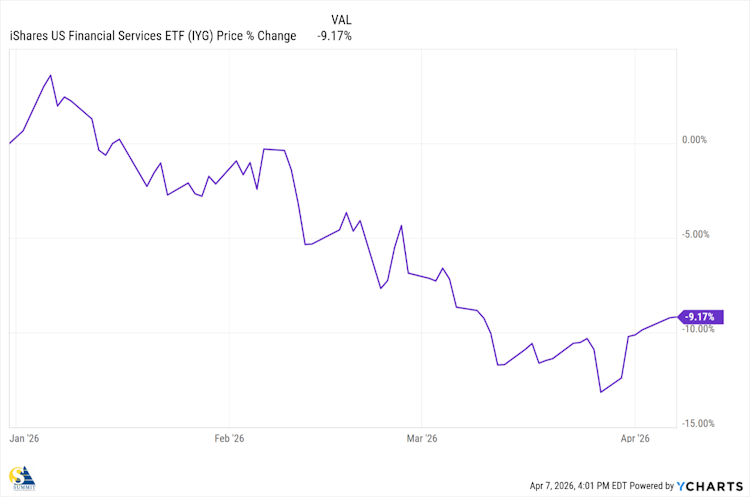
Not long after that, we started hearing of fears that AI would make banks and financial institutions obsolete, leading to a drop in financial stocks. iShares US Financial Services ETF (IYG) fell nearly 8% in a matter of weeks.

We note that these two investment themes, the AI Bubble and AI is Taking Over, seem to be contradictory at first blush. However, just as with the internet or the “Dot-com” Bubble, both themes can be valid simultaneously. While the 77% drop of the Nasdaq index wiped out many worthless companies, it also created a tremendous buying opportunity for many companies that have shaped our economy, including Apple, Google (now Alphabet), and Amazon.

AI is another technological leap forward, and the winners will also have a tremendous impact on our economy. But progress never advances in a straight line and we should expect to see distortions and displacements along the way that will need to be managed with patience and objectivity.

The market action has also rattled the private credit markets. It is said that private credit portfolios hold many loans to start-up software firms, so if these companies are driven out of business by AI, they won’t be able to repay those loans. Nervous investors in space started trying to get their money back. In the first quarter, they asked to withdraw nearly $14 billion from a major group of private credit funds.

The problem is that private credit portfolios aren’t as liquid as stock portfolios. There are limits to how much money they can give back to investors, and as a result, most funds started capping withdrawals, which is the last thing you want to see if you’re worried about your investments.

As a result, some of the major publicly traded private credit (and private equity) firms have incurred stock losses since then. Ares Management (ARES), Apollo Global Management (APO), and Blue Owl Capital (OWL) are among the largest private credit managers, and their stocks have fallen sharply recently.

We do not think this is a repeat of the 2008 mortgage crisis; however, we will stay on top of the situation and take defensive action if circumstances warrant. But it is also a lesson about chasing returns without a full understanding of the underlying market.

We have no doubt that the short sellers who drive much of this downward pressure would have gone down the list of health care, communication services, and information technology if not for the start of the Iran conflict.

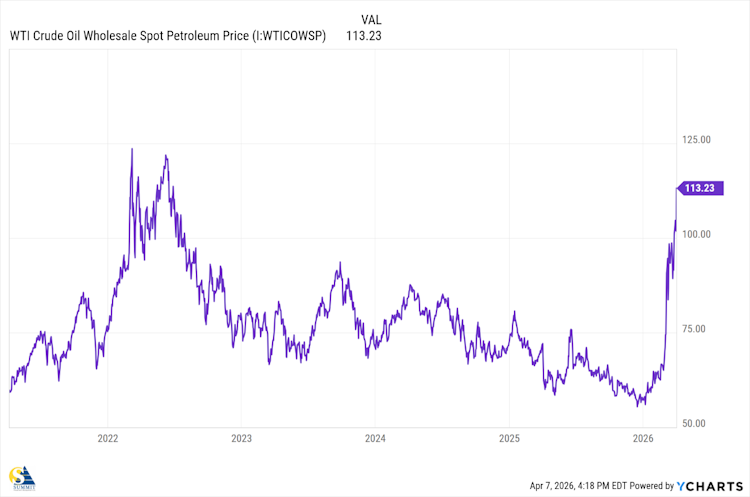
The conflict started on February 28th and, as of this writing, still continues. Oil prices, as measured by West Texas Intermediate (WTI), have continued to climb with each passing week and are now approaching levels last seen in 2022 at the onset of the Russia-Ukraine conflict.

We have no idea how or when the Iranian conflict will end, but we do have data on market behavior during military conflicts.

The Market & War

Historical evidence shows that U.S. stocks are often volatile at the onset of war or geopolitical conflict but tend to stabilize and perform well once uncertainty is resolved.

This is because markets generally react not to the conflict itself, but to changes in expectations—duration, economic disruption, inflation, and policy response. When a conflict begins, the large, index-moving investors often de‑risk, producing short‑term drawdowns. Once the scope becomes clearer, equity markets typically refocus on fundamentals such as earnings growth, fiscal stimulus, and productivity.

This pattern is visible as far back as World War II, when U.S. equities rose meaningfully despite global devastation, supported by industrial expansion and government spending. Similar behavior occurred during the Korean War and the Vietnam War, in which markets experienced interim volatility but ultimately advanced over the life of the conflict. Even during smaller, more acute events such as the 1990–1991 Persian Gulf War, stocks declined sharply ahead of combat operations but rebounded quickly once military clarity emerged, with the S&P 500 posting strong gains in the year following the invasion.

The chart below is a schematic, long‑term visualization of U.S. equity market behavior (indexed growth) with major conflicts annotated:

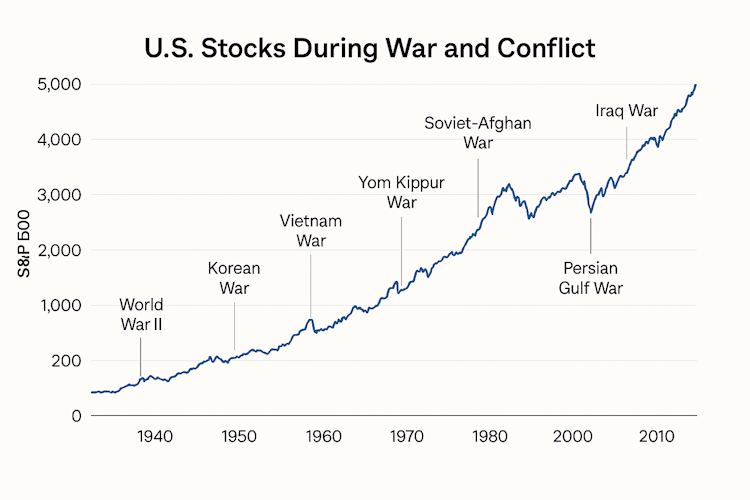
While no two periods are identical—and inflation, interest rates, and valuations matter greatly—the consistent lesson is that short‑term geopolitical shocks have not prevented long‑term equity growth.

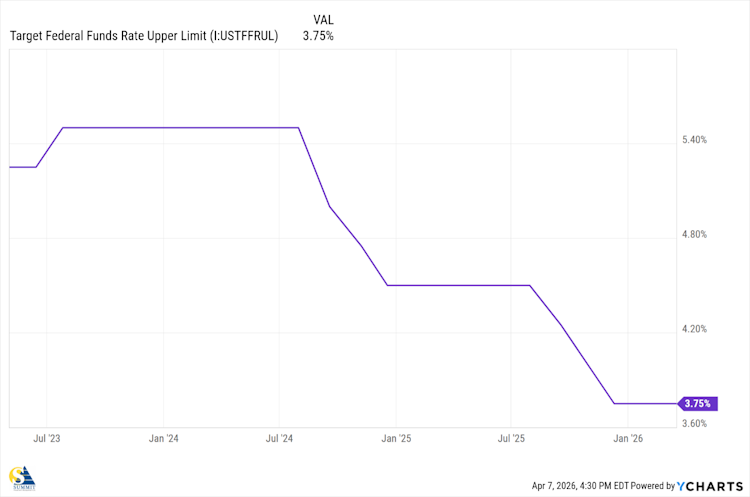
We believe investors are more worried about interest rates, as the spike in oil prices will undoubtedly lead to higher prices, leading the Federal Reserve to maintain rates where they are, or even start increasing them if oil prices remain elevated.

Earnings

On the fundamentals side of investing, the S&P reported 14% earnings growth in Q4 2025, marking the 5th straight quarter of double-digit earnings growth, according to Factset.com.

The Information Technology sector reported the highest earnings growth among the 11 S&P 500 sectors, at 33%.

73% of the companies reported earnings that exceeded analyst estimates, which is below the 5-year average of 75%, 51 companies issued positive EPS guidance for Q4, and 59 have issued positive guidance for Q1 2026, which is the highest number in 5 Years, and Industry analysts in aggregate predict the S&P 500 will see a price increase of 28.9% over the next twelve months. This again is well above the historical average.

This bodes well for at least having a “floor” where valuations present buying opportunities in financially strong companies.

As we mentioned in the Q4 letter, volatility is going to be around for a while as the market reprices every earnings, economic, and geopolitical report. Additionally, 2026 is a midterm election year, which has tended to be the worst year of the four-year Presidential cycle. Looking at the midterm years of this century, 2022, 2018, 2014, 2010, 2006, 2002, the S&P 500 index was down an average of 2%. Going back to the 1950’s, midterm years have historically been the worst, with an average intra-year drawdown of 18% from peak to bottom, according to PinPoint Macro Analytics.

For investors with clear objectives and defined time horizons, volatility can be mitigated in the short term and present buying opportunities for the long term. This is why we spend so much time on suitability and modeling your personal finances, so the investments are allocated to align with your personal needs and timing. We don’t try to predict what the markets will do next week, next month, or next year; we prefer to position our investments so that our plans are not disrupted by whatever happens.

We thank you for putting up with our surveys and questionnaires; the information helps us uphold our fiduciary duty to always put your individual needs first.

As always, if you’d like to discuss anything in the updates or the quarterly reports, please contact us at your convenience, and we’ll always be happy to connect with you.

The Team at Summit Investment Management, Ltd.

Read More

Third Quarter 2025 Market Review

A Most Hated Uptrend

The old adage that Wall Street climbs a wall of worry was on full display in the 3rd quarter, as all three of the major indices finished in positive territory.

Year to date, all major indices have recovered from the April tariff tantrum and are all up for the year.

Taking a broader view, we compare the equal-weighted indices with the more widely followed cap-weighted indices, and we see that while the equal-weighted indices also rose in the quarter, they rose less than half of the cap-weighted index, which suggests that a small percentage of companies still drive the much of the index gains.

This is even more pronounced when comparing the equal-weighted Nasdaq 100 to the cap-weighted one.

If you watch the cable investment channels, which we don’t recommend, or scan the financial headlines, you would see nothing but shock and near disappointment over these gains. Nearly every story or headline begins with “stocks continue to rise, despite…”, followed by whatever news of the day is happening:

“Stocks pause as bubble warnings mount”

“Stock rally falters with earnings season in focus”

And the airwaves are filled with advertisements urging us to sell everything and buy gold before it’s “too late.“ While gold has had a tremendous run and is part of our “Commodity and Metals” portfolio, we would not allocate more than 5% as part of a portfolio under any normal circumstances. Gold is a store of wealth, we own it, not because we think it will rise to $10,000 per ounce, but because we’re concerned that it might.

During this time of gloom and doom, the bond market told a different story. The interest-rate spread between risky high-yield bonds and risk-free U.S. Treasury bonds, which spiked in April during the tariff tantrum, has now returned to a more normal level.

The Bullish Case

There were three catalysts for the continued gains. The first was the passing of the reconciliation bill, which extended the 2017 tax brackets, set to expire in 2026. Most businesses plan out in one-, three-, and five-year periods, and removing the uncertainty of federal tax policies makes planning much easier and more accurate, which then impacts analyst recommendations.

The second was better-than-expected economic data, as Real gross domestic product (GDP) increased at an annual rate of 3.8 percent in the second quarter of 2025 (April, May, and June), according to the third estimate released by the U.S. Bureau of Economic Analysis. This was a significant reversal of the Q1 measure of -0.6 percent, which temporarily reduced fears that new tariffs and subsequent trade deals would cause a recession.

The third catalyst was the Federal Reserve Open Market Committee’s decision to cut rates by 25 basis points and to lower its target range to 4.00-4.25%, marking the first rate cut in 2025. Additionally, the Fed signaled that two more cuts might be on the way before the end of the year, at the two remaining meetings in October and December.

The committee noted recent sluggishness in the labor market in its post-meeting statement, which also stated that economic activity has “moderated” and inflation “has moved up and remains somewhat elevated.” The central bank’s dot plot, which shows individual members’ anonymous expectations, indicates a median estimate of 3.4% for the federal funds rate at the end of 2026, and Fed members are projecting 1.6% GDP growth for 2025, a 4.5% unemployment rate, and 3% inflation.

Theoretically, the Fed Funds Rate should be “neutral” 80 percent of the time, while it should either be restrictive to fight inflation or stimulative to boost economic growth, the other 20%. However, as is common with most theories, the neutral rate is estimated using various models and can vary over time based on current economic conditions.

As of September, the Fed’s current estimate of the neutral rate is around 3.7 percent, which is higher than they expect it to be at the end of next year and suggests that their current stance is still restrictive, as the effective nominal federal funds rate is currently in the range of 4.25 percent to 4.5 percent.

As we have discussed, these short-term catalysts create short-term “tailwinds” for stocks as many investors pour money into index-tracking ETFs such as SPY and QQQ.

In the long run, it is still profits that drive stock prices, and here, too, the overall results were very positive. According to FactSet, 81% of S&P 500 companies reported actual Earnings above analyst estimates, the highest number since Q3 2023, and the S&P 500 reported growth in earnings of 11% – the 3rd straight quarter of double-digit growth. The communication Services sector, which includes Google, Meta, Amazon, and Netflix, reported the highest earnings growth of all 11 sectors. Fifty S&P 500 companies issued positive Earnings guidance for Q2, which is above the 5-year and 10-year averages, and Analysts increased Earnings estimates for S&P 500 Companies for the first time since Q4 2021.

So, heading into the last three months of the year, we have short-term. tailwinds coupled with strong earnings projections, which should support continued price appreciation.

However, as Chairman Powell commented in his press conference following the rate cut decision, “There are no risk-free paths now” and we have to stay aware of all the potential risks both to asset prices and our investing objectives. We agree, there is no risk-free path to sustainable wealth, and we have to keep our eyes on the potential threats to our investment plans.

Geopolitics

In September, China hosted the annual summit of the Shanghai Cooperation Organization (SCO). This group was established by China in 2001, originally focused on security in Central Asia and the wider region. It has since grown to 10 member states and is viewed as a means for China to increase alliances and expand its influence in the area. The summit was immediately followed by a military parade commemorating the 80th anniversary of Japan’s surrender at the end of World War II.

The parade showcased some of China’s most advanced homegrown weapons and attendees included Russian President Vladimir Putin, Iranian President Masoud Pezeshkian, and North Korean leader Kim Jong Un.

The inclusion of both Russia and Iran in a military display is being viewed as provocative at best and a harbinger of increasing international tensions for the foreseeable future, as China is openly choosing sides in both the Russia-Ukraine war and the Middle East peace process. The 1960s were marked by the Cold War and the threat of mutual nuclear destruction. We thought we’d gotten past that; however, Russia’s actions and ongoing threats, perhaps with the backing of SCO members, are a cause for great concern.

The AI Bubble

Below is a chart of the top stocks by market cap that are directly involved with artificial intelligence (AI) and/or have significant exposure to the growth of AI technology. We added the S&P 500 index for reference.

The entire list of AI stocks includes more than 63 companies, with a collective total market capitalization of $23.13 trillion and generating total revenue of $2,345.63 billion. In comparison, the entire S&P 500 boasts a total market cap of $60.79 trillion and total revenue of $17.39 trillion.

The rapid rise of AI-related stocks has sparked ongoing debate about whether the sector is entering a speculative bubble reminiscent of the dot-com era. On one hand, there are clear signs of speculation. Companies like Nvidia and Palantir are trading at exceptionally high valuations, with Palantir reportedly valued at over 110 times its sales, which exceeds even Amazon’s peak during the dot-com boom. Nvidia’s price-to-sales ratio has also raised eyebrows, suggesting that investor enthusiasm may be outpacing the underlying fundamentals.

Market concentration is another point of concern. The group of just 63 AI-focused stocks has a market cap that represents more than 30% of the total market capitalization of the S&P 500. The so-called “Magnificent Seven” – Alphabet, Amazon, Apple, Meta, Microsoft, Nvidia, and Tesla — collectively account for more than 30% of the S&P 500 index, surpassing levels seen in 2000. Since the launch of ChatGPT, AI-related stocks have driven 75% of the S&P 500’s returns, indicating a heavy reliance on a narrow sector for growth.

Investor behavior also mirrors past bubbles. Advisors report that clients are increasingly chasing “anything AI” in pursuit of short-term gains, which could expose them to concentrated risk. This enthusiasm, combined with aggressive infrastructure expansion, raises concerns about potential overcapacity, reminiscent of the overbuilding of fiber-optic networks during the dot-com era and the housing market’s collapse driven by overly optimistic projections.

However, there are strong counterarguments as well. Unlike many dot-com startups, today’s AI leaders — such as Nvidia and OpenAI — are highly profitable and generating tens of billions in revenue. The technological complexity of AI creates high barriers to entry, reducing the likelihood of a surge in speculative, unsustainable startups like those witnessed in the late 1990s.

While the current AI boom has similarities to past bubbles — particularly regarding valuation and investor exuberance — it is also supported by real economic value, substantial earnings, and transformative technology. Whether this surge proves to be a sustainable revolution or just a fleeting bubble will depend on how well future expectations align with actual long-term adoption and profitability.

Our approach remains consistent; we identify three key opportunities in AI: companies that directly provide AI technology, “pick and shovel” companies that supply the necessary infrastructure for AI delivery to consumers, and finally, those companies that effectively apply AI to enhance productivity. When we identify the best candidates, we invest in them and hold onto our positions as long as they align with our investment thesis.

We also consider taking some profits during an uptrend to invest in new opportunities or other areas of our portfolio. While holding cash is often seen as counterproductive for money managers, legendary investors like Howard Marks and Warren Buffett have incorporated cash accumulation into their strategies, ensuring they are ready to buy during market downturns when opportunities arise. In fact, Buffett recently stated that Berkshire “made a lot of money by not wanting to be fully invested at all times”. The appropriateness of this strategy depends on its specific purpose; for example, holding cash might not be wise in a dividend-compounding strategy.

Dollar Devaluation

We recently saw statistics that reminded us of the insidious effects of inflation.

Fifty years ago, when we were graduating from high school, the Nominal Income was $7,600 per year before taxes ($45,000 per year in 2025). Housing costs consumed 517% of income versus 803% today. The average price of college was 28% of annual income, versus 65% today, and a new car was 55% of the yearly income, versus 75% today. Perhaps the cruelest piece of data we found was that in 1975, entry to Disneyland in Anaheim, California was $7.50 per person, today it’s $224.

What does that have to do with retirement? As pensions continue to disappear, we take more responsibility for providing our own retirement income. A male retiring at age 65 in 1975, could expect to live an additional 13.7 years according to the CDC. A female retiring at the same age could expect to live an additional 18.1 years. By 2022, the numbers had increased to 18.1 and 21.3 years, respectively.

The rule of thumb, as espoused by Target Date retirement funds, is to reduce your exposure to equities over time while increasing your allocation to cash and bonds. However, your specific lifestyle and potential longevity need to be factored into your investment decisions, or you risk financial hardships in your later years.

As an extreme example, investing $5.0 million in a 20-year Treasury at 5% would yield $250,000 in annual distributions. However, even at 2% inflation, the buying power of that distribution is reduced to approximately $167,000 by year 20.

And right now, even the 30-year Treasury is only yielding 4.7%

This is why we don’t treat investment accounts as monolithic. Instead, we allocate assets intentionally to reflect your financial objectives, aligning each account or investment with a specific purpose, time horizon, and risk tolerance.

We know this requires more work on your part between the initial surveys, annual financial updates, and risk tolerance questionnaires. However, we know from both experience and research that, in the long run, the extra work is worth it. It’s how we approach personal finance, it’s what we’d look for in an advisor, and we work hard to do it better every day.

As always, thank you for your trust in us and the opportunity to work with you.

Read More

Thomas Carroll, CFA

Financial Advisor Tom Carroll
Tom joined Summit as Vice President in 2012.  His responsibilities include portfolio management, investment research, and compliance, among others.

Prior to joining Summit, Tom spent twenty-six years with Northwestern Mutual and its investment management subsidiary Mason Street Advisors (MSA). At Mason Street, Tom headed the company’s six member foreign equity investment team as Managing Director.

From his appointment as portfolio manager in 1992, Tom built and successfully managed what was a very modest $58 million portfolio into a group of portfolios with combined assets in excess of $4 billion and included companies from every corner of the globe.

Earlier in his career at MSA, Tom set up the company’s first index fund, developed and managed a number of quantitatively based equity portfolios, and initiated and managed the firm’s mid-cap equity portfolio.

Previously, Tom served as an equity portfolio manager and/or analyst at Texas Commerce Bank, MGIC Investment Corporation, and Trust Company of Georgia.

Summit Investment Management, Ltd. (2012 – Present)

  • Vice President and Chief Investment Officer

Mason Street Advisors (a subsidiary of Northwestern Mutual) (1983 – 2009)

  • Managing Director – Equities

Texas Commerce Bank (1983)

  • Portfolio Manager / Analyst

MGIC Investment Corporation (1979 – 1983)

  • Assistant Portfolio Manager / Assistant to the President

Trust Company of Georgia (1977 – 1979)

  • Securities Analyst

Education

  • M.S. (Finance) – University of Wisconsin (Madison)
  • B.B.A. (Finance, Accounting) – University of Wisconsin (Madison)

Read More