The Great Rotation
First, I would like to wish everyone a joyful and safe celebration of our nation’s 250th Independence Day.
Having traveled extensively around the world, I can say with complete conviction that only in America could the son of a high school dropout and a war bride with a sixth-grade education have the opportunity to do something he loves and share it with others. That opportunity was made possible not by privilege or pedigree, but through hard work, prudent budgeting, and a simple desire to serve.
America is far from perfect, and it has never claimed to be. Yet what makes this nation extraordinary is not the absence of flaws, but the freedom to confront them. We the People possess the ability to come together as citizens, repair what has been damaged, strengthen what has been weakened, and preserve what remains noble and good—without being constrained by powers beyond our control.
For all its imperfections, America remains a place where hope, opportunity, and self-determination endure. For that, and for the countless sacrifices that have made such freedom possible, I remain profoundly grateful.
The core message this quarter is straightforward: market leadership appears to be broadening beyond the narrow AI and mega-cap technology trade, creating a healthier backdrop for equities while reinforcing the need to own durable companies at reasonable valuations rather than chase momentum at any price.
The major indices ended the second quarter and the first half of the year at record levels with the tech-heavy Nasdaq leading the way.
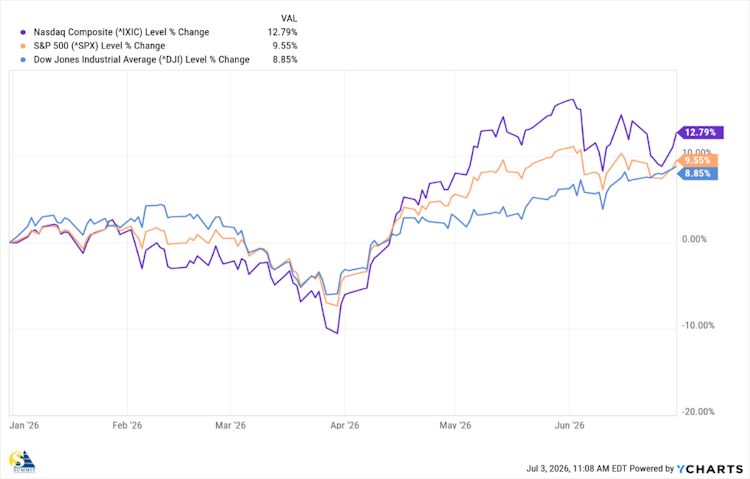
The drawdown at the beginning of the quarter appeared to be driven in large part by the conflict with Iran. As we wrote in our Q1 2026 Letter:
“Historical evidence shows that U.S. stocks are often volatile at the onset of war or geopolitical conflict but tend to stabilize and perform well once uncertainty is resolved.”
That outcome provided another reminder that while history may not repeat, it often rhymes.
While the indices marched higher in May and June, the day-to-day action revealed an important underlying change in sentiment that was often lost in the headlines.
Throughout the day, we often use Heat Maps to detect buying and selling pressure across sectors, especially on days when economic data or macro headlines are driving rapid shifts in investor behavior.
Heat maps are two-dimensional visual representations of financial data that use color intensity and tile size to simultaneously display the performance, volume, or liquidity of stocks and sectors. Here is what one may look like on a strong up day:
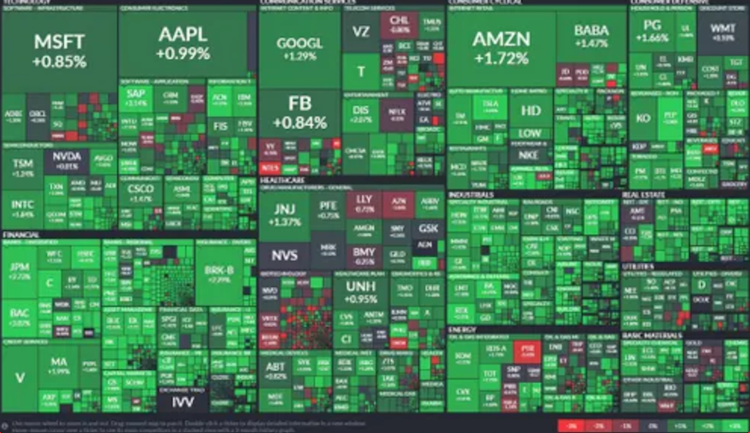
Green shades indicate positive price changes or increased volume, while red shades signal decline. The intensity or darkness of the color reflects the magnitude of the movement, with deeper shades representing stronger performance or volatility.
What we saw in late May and most of June was not quite as consistent as what is pictured above.
On a day when all the major indices were up, the heat map might show a market where the gains are concentrated in only a handful of the largest stocks.
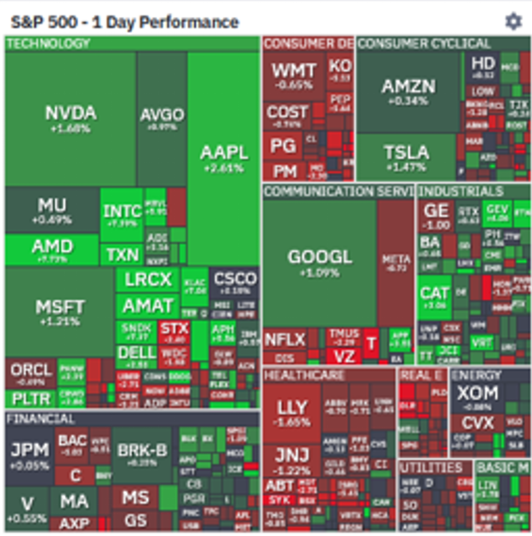
On a flat or slightly down day, the pattern was often just as revealing, with weakness in the mega-cap leaders masking more constructive action beneath the surface.
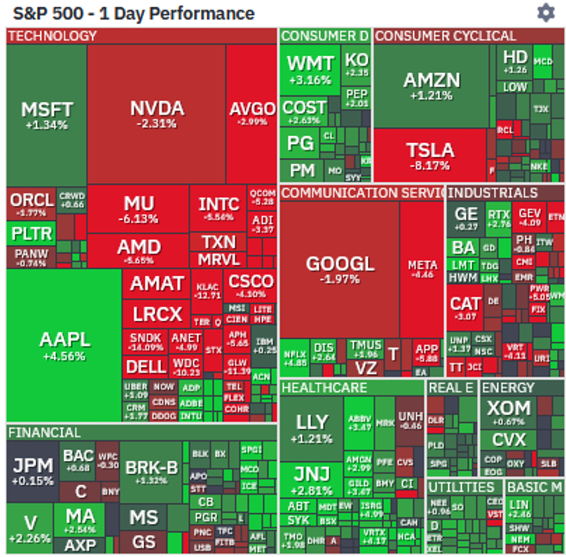
This highlights the outsized influence of the AI trade on both the S&P 500 and the Nasdaq. It also suggests that large investors may be beginning to rotate out of the most crowded AI winners and into stocks that appear more reasonably valued.
We see similar evidence in the performance of the S&P 500 Equal Weight Index, which has outperformed its capitalization-weighted counterpart year to date:
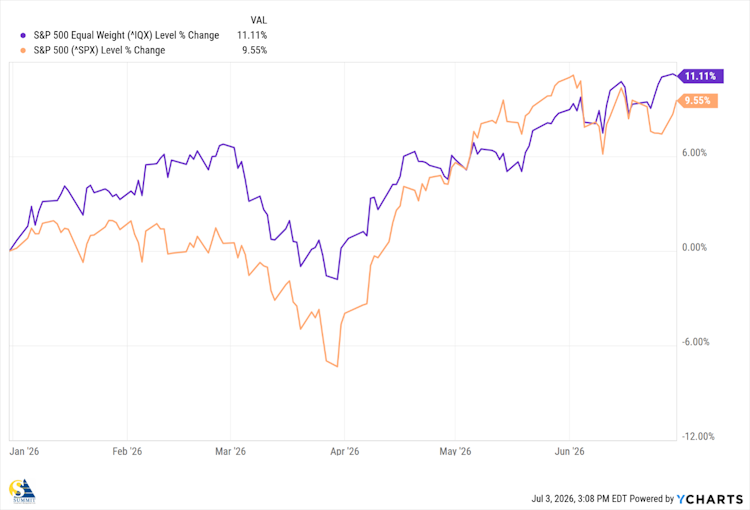
This is a constructive indicator because it suggests the bull market may be spreading across more sectors without a meaningful increase in panic. If earnings continue to grow, the setup could remain supportive into year-end, although that outlook could be challenged by weaker-than-expected earnings, renewed valuation compression, or another geopolitical shock.
The AI Trade
None of this suggests that the AI trade is dead; far from it. AI may represent a generational opportunity with the potential to improve productivity across many parts of the economy. Historical comparisons would include the railroad, the combustion engine, the PC, the internet, and the smartphone. However, in nearly all of these examples, the technology was not immediately practical, profitable, or investable.
Not every company in these new industries became a winner, and we expect many AI-related winners and losers over time. Successful investing in disruptive technology requires two things: finding the big winners and avoiding the big losers. That is easier said than done, especially in an environment where momentum money is chasing extreme valuations and many expert commentators are offering word-salad rationales that can be reduced to four familiar words: “this time it’s different.”
After the massive gains, we investors need to weigh a real demand story against valuations that already reflect considerable optimism. If history is any indication, AI, just like most transformative innovations, will be constrained by different factors at different periods of time. Railroads needed track, cars needed paved streets and highways, electricity needed wires. Constraints cause market imbalances that can create opportunities but also introduce more risk.
Today, AI relies heavily on chips, and current capacity appears insufficient to meet the needs of many AI developers. As a result, investors have been allocating capital to both chipmakers with pricing power and the companies that make the equipment used to assemble those chips.
In turn, these chipmakers are investing in capacity expansion to meet rising demand, which may relieve supply constraints and help stabilize prices over time. Other constraints include computing capacity, memory storage, and energy. In each case, supply and demand imbalances can influence stock prices as short-term traders chase companies perceived to benefit, whether or not they are profitable. Much of the day-to-day price action appears to be based on headlines and price charts, not fundamentals.
Our approach is to identify industries that may benefit from the adoption of AI—chipmakers, cloud hyperscalers, networking and cooling infrastructure, construction and engineering, and energy companies—and then use our research to find financially sound, well-managed companies in those areas with the goal of holding them for the long term. You will find them included in our core growth and income strategies, but not at elevated concentrations that would leave accounts overly vulnerable to short-term volatility.
The SpaceX IPO
Speaking of innovation, SpaceX (SPCX) went public in what was among the most hyped-up IPOs of my lifetime.
The only two IPOs I can remember having anywhere close to the same notoriety were Google (GOOG) in August 2004, and Facebook, now Meta (META), in 2012, and neither seemed to generate the same level of retail attention around SpaceX.
Our inboxes were filled with email “offers” to “acquire pre-IPO shares” if we signed up for a subscription to a newsletter or trading service, and our phones were ringing with calls from strangers, not clients, who hoped we could buy pre-IPO shares for them. It is disheartening to see people in this business exploit the public’s fear of missing out for short-term financial gain. Technically, it may not be illegal, but we would hope for better moral behavior.
The “pre-IPO” exposure was available through mutual funds, ETFs, or special purpose vehicles offered by certain crowdfunding services.
While investors may have gained exposure technically before the IPO, these funds were rarely the original seed investors. In many cases, the fund likely bought shares from an earlier investor who had already captured a substantial gain. Instead of getting in at $1.00 per share, or even $10 per share, the fund may have been paying $80, $90, or more.
In the case of SpaceX, which priced its IPO at $135 per share, much of the “life-changing money” may already have been made by earlier investors. One fund touted as owning more than 20% of pre-IPO SpaceX shares was reportedly up only 8% shortly after the IPO. While that is not a bad seven-day return, it is not enough to allow anyone to quit a day job.
After a little less than a month, SpaceX has pulled back from its peak of $201.80 but is still trading above its IPO price of $135, based on market data available at the time of writing. While the initial excitement has cooled, it remains difficult to determine its short-term prospects for a buying or selling opportunity. Looking at the current group of Magnificent 7 stocks for historical context, we see a wide range of performance even five years after their IPOs.
| Company | IPO Price | Price 5 Years Later | 5-Year Return |
|---|---|---|---|
| Amazon (1997→2002) | $18 | ~$15 | -17% |
| Apple (1980→1985) | $22 | ~$18 | -18% |
| Microsoft (1986→1991) | $21 | ~$90 | +329% |
| Nvidia (1999→2004) | $12 | ~$23 | +92% |
| Google (2004→2009) | $85 | ~$310 | +265% |
| Tesla (2010→2015) | $17 | ~$48 | +182% |
| Facebook/Meta (2012→2017) | $38 | ~$180 | +374% |
With both Apple and Amazon delivering negative returns over the periods shown, and would have been cheaper to buy, it is difficult to know where SpaceX may be five years from now. Like Amazon at the time, SpaceX is not currently profitable, and public estimates suggest it has accumulated substantial losses since its founding nearly 25 years ago. However, like Amazon, it also has promising technologies that could drive sustainable growth over time, including XAI, Starlink, and Starshield, its satellite defense subsidiary.
SpaceX may also benefit from recent rule changes at major U.S. stock indexes. Nasdaq’s fast-entry methodology can allow a newly listed Nasdaq company that ranks among the top 40 current Nasdaq-100 constituents by market capitalization to be added after 15 trading days from the IPO, subject to the index provider’s rules and announcement process. FTSE Russell has also adopted a fast-entry process for certain large IPOs in its Russell U.S. Equity Indexes. So far, the only major index not making this type of change is Standard & Poor’s, which oversees the S&P 500.
Still, many passive investors have money in funds that track Nasdaq and Russell indices, such as QQQ and IWB, as well as passive 401(k) plan funds that track those indexes. In the case of a 401(k), new shares may be purchased every pay cycle, and those funds generally seek to track index holdings in proportion. That mechanical demand could help support shares in the short term as the business evolves, but it does not eliminate execution, valuation, or profitability risk.
That said, index inclusion should not be confused with investment merit. Forced buying can create short-term support, but long-term returns will still depend on revenue growth, margins, capital discipline, and valuation.
While SpaceX is an interesting company, we intend to hold it only in our most speculative strategies unless there is a clearer record of earnings momentum, execution discipline, and valuation support.
Looking Ahead
In the good old days, we’d spend the summer catching up on research and business processes, after the big money “sold in May and went away.” These days, with so much automated trading moving the markets, there really is no longer a summer swoon to relax and enjoy.
With the Russia-Ukraine war and the Iran conflict not fully resolved, a new Federal Reserve Chairman, and the market’s unpredictable reaction to technology earnings, we expect volatility to remain elevated.
As always, our views are based on information available at the time of writing and may change as facts, valuations, and risks evolve.
While we keep our eyes on the horizon, we wish you all a pleasant summertime, whether traveling or enjoying your own backyard.