
A Year of Headline Risk?
In our Q4 letter, we outlined the reasons why the markets could have a volatile year, and it didn’t take long for volatility to emerge, with the Nasdaq Composite leading all indices lower.
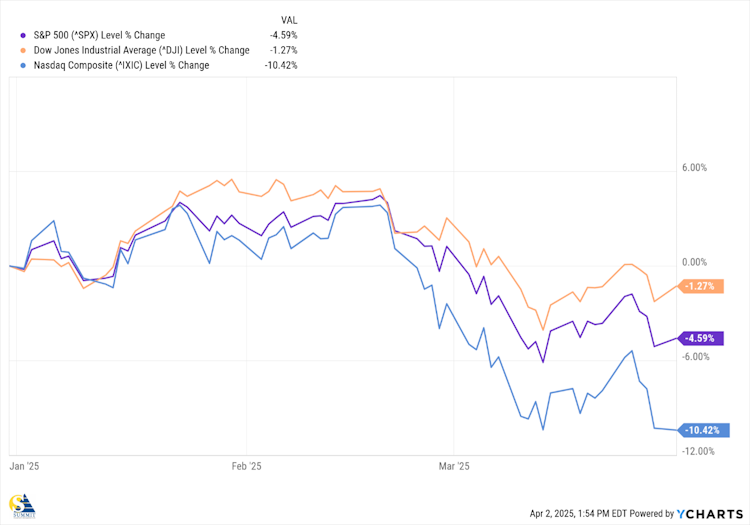
It’s not surprising for long-time market watchers, given the 20%-plus returns in 2023 and 2024 for the S&P 500. The historic average for the index is closer to 10%, so a pullback or even a correction was inevitable.
Comparing the equal-weighted S&P 500, as measured by the ETF, RSP, to the market-cap-weighted S&P 500 represented by SPY, we see that although both saw a fair share of volatility, the equal-weighted index is still very close to breakeven year to date, versus a -4 % decline for the market-cap-weighted index.
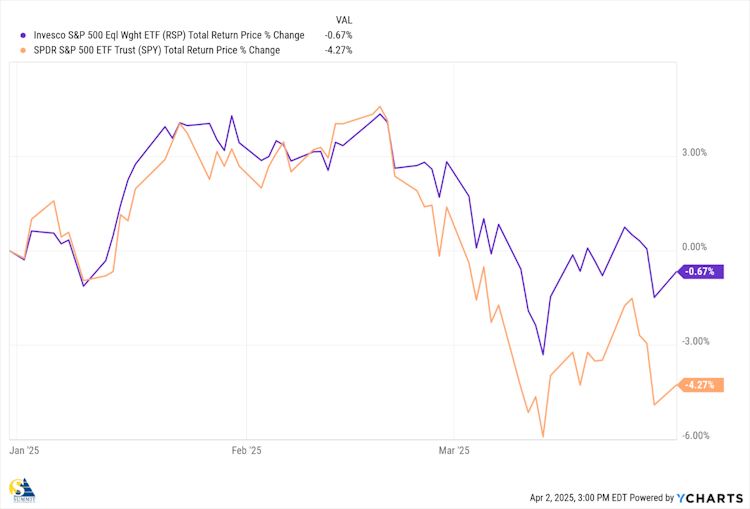
This is a good indication that “certain stocks” had an outsize impact on performance, while many stocks were treading water or even increasing in price.
The “Magnificent Seven” certainly played a role in both the S&P 500 and Nasdaq returns, with all but META falling into correction territory. As one investing publication put it, “it’s a Magnificent Bear Market!”

While a sell-off can be unsettling, stepping back, we can see that this is the fourth “pullback” since the market bottomed in October 2022.
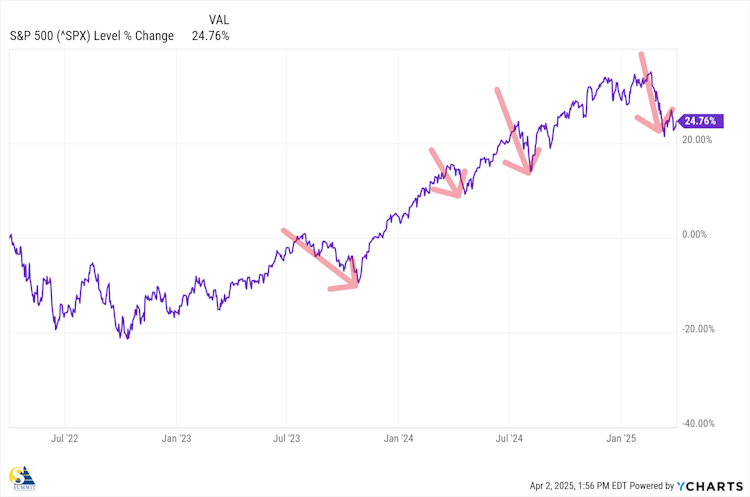
This serves as a reminder that, although it may not always feel that way, markets typically do not move straight up or down. When prices get a little ahead of themselves, they will either drift sideways for a while or will correct as traders take profits.
In our Q2 2024 Client Letter we noted that:
“NVIDIA’s Price to Sales ratio (P/S), is presently around 38 but had been in the 40s before the latest pullback. Price to Sales is a simple ratio that tells us how much investors are paying for a dollar of sales. So, anyone buying NVIDIA stock today is paying $38 for every dollar of sales NVIDIA generates. By comparison, the P/S ratios of the other six average out to 8.2, which implies that if NVIDIA were to trade in line with the other six companies, its price would have to drop to around 80%”
Today, despite year-over-year revenue growth of 78% or more and earnings growth of 80% or more in February, the price has dropped 28% from its 52-week high, and the P/S ratio of the stock is now at 20, still more than double its six other “Magnificent members,” but half of what it was a little less than a year ago.
Looking Behind the Headlines
Much of this quarter’s volatility has been attributed to “tariffs” and, on a day-by-day basis, that might be true, however, other things are going on that also contribute to negative sentiment, particularly the end of the stealth QE that had been in place since the collapse of Silicon Valley Bank in March of 2023.
Right after they closed Silicon Valley Bank, US regulators immediately rolled out emergency measures that included ensuring that all depositors with the failed bank would have access to all their money, not just the $250K guaranteed by the FDIC.
More significantly, the regulators included a measure allowing banks to borrow essentially unlimited amounts from the Federal Reserve for the “next year”, as long as safe government securities (Treasury bonds) as collateral. This ensured that banks could meet withdrawal demands without having to sell their government bonds that had declined in value over the past year, as interest rates had risen. They hoped the increased bank liquidity would short-circuit the type of bank runs that doomed Silicon Valley and Signature banks.
There was not much fanfare around these actions even though they were quite historic. Fed Chairman Powell did not announce that he was making a policy shift, in fact he continued to talk tough on inflation. But, behind the scenes, the new measures began to provide liquidity to financial markets and the stock market rose nearly 20% by August.
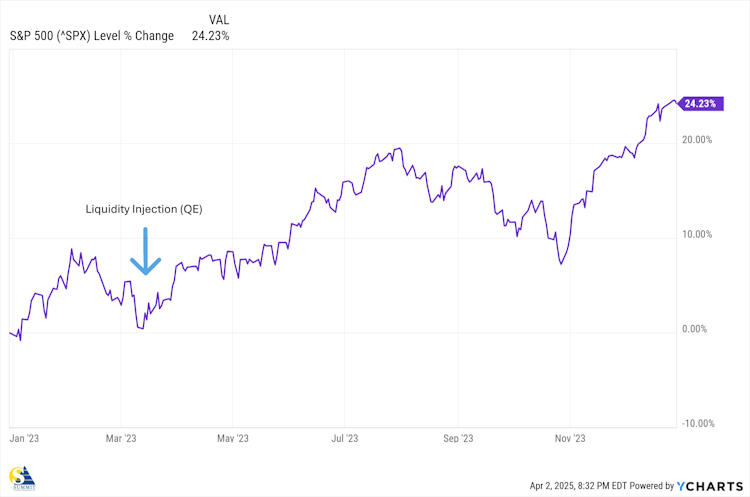
It seems like Powell had learned his lesson from the 2020 COVID Crash. Looking at the chart below, you can see how the massive amount of liquidity (green line) introduced shortly after the market crashed in March of 2020 (blue line) pulled the market higher until 2022 when the Fed started “tightening” by increasing interest rates.
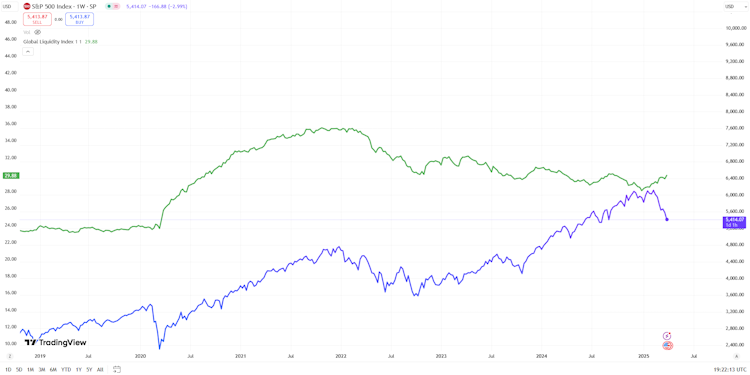
The last Fed rate hike occurred in July of 2023 and the Fed Funds Rate has come down 100 Basis Points (1%) since September of 2024.
The original QE, which was in response to the financial crisis created by the popping of the Housing Bubble, not only included liquidity injections but also interest rate manipulation, and things were no different this time around. While Powell was still talking tough about inflation, then-Treasury Secretary Janet Yellen was breaking with long-standing policy by financing the Federal budget deficit with short-term debt obligations.
The net effect on the bond markets was to keep the long end of the yield curve low. Everything from corporate borrowing to mortgage rates is impacted by the yield on the 10-year Treasury, and she knew that big 10-year Treasury auctions would put a short-term strain on liquidity in the capital markets.
A study by celebrity economist Nouriel Roubini concluded that the 10-year yield would have been 30 to 50 basis points higher without this practice. A 50-bp increase in the 10-year yield will have similar economic effects as a two-point hike in the Fed Funds rate, potentially reigniting the bond market sell-off we saw in 2022 and further damaging the nation’s banking sector.
Whether she would ever admit it or not, it’s obvious to us that Yellen wanted a “stable” economy and rising stock market in an election year, as people generally vote with their wallets in a national election.
Unfortunately, Yellen sold so many short-term bills to fund the deficit in 2024 that she left her successor, Scott Bessent, well over $7 trillion in maturing debt the Treasury must refinance in 2025.
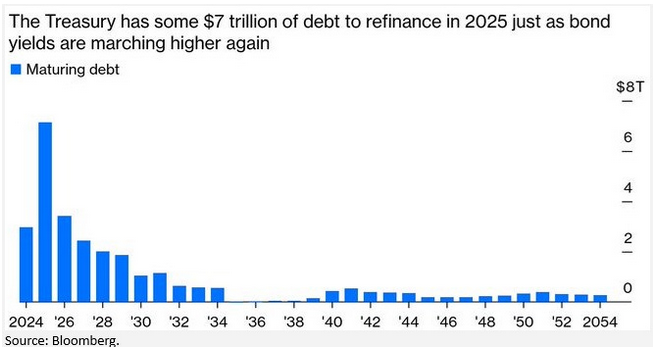
This refinancing peak that you see in 2025 represents a significant challenge to US economic stability, with potential repercussions for global financial markets. It would be helpful if interest rates were to come down, saving on interest, but so far, Powell seems content to keep the Fed Funds rate where it is for now.
Since his confirmation, the new Secretary of the Treasury, Scott Bessent, has repeatedly stated in interviews that he is focused on the 10-Year Treasury yields and indicated that the administration would use fiscal policy to try to bring them down. We could write a full letter on what those policies may be, but instead, we will just note that the rate on the 10-Year Treasury was above 4.5% when Bessent was confirmed, and they stood at 4.23% as of March 31, 2025.
Margin Call Selling-another under-reported factor
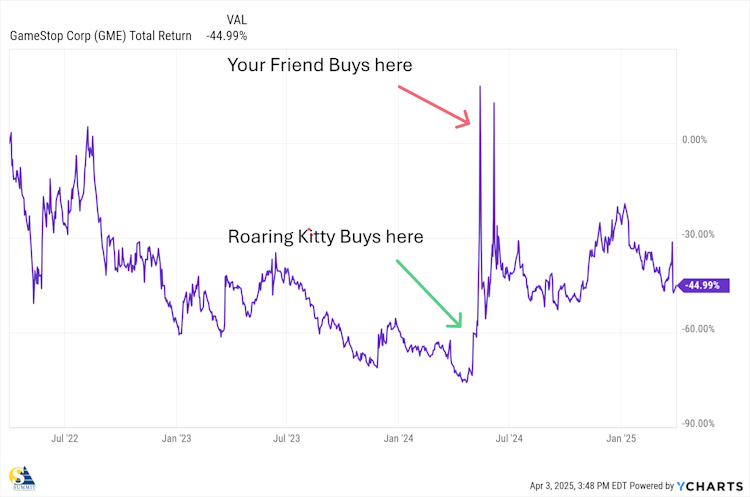
Many of us have acquaintances who opened a margin account and made a leveraged bet on a penny or meme stock like GameStop (GME) at the wrong time and were forced to sell by their broker in order to cover the money they borrowed to buy more shares than they could afford.
But it’s not just friends and family that buy on margin; it’s also very large Institutions and private fund managers, who are responsible for 80% of the daily market volume, buying on margin.
Many of these managers were “rising stars” at some investment bank who then left to start their own fund, often charging 2% of assets and 20% of profits to manage clients’ money. The AUM of these funds often reaches tens of billions of dollars.
They can attract large clients and charge exorbitant fees because they promise to outperform an index like the S&P 500. Most of them achieve this by using leverage, which involves trading on margin.
For example, if I take $100,000 of a client’s money and use leverage to buy $130,000 of stock that increases by just 10%, the client’s return on their $100,000 is 13%, compared to 10% without leverage. I “outperformed” buying the same stock as the unleveraged account. This is how leveraged ETFs, such as TQQQ (offering 3x the daily return on the NASDAQ 100), work.
As the chart below shows, this past January had the highest margin debt balance ever recorded: nearly $1 trillion.
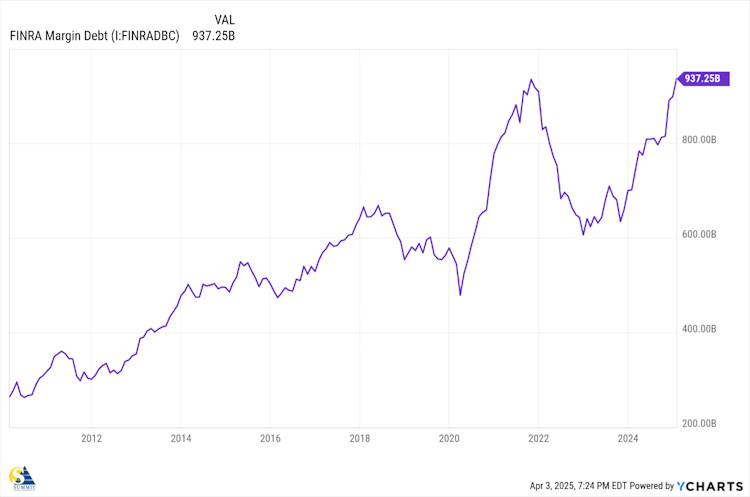
When a fund manager gets a margin call, they can either sell shares themselves to reduce the margin or the broker will sell for them. Either way, they sell, and the rest of us get caught up in the price drop because their volume is what drives the market. Often, this causes smaller investors to panic and sell when they shouldn’t.
If we superimpose the S&P 500 on the margin chart, we can see the impact of this forced selling.
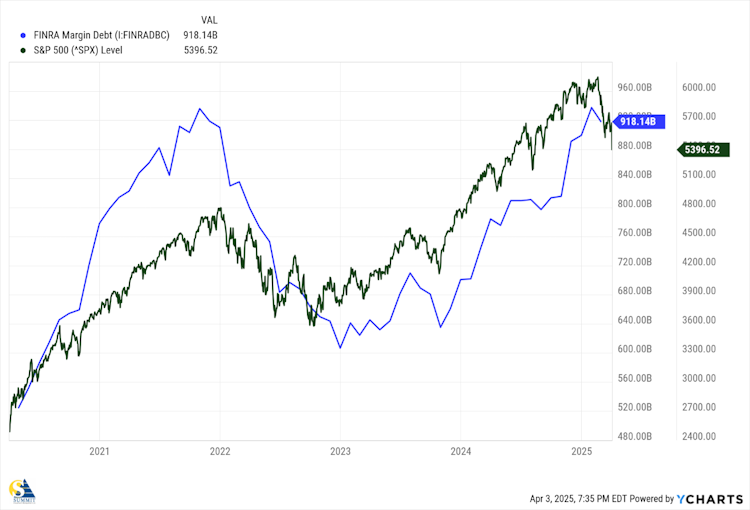
The good news for long-term investors is that it makes some of the absolute best stocks in the market trade at big-time bargains, or with NVDA, at least a more reasonable price.
What do we mean by Headline Risk?
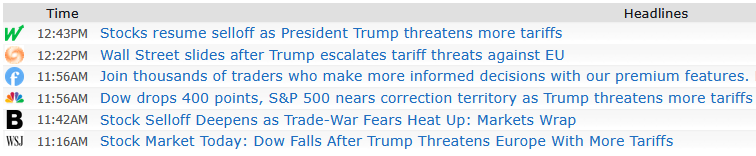
Here is a screenshot of Finviz.com Headlines taken on March 13, while the market opened down:
On the same day, we saw positive economic data released:
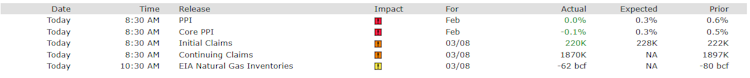
Producer prices were significantly below expectations, Initial jobless claims were lower than expected, and continuing claims decreased from the prior month. Yet, on that day, the S&P 500 closed down 1.38%.
This shows the impact of computerized trading, where computers scan the headlines in microseconds and place trades based on how the program instantaneously interprets the information.
According to Statista.com, in the U.S. stock market, it’s estimated that 60-75% of daily trading volume is attributed to computer-based or algorithmic trading, much of which is conducted by large private funds, such as those mentioned above. This means that algorithms rather than humans execute a significant majority of trades.
This is bad news for retail market traders who don’t have the computing power to keep up with these massive trading programs. However, if you’re holding a portfolio of great businesses, plenty of cash or cash equivalents, some government-guaranteed securities, or investment-grade corporate or municipal bonds, you’re in a strong position to enjoy a beverage, grab some popcorn, and watch good stocks go on sale.
We never want our financial independence to be threatened by market turbulence, and if possible, we want to position our investments to take advantage of it. Buying oversold quality stocks during bull markets is one of the best strategies for achieving that.
As always, we appreciate your trust in us. We will continue to monitor the markets, as well as micro- and macro-economic developments, and our holdings, so that we can act as necessary in the best interest of your accounts.
If you have any questions, comments, or concerns, please do not hesitate to contact us at your convenience.

